CAPSLOCKSTUCK
Spaced Out Lunar Tick
- Joined
- Feb 26, 2013
- Messages
- 8,578 (2.11/day)
- Location
- llaregguB...WALES
| System Name | Party On |
|---|---|
| Processor | Xeon w 3520 |
| Motherboard | DFI Lanparty |
| Cooling | Big tower thing |
| Memory | 6 gb Ballistix Tracer |
| Video Card(s) | HD 7970 |
| Case | a plank of wood |
| Audio Device(s) | seperate amp and 6 big speakers |
| Power Supply | Corsair |
| Mouse | cheap |
| Keyboard | under going restoration |
- The map is based on cloud cover data taken from July 2002 until April 2015 by Nasa's Aqua satellite
- Dark blue represents no clouds, light blues are some clouds, while white areas indicate frequent clouds
- It shows how Earth is more likely to be cloudy near the equator and two wider strips in the mid-latitudes

That might sound like a huge amount, but this map released by Nasa reveals just what a cloudy place our planet can be.
The map is based on data taken from July 2002 until April 2015, offering a space-based view of cloudy skies as seen by the Aqua satellite.
Dark blue represents no clouds, light blues are some clouds, while white areas indicate frequent clouds.
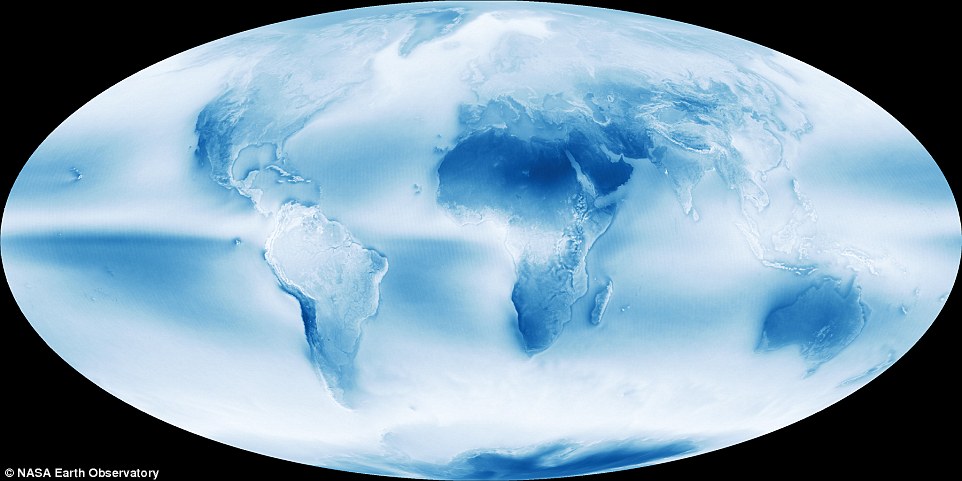
There are three broad bands where Earth’s skies are most likely to be cloudy: a narrow strip near the equator and two wider strips in the mid-latitudes.
The band near the equator is caused by the large scale circulation patterns - or Hadley cells - present in the tropics.
WHAT ARE HADLEY CELLS?
The band near the equator is caused by the large scale circulation patterns - or Hadley cells - present in the tropics.
Hadley cells are defined by cool air sinking near the 30 degree latitude line north and south of the equator and warm air rising near the equator where winds from separate Hadley cells converge.
As warm, moist air converges at lower altitudes near the equator, it rises and cools and therefore can hold less moisture.
This causes water vapour to condense into cloud particles and produces a dependable band of thunderstorms in an area known as the Inter Tropical Convergence Zone (ITCZ).

As warm, moist air converges at lower altitudes near the equator, it rises and cools and therefore can hold less moisture.
This causes water vapour to condense into cloud particles and produces a dependable band of thunderstorms in an area known as the Inter Tropical Convergence Zone (ITCZ).
Clouds also tend to form in abundance in the middle latitudes 60 degrees north and south of the equator.
This is where the edges of polar and mid-latitude circulation cells collide and push air upward, fuelling the formation of the large-scale frontal systems that dominate weather patterns in the mid-latitudes.
While clouds tend to form where air rises as part of atmospheric circulation patterns, descending air inhibits cloud formation.
Since air descends between about 15 and 30 degrees north and south of the equator, clouds are rare and deserts are common at this latitude.
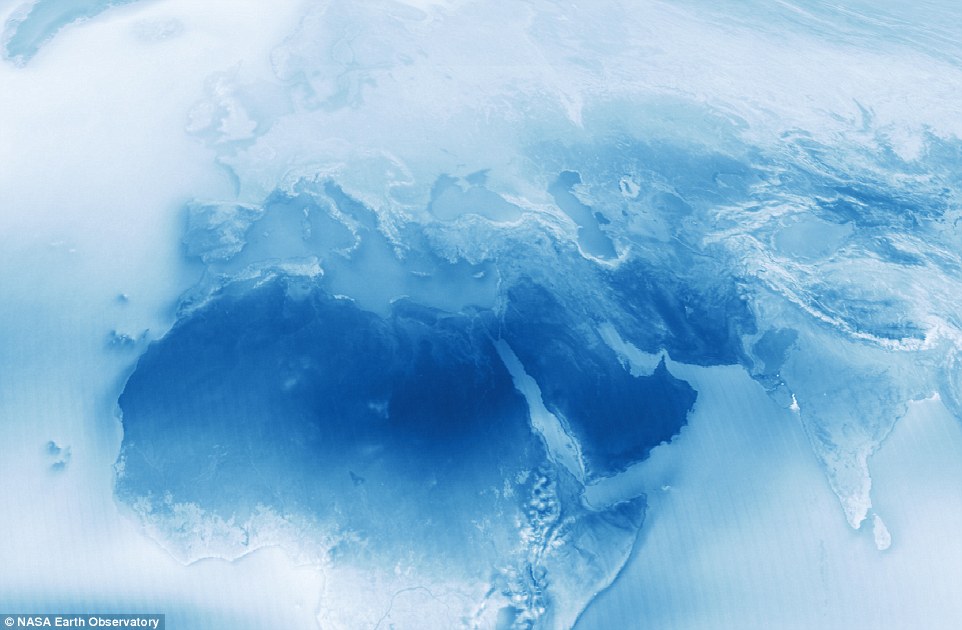
Ocean currents govern the second pattern visible in the cloudiness map: the tendency for clouds to form off the west coasts of continents.
This pattern is particularly clear off of South America, Africa, and North America. It occurs because the surface water of oceans gets pushed west away from the western edge of continents because of the direction Earth spins on its axis.
In a process called upwelling, cooler water from deep in the ocean rises to replace the surface water.
Upwelling creates a layer of cool water at the surface, which chills the air immediately above the water. As this moist, marine air cools, water vapour condenses into water droplets, and low clouds form.

Pictured is cloud-covered Guadalupe Island, a volcanic edifice ff the coast of Mexico’s Baja California peninsula. When this astronaut photograph was taken, winds were blowing from the north (left) across the island, giving rise to a series of atmospheric eddies that appear as circles and swirls in the clouds downwind. Techniques to monitor clouds such as this still needs some improvement, claims Nasa

http://www.nasa.gov/


