 15
15
G.Skill RipjawsX F3-2133C9Q-32GXH 32 GB PC3-17000 1.6 V DDR3 Review
Overclocking »Performance Results
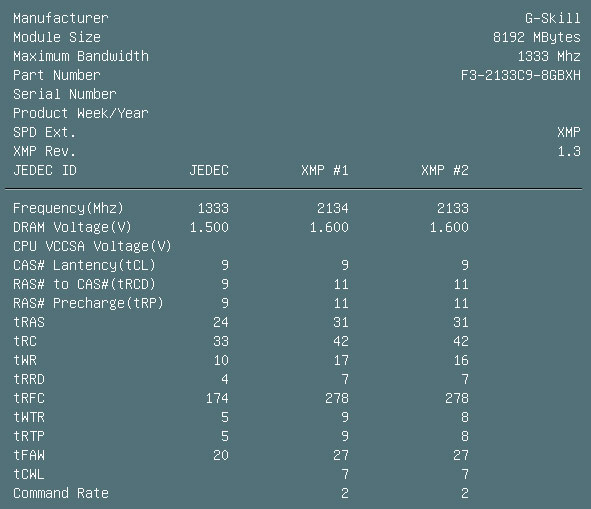

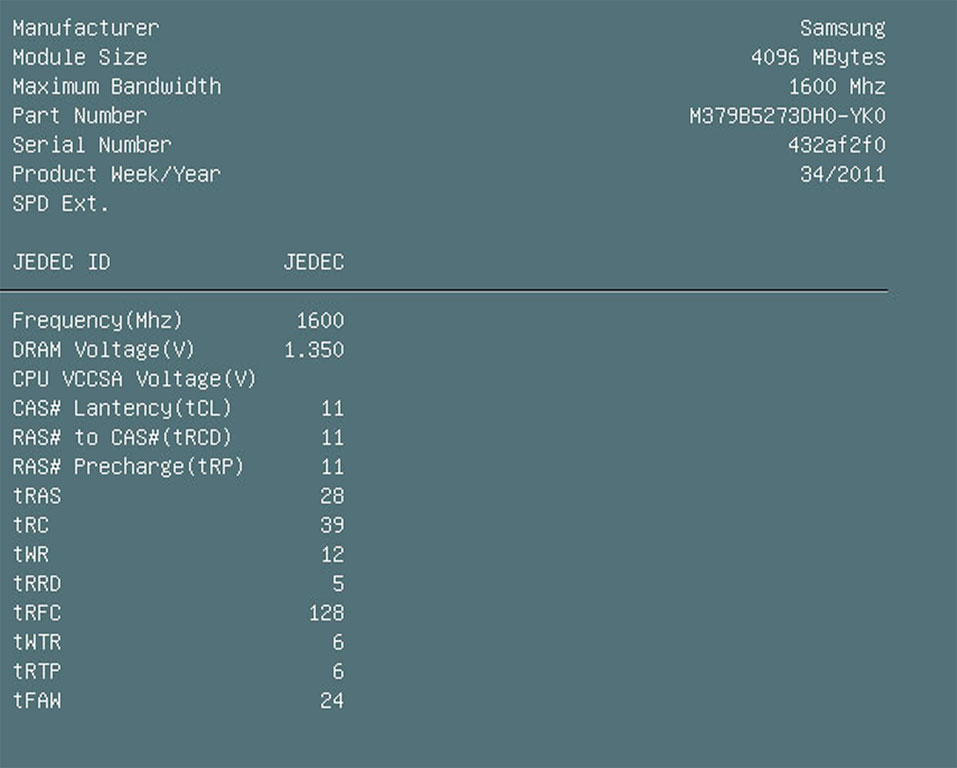


The above five images are screen captures from within the ASUS P9X79 Deluxe's BIOS. The first image shows the G.Skill module's offered profiles, including the primary as well as secondary timings that the module uses depending on which profile is enabled. This handy screen can help users manually set timings, but it's also worth mentioning that simply selecting and enabling "XMP" in the ASUS BIOS will automatically set most of these timings, but we did find that a few of the timings were different than what is reported in the screens above with some sticks. I've also included the same screenshot from the Patriot, Samsung, G.Skill, and Mushkin sticks, so we can see the obvious differences and similarities in timings.
My testing usually involves using only the automatic settings applied by the BIOS, as this is what most users will do as well, so the results that follow should be able to be replicated by anyone with the same components. I have tested the different modules with the primary JEDEC profile, as well as the XMP profile for sticks that offer it, and the results are below.
The numbers below reflect performance results with two modules installed for the Patriot and Samsung kits, and four sticks for the other three kits, including the G.SKill F3-2133C9Q-32GXH kit.
SuperPi

SuperPi has been a standard in memory clocking in enthusiast circles for many, many years. Being highly sensitive to timing and speed adjustments both on the CPU and on the memory, SuperPi is also good for stability testing for those just benchmarking. The G.Skill kit ended up in 3rd place in this test, not too bad considering the timings.
wPrime

wPrime is much more focused on CPU performance, but memory plays a role too, although timings are far more critical. The F3-2133C9Q-32GXH kit performed really well here, far better than expected, actually. I expected it to be right in the middle of the pack.
WinRAR

WinRAR makes use of both CPU and memory again, and the test results highlight how perhaps quad-channel mode can be a hinderance to performance. The results here mimic SuperPi results, which is no surprise.
AIDA64 Read Performance

Memory adjustments on the X79 platform affect Read performance more than Copy and Write performance. 2133 MHz kits are on top here of course; 2nd place for the F3-2133C9Q-32GXH is exactly as expected.
AIDA64 Latency Performance

AIDA64's latency test shows very similar results as it did on the bandwidth side of things, which is to be expected.
SiSoft Sandra Bandwidth Performance

SiSoft Sandra's memory test suite provides a slightly different workload than the AIDA64 tests do, so we've employed it for testing too. Here, I found a result 100% unexpected, with the F3-2133C9Q-32GXH kit taking the number 1 spot.
SiSoft Sandra Latency Performance

Latency Performance in SiSoft Sandra closely follows the trend seen in AIDA 64 with quad-channel kits, but again we are left with a different result from using just two sticks. The G.Skill F3-2133C9Q-32GXH kit completly confused us with the results here, such that we had to go back and retest the other 4-stick result, only to be met with the same results. It seems the F3-2133C9Q-32GXH's IC density may be playing a role, and if that's the case, cache results should be great too.
SiSoft Sandra Cache Performance

The SiSoft Sandra Cache test works not only the memory, but also the CPU cache, highlighting how memory performance affects not just the memory itself, but also how your CPU operates. Wouldn't you know it, the F3-2133C9Q-32GXH kit takes the number 1 spot, so seemingly the module's huge density pays off in spades if the workload is there to take advantage of it.
HandBrake Encoding

HandBrake encoding testing followed the results given by wPrime, showing that sometimes timings are more important, but not always. HandBrake results are as expected, matching SuperPi testing quite closely.
CineBench Encoding

Cinebench encoding, on the other hand, provides a much different encoding workload, where it seems raw speed wins out overall. Even though the workload is differnt, the results are pretty much the same as previous tests, which cannot be ignored.
PCMark 7

PCMark7 provides a bit of a daily usage comparison, testing different parts of the system in different ways. Of course, with such linear results in other testing, the win here for the G.Skill F3-2133C9Q-32GXH kit is not surprising.
Shogun 2 CPU Bench

We fired up the Shogun 2 DirectX 9 CPU Performance Benchmark for some game workload testing. Again we are greeted with the expected results.
Even though the F3-2133C9Q-32GXH doesn't seemingly have the best timings ever, there are times that a module's density plays its role too. That's going to come as a surprise to some, but clearly it's been noticed before, as even Microsoft's Windows Experience Index rates memory by capacity as well, although many in enthusiast circles will say size doesn't matter. I'd have to say it does.
Apr 25th, 2024 19:23 EDT
change timezone
Latest GPU Drivers
New Forum Posts
- Core PL1 + GPU PL1 + Ring EDP OTHER (9)
- Best SSD for system drive (79)
- Which new games will you be buying? (315)
- BSOD if I touch the pcache offset voltage in throttlestop (i9-13900hx lenovo pro 7i) (23)
- Alphacool CORE 1 CPU block - bulging with danger of splitting? (16)
- How to check flatness of CPUs and coolers - INK and OPTICAL INTERFERENCE methods (112)
- TPU's Nostalgic Hardware Club (18464)
- Post your Cinebench 2024 score (450)
- Ubuntu 24.04 LTS released (2)
- Dell Workstation Owners Club (3054)
Popular Reviews
- Fractal Design Terra Review
- Thermalright Phantom Spirit 120 EVO Review
- Corsair 2000D Airflow Review
- Minisforum EliteMini UM780 XTX (AMD Ryzen 7 7840HS) Review
- ASUS GeForce RTX 4090 STRIX OC Review
- NVIDIA GeForce RTX 4090 Founders Edition Review - Impressive Performance
- ASUS GeForce RTX 4090 Matrix Platinum Review - The RTX 4090 Ti
- MSI GeForce RTX 4090 Suprim X Review
- MSI GeForce RTX 4090 Gaming X Trio Review
- Gigabyte GeForce RTX 4090 Gaming OC Review
Controversial News Posts
- Sony PlayStation 5 Pro Specifications Confirmed, Console Arrives Before Holidays (117)
- Windows 11 Now Officially Adware as Microsoft Embeds Ads in the Start Menu (106)
- NVIDIA Points Intel Raptor Lake CPU Users to Get Help from Intel Amid System Instability Issues (106)
- AMD "Strix Halo" Zen 5 Mobile Processor Pictured: Chiplet-based, Uses 256-bit LPDDR5X (101)
- US Government Wants Nuclear Plants to Offload AI Data Center Expansion (98)
- AMD's RDNA 4 GPUs Could Stick with 18 Gbps GDDR6 Memory (87)
- Developers of Outpost Infinity Siege Recommend Underclocking i9-13900K and i9-14900K for Stability on Machines with RTX 4090 (85)
- Windows 10 Security Updates to Cost $61 After 2025, $427 by 2028 (84)