 6
6
NZXT HALE90 V2 1000 W Review
Efficiency, Temperatures & Noise »Test Setup
All measurements were performed using two Chroma 6314A mainframes equipped with the following electronic loads: six 63123A [350 W each], one 63102A [100 W x2], and one 63101A [200 W]. The aforementioned equipment is able to deliver 2500 W of load, and all loads are controlled by a custom-made software. We also used a Picoscope 3424 oscilloscope, a Picotech TC-08 thermocouple data logger, a Fluke 175 multimeter, and a Yokogawa WT210 power meter. We also included a wooden box, which, along with some heating elements, was used as a hot box. Finally, we had at our disposal four more oscilloscopes (Rigol 1052E and VS5042, Stingray DS1M12, a second Picoscope 3424), and a CEM DT-8852 sound level meter. In this article, you will find more details about our equipment and the review methodology we follow. Finally, we conduct all of our tests at 40 - 45°C ambient in order to simulate with higher accuracy the environment seen inside a typical system, with 40 - 45°C being derived from a standard ambient assumption of 23°C and 17 - 22°C being added for the typical temperature rise within a system.Primary Rails Voltage Regulation
The following charts show the voltage values of the main rails, recorded over a range from 60W to the maximum specified load, and the deviation (in percent) for the same load range.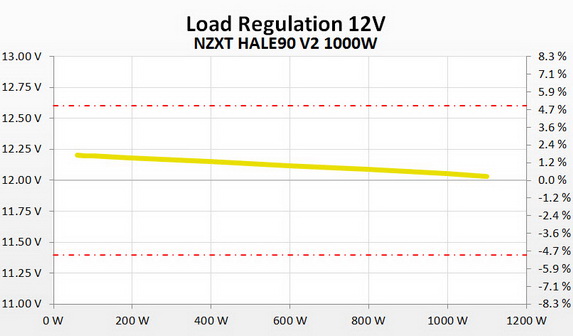


5VSB Regulation
The following chart shows how the 5VSB rail deals with the load we throw at it.
Hold-up Time
The hold-up time is a very important characteristic of a PSU and represents the amount of time, usually measured in milliseconds, that a PSU can maintain output regulations as defined by the ATX spec without input power. In other words, it is the amount of time that the system can continue to run without shutting down or rebooting during a power interruption. The ATX spec sets the minimum hold-up time to 16 ms at maximum continuous output load. In the following screenshot, the blue line is the mains signal and the yellow line is the "Power Good" signal. The latter is de-asserted to a low state when any of the +12V, 5V, or 3.3V output voltages fall below the undervoltage threshold, or after the mains power has been removed for a sufficiently long time to guarantee that the PSU cannot operate anymore.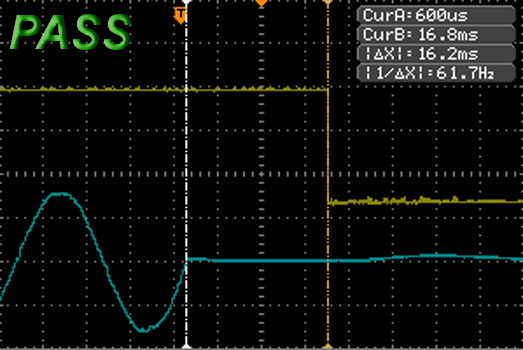
The capacity of the combined APFC caps is small, but the optimized design allows the hold-up time to barely exceed the minimum allowed time that the ATX spec sets.
Inrush Current
Inrush current or switch-on surge refers to the maximum, instantaneous input current drawn by an electrical device when first turned on. Because of the charging current of the APFC capacitor(s), PSUs produce large inrush current right as they are turned on. Large inrush current can cause the tripping of circuit breakers and fuses and may also damage switches, relays and bridge rectifiers; as a result, the lower the inrush current of a PSU right as they are turned on, the better.
The inrush current of this unit is amazingly low! FSP did a marvelous job here.
Voltage Regulation and Efficiency Measurements
The first set of tests revealed the stability of the voltage rails and the efficiency of the HALE90 V2 1000 W. The applied load was equal to (approximately) 20%, 40%, 50%, 60%, 80%, 100%, and 110% of the maximum load that the PSU can handle. In addition, we conducted two more tests. In the first test, we stressed the two minor rails (5V and 3.3V) with a high load while the load at +12V was only 2 A, and, in the second test, we dialed the maximum load that the +12V rail could handle while the load on the minor rails was minimal.| Voltage Regulation & Efficiency Testing Data NZXT HALE90 V2 1000W | ||||||||||
|---|---|---|---|---|---|---|---|---|---|---|
| Test | 12 V | 5 V | 3.3 V | 5VSB | Power (DC/AC) | Efficiency | Fan Speed | Fan Noise | Temp (In/Out) | PF/AC Volts |
| 20% Load | 14.628A | 2.013A | 1.983A | 1.007A | 199.77W | 89.65% | 960 RPM | 38.9 dBA | 37.24°C | 0.960 |
| 12.182V | 4.966V | 3.325V | 4.949V | 222.83W | 43.16°C | 230.0V | ||||
| 40% Load | 29.665A | 4.041A | 3.985A | 1.211A | 399.65W | 92.29% | 1010 RPM | 39.8 dBA | 38.57°C | 0.980 |
| 12.152V | 4.947V | 3.310V | 4.940V | 433.06W | 48.02°C | 229.9V | ||||
| 50% Load | 37.092A | 5.055A | 4.998A | 1.624A | 499.58W | 92.25% | 1190 RPM | 44.2 dBA | 40.38°C | 0.983 |
| 12.136V | 4.935V | 3.299V | 4.922V | 541.53W | 50.65°C | 229.9V | ||||
| 60% Load | 44.539A | 6.089A | 6.015A | 2.035A | 599.56W | 92.31% | 1365 RPM | 46.8 dBA | 41.82°C | 0.990 |
| 12.120V | 4.923V | 3.290V | 4.904V | 649.50W | 52.82°C | 229.8V | ||||
| 80% Load | 59.650A | 8.151A | 8.064A | 2.453A | 799.40W | 91.84% | 1620 RPM | 50.4 dBA | 43.55°C | 0.995 |
| 12.088V | 4.904V | 3.273V | 4.887V | 870.45W | 55.76°C | 229.8V | ||||
| 100% Load | 75.061A | 9.199A | 9.113A | 4.150A | 999.25W | 91.14% | 1865 RPM | 53.0 dBA | 45.18°C | 0.995 |
| 12.052V | 4.887V | 3.257V | 4.814V | 1096.45W | 59.23°C | 229.7V | ||||
| 110% Load | 83.478A | 9.221A | 9.138A | 4.163A | 1099.12W | 90.71% | 1970 RPM | 54.2 dBA | 45.95°C | 0.996 |
| 12.033V | 4.876V | 3.248V | 4.801V | 1211.65W | 60.60°C | 229.7V | ||||
| Crossload 1 | 1.963A | 18.011A | 18.002A | 0.502A | 174.22W | 82.60% | 1585 RPM | 49.9 dBA | 43.05°C | 0.958 |
| 12.180V | 4.919V | 3.288V | 5.036V | 210.93W | 49.53°C | 230.0V | ||||
| Crossload 2 | 82.936A | 1.000A | 1.003A | 1.001A | 1012.78W | 91.23% | 1895 RPM | 53.7 dBA | 45.22°C | 0.995 |
| 12.054V | 4.901V | 3.273V | 4.881V | 1110.20W | 58.90°C | 229.7V | ||||
The unit easily delivered more than its full power at nearly 46°C ambient. Efficiency only dropped under 90% on the 20% load test and increased significantly, surpassing 92% on three tests, with higher loads. The sweet range is, as usual, between 40% and 60% of the maximum-rated-capacity load.
Voltage regulation on all rails was good, although not exceptional since none of the rails managed to register a deviation within 1%. Nevertheless, all rails except the 5VSB one stayed well under 3%, which is noteworthy for a 1 kW PSU.
Regarding output noise: The corresponding column of the above table shows that fan speed stayed low during the first two tests, which resulted in noise levels below 40 dBA. Afterwards, the fan entered the high-noise region, creating terribly annoying noise levels at full load. The high-speed fan of this unit will, although the fan-speed profile is relaxed, spin at high RPM with low voltage input, which greatly affects noise. FSP should, in our humble opinion, use bigger heatsinks inside the unit to allow for a quiet fan with lower RPM to be used. The current fan does at least do a pretty good job of removing heat out of the unit, as is clearly shown by the large delta difference we measured between input and output temperatures.
Apr 25th, 2024 04:43 EDT
change timezone
Latest GPU Drivers
New Forum Posts
- Core i5-6300U (14)
- (Anti) SFF fun house (351)
- Alphacool CORE 1 CPU block - bulging with danger of splitting? (4)
- The TPU UK Clubhouse (24786)
- Github comments used to push malware via Microsoft repo urls (3)
- Bizarre Throttlestop issue (5)
- GTX 1070 Ti - TDP Issues - Always Power Throttling (5)
- What phone you use as your daily driver? And, a discussion of them. (1471)
- What's your latest tech purchase? (20337)
- The Official Linux/Unix Desktop Screenshots Megathread (694)
Popular Reviews
- Fractal Design Terra Review
- Thermalright Phantom Spirit 120 EVO Review
- Corsair 2000D Airflow Review
- Minisforum EliteMini UM780 XTX (AMD Ryzen 7 7840HS) Review
- ASUS GeForce RTX 4090 STRIX OC Review
- NVIDIA GeForce RTX 4090 Founders Edition Review - Impressive Performance
- ASUS GeForce RTX 4090 Matrix Platinum Review - The RTX 4090 Ti
- MSI GeForce RTX 4090 Suprim X Review
- MSI GeForce RTX 4090 Gaming X Trio Review
- Gigabyte GeForce RTX 4090 Gaming OC Review
Controversial News Posts
- Sony PlayStation 5 Pro Specifications Confirmed, Console Arrives Before Holidays (116)
- NVIDIA Points Intel Raptor Lake CPU Users to Get Help from Intel Amid System Instability Issues (106)
- AMD "Strix Halo" Zen 5 Mobile Processor Pictured: Chiplet-based, Uses 256-bit LPDDR5X (101)
- US Government Wants Nuclear Plants to Offload AI Data Center Expansion (98)
- Windows 10 Security Updates to Cost $61 After 2025, $427 by 2028 (84)
- Developers of Outpost Infinity Siege Recommend Underclocking i9-13900K and i9-14900K for Stability on Machines with RTX 4090 (84)
- Windows 11 Now Officially Adware as Microsoft Embeds Ads in the Start Menu (79)
- TechPowerUp Hiring: Reviewers Wanted for Motherboards, Laptops, Gaming Handhelds and Prebuilt Desktops (78)