Raevenlord
News Editor
- Joined
- Aug 12, 2016
- Messages
- 3,755 (1.15/day)
- Location
- Portugal
| System Name | The Ryzening |
|---|---|
| Processor | AMD Ryzen 9 5900X |
| Motherboard | MSI X570 MAG TOMAHAWK |
| Cooling | Lian Li Galahad 360mm AIO |
| Memory | 32 GB G.Skill Trident Z F4-3733 (4x 8 GB) |
| Video Card(s) | Gigabyte RTX 3070 Ti |
| Storage | Boot: Transcend MTE220S 2TB, Kintson A2000 1TB, Seagate Firewolf Pro 14 TB |
| Display(s) | Acer Nitro VG270UP (1440p 144 Hz IPS) |
| Case | Lian Li O11DX Dynamic White |
| Audio Device(s) | iFi Audio Zen DAC |
| Power Supply | Seasonic Focus+ 750 W |
| Mouse | Cooler Master Masterkeys Lite L |
| Keyboard | Cooler Master Masterkeys Lite L |
| Software | Windows 10 x64 |
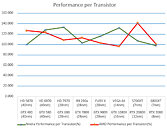
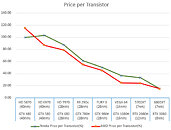
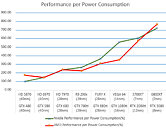
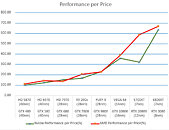
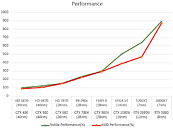
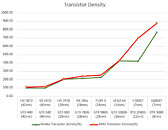
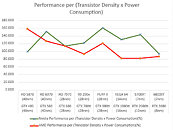
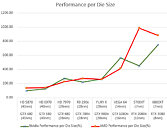
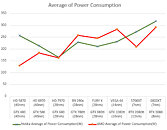
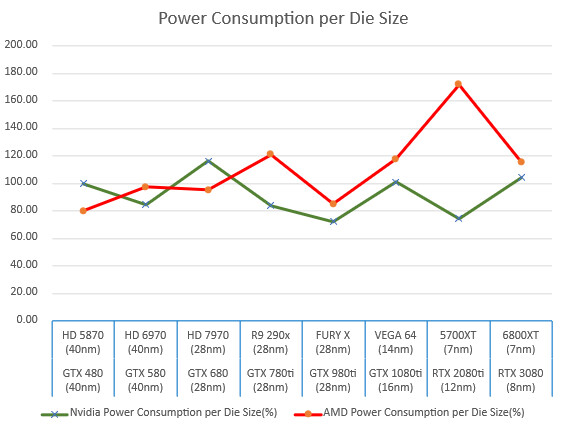
Using our graphics card database, which is managed by our very own T4CFantasy, reddit user u/Vito_ponfe_Andariel created some basic charts mapping out the data points from our expansive, industry-leading GPU database. In these charts, the user compares technological innovation for both AMD and NVIDIA's GPUs in the last ten years, plotting out the performance evolution of the "best available GPU" per year in terms of performance, performance per dollar (using the database's launch price metric), energy consumption, performance per transistor, and a whole lot of other data correlation sets.
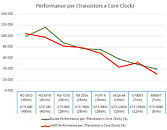
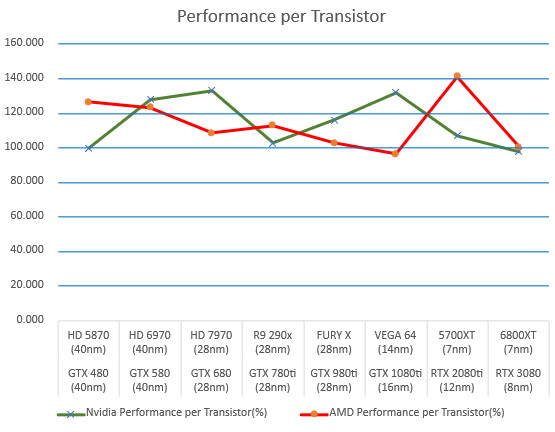
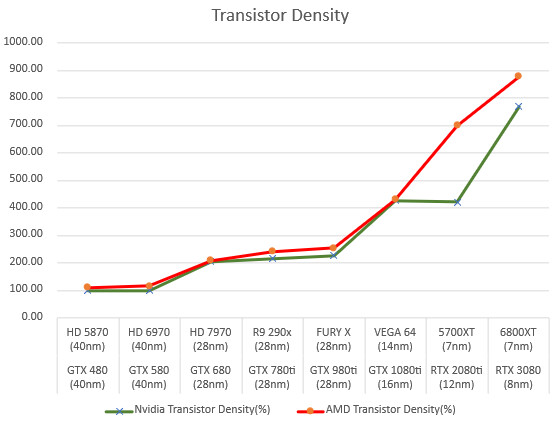
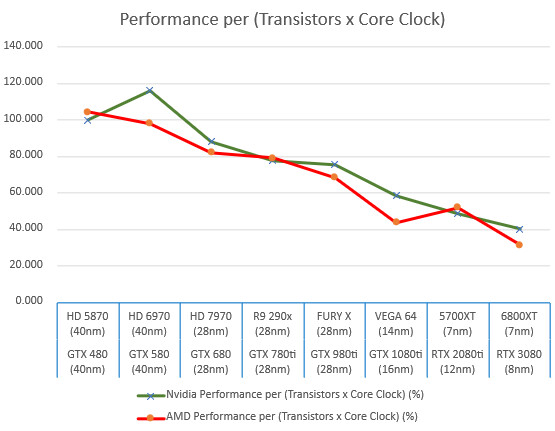
It's interesting to note technological changes in these charts and how they relate to the overall values. For example, if you look at the performance per transistor graph, you'll notice that performance per transistor has actually declined roughly 20% with the transition from NVIDIA's Pascal (GTX 1080 Ti) to the Turing (RTX 20-series) architecture. At the same time, AMD's performance per transistor exploded around 40% from Vega 64 to the RX 5700 XT graphics card. This happens, in part, due to the introduction of raytracing-specific hardware on NVIDIA's Turing, which takes up transistor counts without aiding in general shading performance - while AMD benefited from a new architecture in RDNA as well as the process transition from 14 nm to 7 nm. We see this declining performance behavior again with AMD's introduction of the RX 6800 XT from AMD, which loses some 40% in this performance per transistor metric - likely due to the introduction of RT cores and other architectural changes. There are of course other variables to the equation, but it is nonetheless interesting to note. Look after the break for the rest of the charts.

View at TechPowerUp Main Site
It's interesting to note technological changes in these charts and how they relate to the overall values. For example, if you look at the performance per transistor graph, you'll notice that performance per transistor has actually declined roughly 20% with the transition from NVIDIA's Pascal (GTX 1080 Ti) to the Turing (RTX 20-series) architecture. At the same time, AMD's performance per transistor exploded around 40% from Vega 64 to the RX 5700 XT graphics card. This happens, in part, due to the introduction of raytracing-specific hardware on NVIDIA's Turing, which takes up transistor counts without aiding in general shading performance - while AMD benefited from a new architecture in RDNA as well as the process transition from 14 nm to 7 nm. We see this declining performance behavior again with AMD's introduction of the RX 6800 XT from AMD, which loses some 40% in this performance per transistor metric - likely due to the introduction of RT cores and other architectural changes. There are of course other variables to the equation, but it is nonetheless interesting to note. Look after the break for the rest of the charts.


View at TechPowerUp Main Site


")