 29
29
Corsair AX760i 760 W Review
Efficiency & Temperatures »Test Setup
All measurements were performed using two Chroma 6314A mainframes equipped with the following electronic loads: six 63123A [350 W each], one 63102A [100 W x2], and one 63101A [200 W]. The aforementioned equipment is capable of delivering 2500 W of load, and all loads are controlled by a custom-made software. We also used a Picoscope 3424 oscilloscope, a Picotech TC-08 thermocouple data logger, a Fluke 175 multimeter, and a Yokogawa WT210 power meter. We also included a wooden box, which, along with some heating elements, was used as a hot box. Finally, we had at our disposal four more oscilloscopes (Rigol 1052E and VS5042, Stingray DS1M12, a second Picoscope 3424), and a CEM DT-8852 sound-level meter. In this article, you will find more details about our equipment and the review methodology we follow. Finally, we conduct all of our tests at 40 - 45°C ambient in order to simulate with higher accuracy the environment seen inside a typical system, with 40 - 45°C being derived from a standard ambient assumption of 23°C and 17 - 22°C being added for the typical temperature rise within a system.Primary Rails Voltage Regulation
The following charts show the voltage values of the main rails, recorded over a range from 60W to the maximum specified load, and the deviation (in percent) for the same load range.


5VSB Regulation
The following chart shows how the 5VSB rail deals with the load we throw at it.

Hold-up Time
The hold-up time is a very important characteristic of a PSU and represents the amount of time, usually measured in milliseconds, that a PSU can maintain output regulations as defined by the ATX spec without input power. In other words, it is the amount of time that the system can continue to run without shutting down or rebooting during a power interruption. The ATX spec sets the minimum hold-up time to 16 ms at maximum continuous output load. In the following screenshot, the blue line is the mains signal and the yellow line is the "Power Good" signal. The latter is de-asserted to a low state when any of the +12V, 5V, or 3.3V output voltages fall below the undervoltage threshold, or after the mains power has been removed for a sufficiently long time to guarantee that the PSU cannot operate anymore.

For the first time we have a unit that features a higher hold-up time than the ATX threshold. This means that appropriate capacitors with enough capacity to provide energy to the secondary side once a power interruption occurs were used in the APFC section. Well done Corsair!
Inrush Current
Inrush current or switch-on surge refers to the maximum, instantaneous input-current drawn by an electrical device when first turned on. Because of the charging current of the APFC capacitor(s), PSUs produce large inrush-current right as they are turned on. Large inrush current can cause the tripping of circuit breakers and fuses and may also damage switches or relays; as a result, the lower the inrush current of a PSU right as they are turned on, the better.
The inrush current is relatively low for a unit of this capacity. This is, of course, very good news.
Voltage Regulation and Efficiency Measurements
The first set of tests revealed the stability of the voltage rails and the efficiency of the AX760i. The applied load was equal to (approximately) 20%, 40%, 50%, 60%, 80%, 100% and 110% of the maximum load that the PSU can handle. In addition, we conducted two more tests. In the first test, we stressed the two minor rails (5V and 3.3V) with a high load while the load at +12V was only 2 A, and, in the second test, we dialed the maximum load that the +12V rail could handle while the load on the minor rails was minimal.| Voltage Regulation & Efficiency Testing Data Corsair AX760i | |||||||||
|---|---|---|---|---|---|---|---|---|---|
| Test | 12 V | 5 V | 3.3 V | 5VSB | Power (DC/AC) | Efficiency | Fan Speed | Temp (In/Out) | PF/AC Volts |
| 20% Load | 10.805A | 1.992A | 1.997A | 1.001A | 151.76W (172.3W) | 90.77% (99%) | 0 RPM | 48.07°C (50.5°C) | 0.978 |
| 12.046V | 5.023V | 3.301V | 4.996V | 167.20W (174W) | 44.92°C | 230.1V | |||
| 40% Load | 21.968A | 3.988A | 4.004A | 1.200A | 303.69W (327W) | 93.64% (98.5°C) | 476 RPM | 43.06°C (44.8°C) | 0.994 |
| 12.042V | 5.011V | 3.294V | 4.984V | 324.33W (332W) | 50.05°C | 230.0V | |||
| 50% Load | 27.428A | 4.975A | 5.012A | 1.605A | 379.57W (407.9W) | 93.76% (99%) | 624 RPM | 43.46°C (43.8°C) | 0.996 |
| 12.037V | 5.013V | 3.290V | 4.978V | 404.85W (412W) | 51.02°C | 229.9V | |||
| 60% Load | 32.889A | 5.984A | 6.004A | 2.010A | 455.56W (459W) | 93.69% (93.1%) | 760 RPM | 43.57°C (43.5°C) | 0.997 |
| 12.035V | 5.008V | 3.296V | 4.965V | 486.23W (493W) | 51.78°C | 229.9V | |||
| 80% Load | 43.989A | 7.989A | 8.019A | 2.419A | 607.47W (616W) | 93.23% (93.9%) | 1044 RPM | 44.22°C (44.8°C) | 0.999 |
| 12.029V | 5.002V | 3.291V | 4.951V | 651.60W (656W) | 52.81°C | 229.9V | |||
| 100% Load | 55.703A | 9.025A | 9.048A | 3.045A | 759.33W (779W) | 92.48% (94.7%) | 1532 RPM | 46.04°C (45.3°C) | 0.999 |
| 12.022V | 4.985V | 3.282V | 4.922V | 821.05W (823W) | 54.88°C | 229.8V | |||
| 110% Load | 62.036A | 9.028A | 9.043A | 3.045A | 835.23W (864W) | 92.09% (95%) | 1756 RPM | 47.35°C (46.8°C) | 0.999 |
| 12.018V | 4.984V | 3.284V | 4.922V | 906.95W (909W) | 57.02°C | 229.7V | |||
| Crossload 1 | 1.965A | 15.003A | 15.005A | 0.502A | 150.91W (180.2W) | 86.83% (99%) | 1064 RPM | 45.98°C (47.5°C) | 0.980 |
| 12.043V | 5.002V | 3.311V | 5.015V | 173.81W (182W) | 52.22°C | 230.2V | |||
| Crossload 2 | 63.287A | 1.000A | 1.003A | 1.002A | 774.07W (792W) | 92.90% (94.7%) | 1560 RPM | 46.21°C (45.8°C) | 0.999 |
| 12.021V | 5.002V | 3.292V | 4.981V | 833.20W (836W) | 54.37°C | 229.8V | |||
The unit had, first of all, no problem at all delivering even more than its full power at ambient temperatures that exceeded 45°C. This simply means that all components can easily handle the max power of the PSU while taking much abuse at high operating temperatures.
Efficiency is sky high and is currently the highest we have ever measured with our new and highly accurate set-up. Efficiency is, with a typical load, almost 94%; an impressive reading. This advantage is clearly due to the digital-control component as opposed to other conventional methods. Voltage regulation is also outstanding on all rails, and fan RPM is, up to 60% load, kept low as well, which results in equally low output noise. Only after highly stressing the unit did the fan operate at high speed, which resulted in audible noise output. Finally, the PSU's PF readings are out of this world. We have, with the exception of the AX1200i, never seen a PSU register such a high PF.
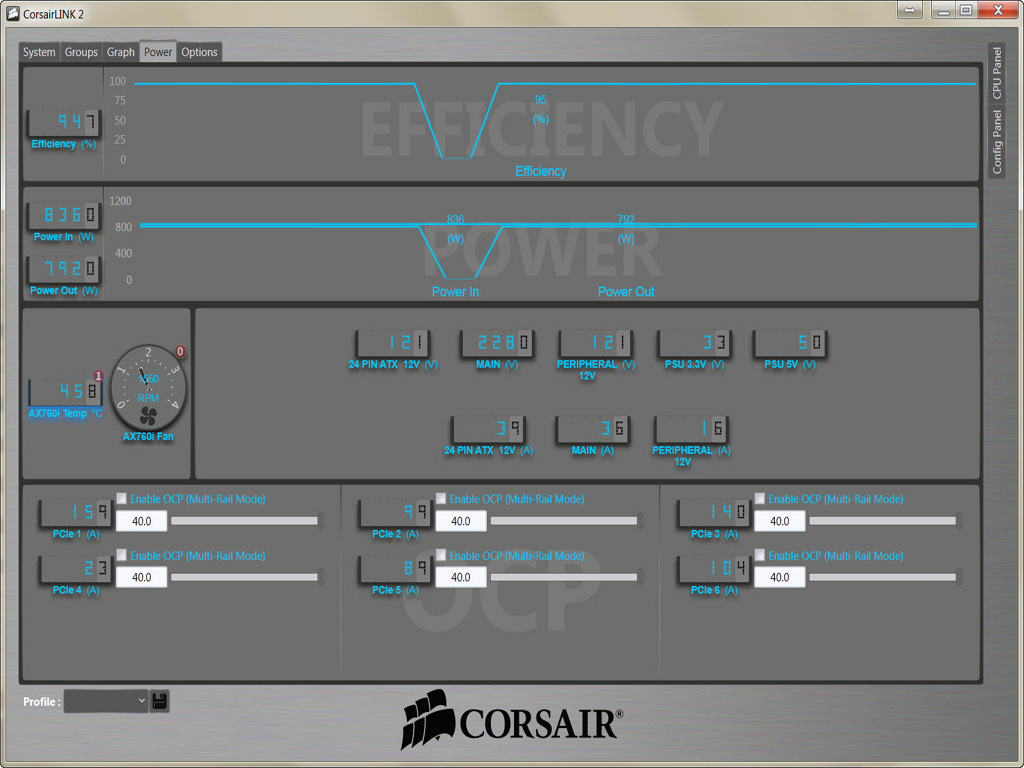
As for the Corsair Link software, its efficiency readings are, most of the times, way off, although the measured DC power is, from 40% load and upwards, close enough to the actual and real DC power reading. Voltage readings are steady throughout all load ranges since the PSU has amazing voltage regulation. AC voltage readings are, of course, only off by a little bit (by 1.5 - 2 V). Unfortunately, no similar implementations we tried in the past (AX1200i, EVGA SuperNOVA NEX1500, and Thortech PSUs) managed to provide accurate enough readings, which meant that our expectations weren't high.
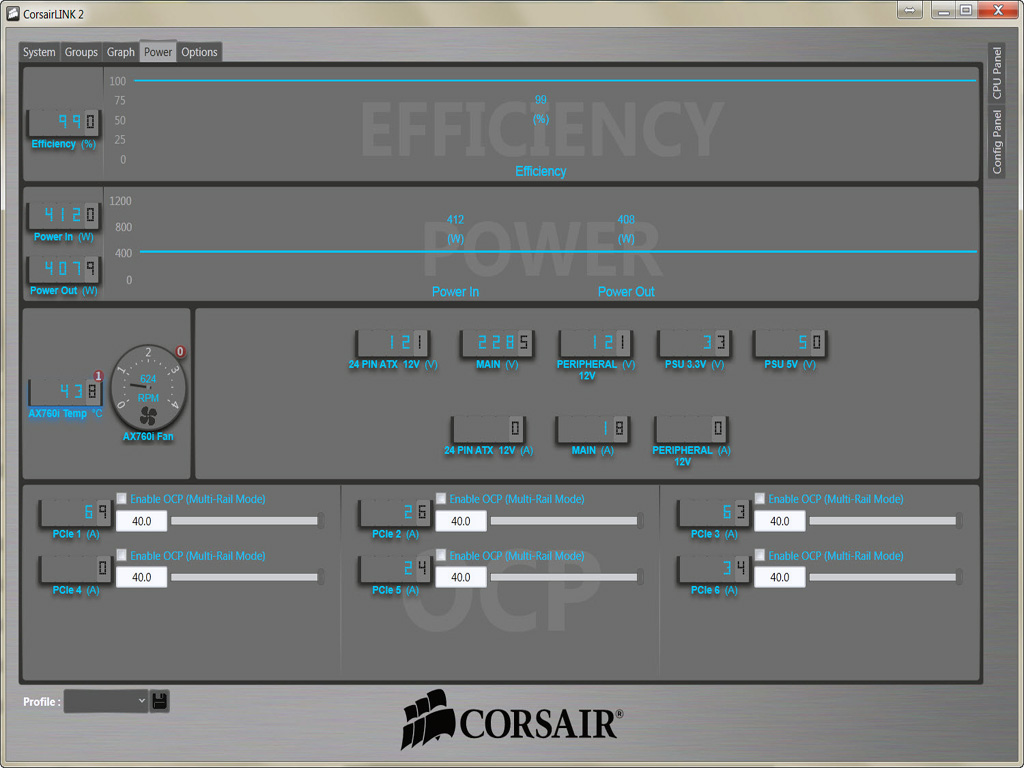
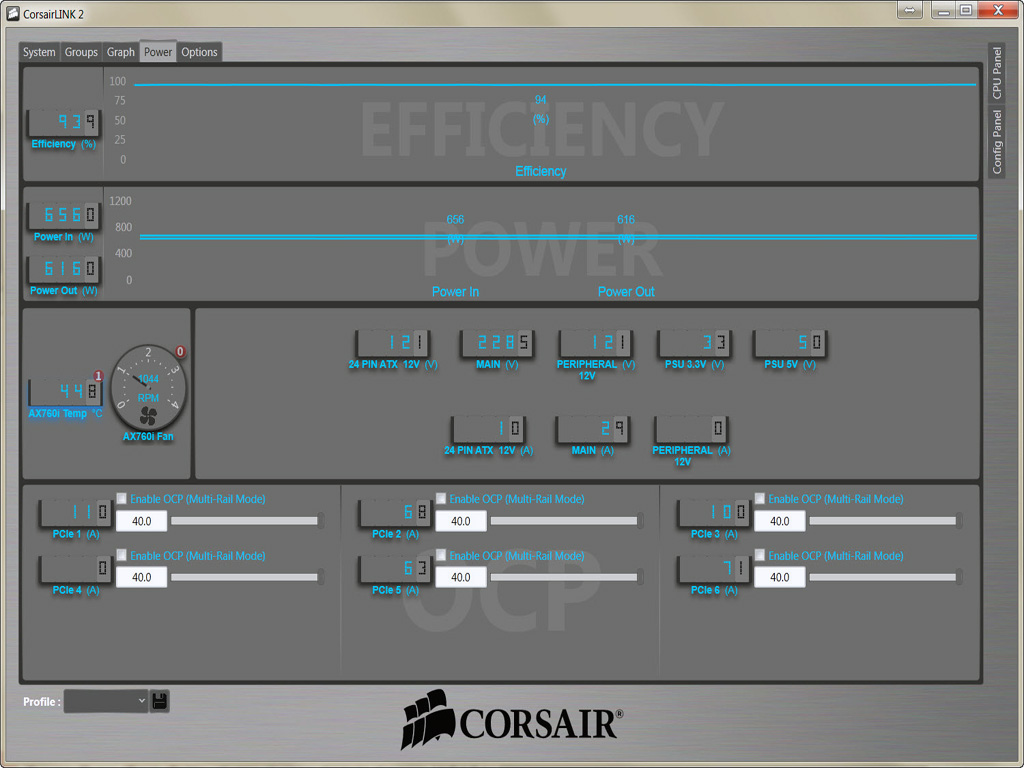
Corsair Link Screenshots
Several screenshots of the Corsair Link software, which we took during out test sessions, follow. The order of the screenshots is the same as the order of the tests shown in the table above (20% load test to Cross-load 2).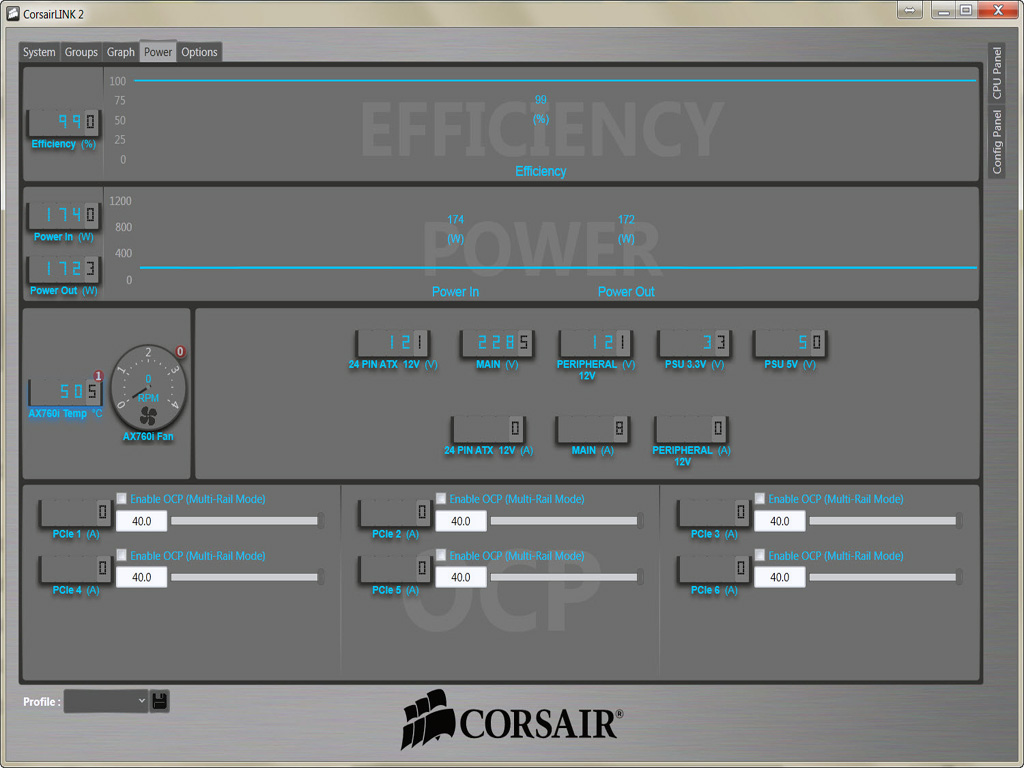


Apr 23rd, 2024 15:00 EDT
change timezone
Latest GPU Drivers
New Forum Posts
- Meta Horizon OS (3)
- Which new games will you be buying? (297)
- Is there a technical reason that Windows 11 doesn't have built into it battery charge limitation? (36)
- need help with motherboard/ ram compability certainty (1)
- What's your latest tech purchase? (20300)
- My computer setup - Request for opinions (9)
- No POST, and no display (4)
- windows 11 (2)
- Cinebench crashed my PC. My Wi-Fi stopped working, and I keep getting a "Please wait" screen when I boot up my PC. (25)
- Shadow Of The Tomb Raider - CPU Performance and general game benchmark discussions (524)
Popular Reviews
- Horizon Forbidden West Performance Benchmark Review - 30 GPUs Tested
- Fractal Design Terra Review
- Corsair 2000D Airflow Review
- Thermalright Phantom Spirit 120 EVO Review
- Minisforum EliteMini UM780 XTX (AMD Ryzen 7 7840HS) Review
- ASUS GeForce RTX 4090 STRIX OC Review
- NVIDIA GeForce RTX 4090 Founders Edition Review - Impressive Performance
- ASUS GeForce RTX 4090 Matrix Platinum Review - The RTX 4090 Ti
- Creative Pebble X Plus Review
- MSI GeForce RTX 4090 Gaming X Trio Review
Controversial News Posts
- Sony PlayStation 5 Pro Specifications Confirmed, Console Arrives Before Holidays (116)
- NVIDIA Points Intel Raptor Lake CPU Users to Get Help from Intel Amid System Instability Issues (105)
- AMD "Strix Halo" Zen 5 Mobile Processor Pictured: Chiplet-based, Uses 256-bit LPDDR5X (101)
- US Government Wants Nuclear Plants to Offload AI Data Center Expansion (98)
- Windows 10 Security Updates to Cost $61 After 2025, $427 by 2028 (84)
- Developers of Outpost Infinity Siege Recommend Underclocking i9-13900K and i9-14900K for Stability on Machines with RTX 4090 (84)
- TechPowerUp Hiring: Reviewers Wanted for Motherboards, Laptops, Gaming Handhelds and Prebuilt Desktops (74)
- Intel Realizes the Only Way to Save x86 is to Democratize it, Reopens x86 IP Licensing (70)