 3
3
EVGA SuperNOVA GS 650 W Review
Efficiency, Temperatures & Noise »Test Setup

All measurements were performed using two Chroma 6314A mainframes equipped with the following electronic loads: six 63123A [350 W each], one 63102A [100 W x2], and one 63101A [200 W]. The aforementioned equipment is able to deliver 2500 W of load, and all loads are controlled by a custom-made software. The AC source is a Chroma 6530 capable of delivering up to 3 kW of power. We also used a Rigol DS2072A oscilloscope kindly sponsored by Batronix, a Picoscope 3424 oscilloscope, a Picotech TC-08 thermocouple data logger, two Fluke multimeters (models 289 and 175), a Keithley 2015 THD 6.5 digit bench DMM, and a lab grade N4L PPA1530 3-phase power analyzer along with a Yokogawa WT210 power meter. We also included a wooden box, which, along with some heating elements, was used as a hot box. Finally, we had at our disposal three more oscilloscopes (Rigol VS5042, Stingray DS1M12, and a second Picoscope 3424), and a Class 1 Bruel & Kjaer 2250-L G4 sound analyzer we equipped with a type 4189 microphone that features a 16.6-140 dBA-weighted dynamic range. You will find more details about our equipment and the review methodology we follow in this article. We also conduct all of our tests at 40°C-45°C ambient to simulate the environment seen inside a typical system more accurately, with 40°C-45°C being derived from a standard ambient assumption of 23°C and 17°C-22°C being added for the typical temperature rise within a system.
To control the Chroma 6530 source we use a GPIB-USB controller, which avoids its very picky Serial port. This controller was kindly provided by Prologix.
Rigol DS2072A kindly provided by: |
 |
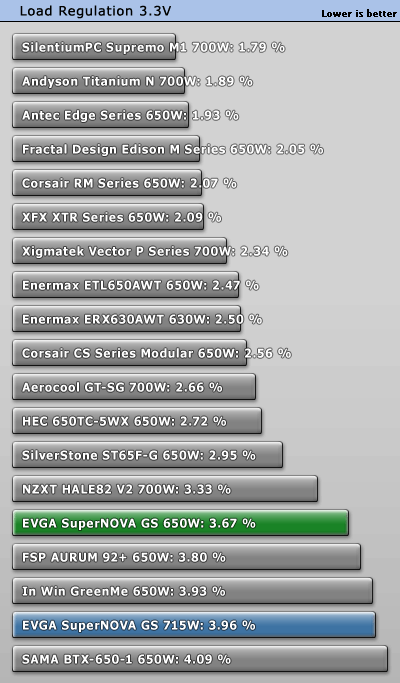
Primary Rails Load Regulation
The following charts show the voltage values of the main rails, recorded over a range from 60 W to the maximum specified load, and the deviation (in percent) for the same load range.


5VSB Regulation
The following chart shows how the 5VSB rail deals with the load we throw at it.

Hold-up Time
Hold-up time is a very important PSU characteristic and represents the amount of time, usually measured in milliseconds, a PSU can maintain output regulations as defined by the ATX spec without input power. In other words, it is the amount of time the system can continue to run without shutting down or rebooting during a power interruption. The ATX specification sets the minimum hold-up time to 16 ms with the maximum continuous output load. In the following screenshot, the blue line is the mains signal and the yellow line is the "Power Good" signal. The latter is de-asserted to a low state when any of the +12V, 5V, or 3.3V output voltages fall below the undervoltage threshold, or after the mains power has been removed for a sufficiently long time to guarantee that the PSU cannot operate anymore.

The hold-up time we measured was above 16 ms, so the PSU successfully completed this test.
Inrush Current
Inrush current or switch-on surge refers to the maximum instantaneous input-current drawn by an electrical device when it is first turned on. Because of the charging current of the APFC capacitor(s), PSUs produce large inrush-current right as they are turned on. Large inrush current can cause the tripping of circuit breakers and fuses and may also damage switches, relays, and bridge rectifiers; as a result, the lower a PSU's inrush current right as it is turned on, the better.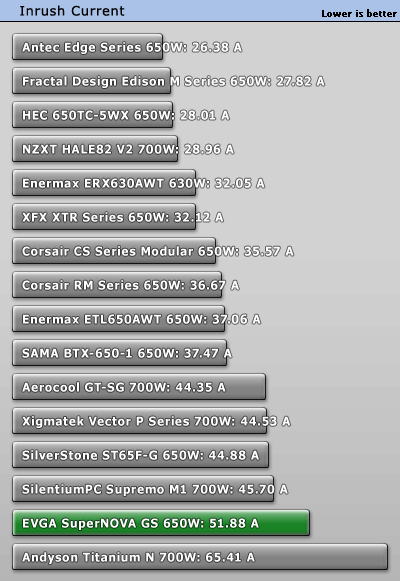
Inrush current was rather high for a 650 W PSU. However, we should note that inrush current measurements are much more accurate with our new power analyzer, rather than the Yokogawa WT210 we used before, so some PSUs we have tested might now register more inrush current than with the old power analyzer. We will update our database in time and will also get used to the readings the PPA1530 delivers. This analyzer can measure up to 300 A because of the high crest factor it supports.
Load Regulation and Efficiency Measurements
The first set of tests revealed the stability of the voltage rails and the GS 650's efficiency. The applied load was equal to (approximately) 10%-110% of the maximum load the PSU can handle, in 10% steps.We conducted two additional tests. In the first test, we stressed the two minor rails (5V and 3.3V) with a high load while the load at +12V was only 0.10 A. This test reveals whether the PSU is Haswell ready or not. In the second test, we dialed the maximum load the +12V rail can handle while the load on the minor rails is minimal.
| Load Regulation & Efficiency Testing Data - EVGA SuperNOVA 650 GS | ||||||||||
|---|---|---|---|---|---|---|---|---|---|---|
| Test | 12 V | 5 V | 3.3 V | 5VSB | Power (DC/AC) | Efficiency | Fan Speed | Fan Noise | Temp (In/Out) | PF/AC Volts |
| 10% Load | 3.564A | 1.974A | 1.954A | 0.980A | 64.73W | 86.70% | 600 RPM | 27.3 dBA | 39.00°C | 0.875 |
| 12.117V | 5.053V | 3.375V | 5.080V | 74.66W | 40.91°C | 230.2V | ||||
| 20% Load | 8.178A | 2.969A | 2.943A | 1.180A | 129.72W | 90.81% | 600 RPM | 27.3 dBA | 39.86°C | 0.953 |
| 12.093V | 5.038V | 3.361V | 5.065V | 142.85W | 42.27°C | 230.2V | ||||
| 30% Load | 13.158A | 3.485A | 3.459A | 1.385A | 194.90W | 91.93% | 620 RPM | 27.4 dBA | 40.17°C | 0.973 |
| 12.069V | 5.026V | 3.349V | 5.050V | 212.00W | 42.98°C | 230.2V | ||||
| 40% Load | 18.143A | 3.984A | 3.952A | 1.584A | 259.66W | 92.17% | 850 RPM | 35.8 dBA | 40.33°C | 0.982 |
| 12.044V | 5.015V | 3.338V | 5.036V | 281.72W | 43.42°C | 230.2V | ||||
| 50% Load | 22.807A | 4.990A | 4.962A | 1.790A | 324.60W | 91.99% | 1170 RPM | 38.8 dBA | 41.25°C | 0.985 |
| 12.021V | 5.002V | 3.323V | 5.020V | 352.86W | 44.67°C | 230.2V | ||||
| 60% Load | 27.496A | 6.013A | 5.979A | 1.994A | 389.59W | 91.63% | 1380 RPM | 42.0 dBA | 41.80°C | 0.987 |
| 11.996V | 4.986V | 3.310V | 5.004V | 425.17W | 45.90°C | 230.2V | ||||
| 70% Load | 32.197A | 7.034A | 7.011A | 2.203A | 454.46W | 91.12% | 1660 RPM | 45.7 dBA | 42.75°C | 0.988 |
| 11.970V | 4.972V | 3.295V | 4.988V | 498.73W | 47.31°C | 230.2V | ||||
| 80% Load | 36.918A | 8.067A | 8.046A | 2.411A | 519.37W | 90.38% | 1670 RPM | 45.8 dBA | 44.04°C | 0.988 |
| 11.945V | 4.959V | 3.280V | 4.971V | 574.66W | 49.18°C | 230.2V | ||||
| 90% Load | 42.097A | 8.591A | 8.595A | 2.415A | 584.33W | 89.56% | 1680 RPM | 45.9 dBA | 44.25°C | 0.989 |
| 11.919V | 4.947V | 3.268V | 4.962V | 652.46W | 50.18°C | 230.2V | ||||
| 100% Load | 47.252A | 9.118A | 9.121A | 2.524A | 649.15W | 88.78% | 1700 RPM | 46.1 dBA | 44.70°C | 0.989 |
| 11.893V | 4.935V | 3.256V | 4.948V | 731.17W | 51.01°C | 230.2V | ||||
| 110% Load | 52.823A | 9.135A | 9.150A | 2.529A | 713.93W | 87.90% | 1700 RPM | 46.1 dBA | 45.23°C | 0.989 |
| 11.865V | 4.925V | 3.246V | 4.939V | 812.20W | 52.09°C | 230.2V | ||||
| Crossload 1 | 0.099A | 12.008A | 12.005A | 0.004A | 101.36W | 84.01% | 1210 RPM | 39.1 dBA | 43.83°C | 0.938 |
| 12.101V | 5.012V | 3.328V | 5.081V | 120.66W | 47.63°C | 230.2V | ||||
| Crossload 2 | 53.976A | 1.002A | 1.003A | 1.002A | 655.24W | 89.58% | 1700 RPM | 46.1 dBA | 44.55°C | 0.989 |
| 11.893V | 4.970V | 3.295V | 5.006V | 731.45W | 47.13°C | 230.2V | ||||
Load regulation was pretty average on all rails. We expected better results on especially the +12V rail, and the 3.3V rail deviated by nearly 3.7 %, which was rather disappointing. With that said, the PSU delivered more than its full power at very high ambient temperatures with ease, and its efficiency levels were quite high. The fan was impossible to hear during the first three tests and very quiet with typical loads, and while the fan spun at almost full speed with higher loads, it wasn't very loud at all to our ears. The fan's teflon-coated bearing is apparently quieter than a double ball-bearing because there is less friction between the bearing and the fan's shaft.
Apr 25th, 2024 18:16 EDT
change timezone
Latest GPU Drivers
New Forum Posts
- Best SSD for system drive (78)
- Which new games will you be buying? (314)
- TPU's Nostalgic Hardware Club (18464)
- Post your Cinebench 2024 score (450)
- Ubuntu 24.04 LTS released (2)
- Dell Workstation Owners Club (3054)
- im new to throttelstop and i think i messed it up by copying others any hints would be very much aprreciated (2)
- Ryzen Owners Zen Garden (7243)
- What software are you using to monitor CPU temps during gaming session? (15)
- ROG Strix LC III 360 ARG AIO What should the pump speed be? (4)
Popular Reviews
- Fractal Design Terra Review
- Thermalright Phantom Spirit 120 EVO Review
- Corsair 2000D Airflow Review
- Minisforum EliteMini UM780 XTX (AMD Ryzen 7 7840HS) Review
- ASUS GeForce RTX 4090 STRIX OC Review
- NVIDIA GeForce RTX 4090 Founders Edition Review - Impressive Performance
- ASUS GeForce RTX 4090 Matrix Platinum Review - The RTX 4090 Ti
- MSI GeForce RTX 4090 Suprim X Review
- MSI GeForce RTX 4090 Gaming X Trio Review
- Gigabyte GeForce RTX 4090 Gaming OC Review
Controversial News Posts
- Sony PlayStation 5 Pro Specifications Confirmed, Console Arrives Before Holidays (117)
- Windows 11 Now Officially Adware as Microsoft Embeds Ads in the Start Menu (106)
- NVIDIA Points Intel Raptor Lake CPU Users to Get Help from Intel Amid System Instability Issues (106)
- AMD "Strix Halo" Zen 5 Mobile Processor Pictured: Chiplet-based, Uses 256-bit LPDDR5X (101)
- US Government Wants Nuclear Plants to Offload AI Data Center Expansion (98)
- AMD's RDNA 4 GPUs Could Stick with 18 Gbps GDDR6 Memory (87)
- Developers of Outpost Infinity Siege Recommend Underclocking i9-13900K and i9-14900K for Stability on Machines with RTX 4090 (85)
- Windows 10 Security Updates to Cost $61 After 2025, $427 by 2028 (84)