 11
11
PC Power & Cooling Silencer MK III 750 W Review
Efficiency, Temperatures & Noise »Test Setup
All measurements were performed using two Chroma 6314A mainframes equipped with the following electronic loads: six 63123A [350 W each], one 63102A [100 W x2], and one 63101A [200 W]. The aforementioned equipment is able to deliver 2500 W of load, and all loads are controlled by a custom-made software. We also used a Picoscope 3424 oscilloscope, a Picotech TC-08 thermocouple data logger, a Fluke 175 multimeter, and a Yokogawa WT210 power meter. We also included a wooden box, which, along with some heating elements, was used as a hot box. Finally, we had at our disposal four more oscilloscopes (Rigol 1052E and VS5042, Stingray DS1M12, a second Picoscope 3424), and a CEM DT-8852 sound level meter. You will find more details about our equipment and the review methodology we follow in this article.We conduct all of our tests at 40 - 45°C ambient in order to simulate the environment seen inside a typical system with higher accuracy, with 40 - 45°C being derived from a standard ambient assumption of 23°C and 17 - 22°C being added for the typical temperature rise within a system.
Primary Rails Voltage Regulation
The following charts show the voltage values of the main rails, recorded over a range from 60W to the maximum specified load, and the deviation (in percent) for the same load range.


5VSB Regulation
The following chart shows how the 5VSB rail deals with the load we throw at it.

Hold-up Time
The hold-up time is a very important characteristic of a PSU and represents the amount of time, usually measured in milliseconds, that a PSU can maintain output regulations as defined by the ATX specification without input power. In other words, it is the amount of time that the system can continue to run without shutting down or rebooting during a power interruption. The ATX spec sets the minimum hold-up time to 16 ms at maximum continuous output load. In the following screenshot, the blue line is the mains signal and the yellow line is the "Power Good" signal. The latter is de-asserted to a low state when any of the +12V, 5V, or 3.3V output voltages fall below the undervoltage threshold, or after the mains power has been removed for a sufficiently long time to guarantee that the PSU cannot operate anymore.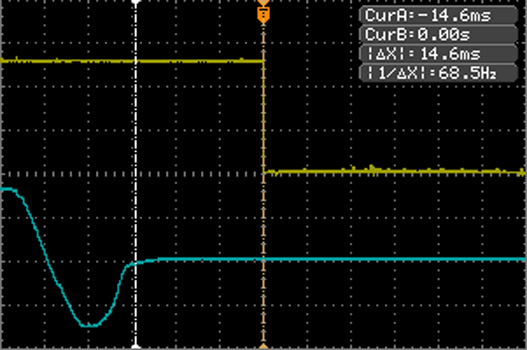

The hold-up time for 1.4 ms doesn't meet the ATX requirement, so the PSU will lose some performance points here. The hold-up cap apparently needs some extra capacity to cope with the unit's demands during this test.
Inrush Current
Inrush current or switch-on surge refers to the maximum, instantaneous input-current drawn by an electrical device when first turned on. Because of the charging current of the APFC capacitor(s), PSUs produce large inrush-current right as they are turned on. Large inrush current can cause the tripping of circuit breakers and fuses and may also damage switches or relays; as a result, the lower the inrush current of a PSU right as they are turned on, the better.
The inrush current reading that we measured is low enough, and this is a clear indication of a proper design.
Voltage Regulation and Efficiency Measurements
The first set of tests revealed the stability of the voltage rails and the efficiency of the MK3S750. The applied load was equal to (approximately) 20%, 40%, 50%, 60%, 80%, 100% and 110% of the maximum load that the PSU can handle. In addition, we conducted two more tests. In the first test, we stressed the two minor rails (5V and 3.3V) with a high load while the load at +12V was only 2 A, and, in the second test, we dialed the maximum load that the +12V rail could handle while the load on the minor rails was minimal.| Voltage Regulation & Efficiency Testing Data PC Power & Cooling MK3S750 | ||||||||||
|---|---|---|---|---|---|---|---|---|---|---|
| Test | 12 V | 5 V | 3.3 V | 5VSB | Power (DC/AC) | Efficiency | Fan Speed | Fan Noise | Temp (In/Out) | PF/AC Volts |
| 20% Load | 10.551A | 1.930A | 1.955A | 0.970A | 149.70W | 90.50% | 0 RPM | 0 dBA | 49.06°C | 0.940 |
| 12.145V | 5.168V | 3.374V | 5.140V | 165.41W | 36.13°C | 230.0V | ||||
| 40% Load | 21.502A | 3.886A | 3.939A | 1.170A | 299.67W | 92.34% | 0 RPM | 0 dBA | 52.23°C | 0.976 |
| 12.116V | 5.139V | 3.348V | 5.122V | 324.53W | 37.00°C | 230.0V | ||||
| 50% Load | 26.877A | 4.875A | 4.946A | 1.566A | 374.64W | 92.01% | 1045 RPM | 44.1 dBA | 42.63°C | 0.981 |
| 12.099V | 5.122V | 3.334V | 5.105V | 407.16W | 50.36°C | 230.0V | ||||
| 60% Load | 32.256A | 5.868A | 5.968A | 1.960A | 449.49W | 91.84% | 1094 RPM | 44.4 dBA | 42.99°C | 0.985 |
| 12.084V | 5.103V | 3.316V | 5.091V | 489.44W | 51.27°C | 229.9V | ||||
| 80% Load | 43.233A | 7.885A | 8.027A | 2.365A | 599.44W | 91.32% | 1127 RPM | 44.6 dBA | 44.37°C | 0.986 |
| 12.053V | 5.069V | 3.288V | 5.069V | 656.40W | 53.49°C | 229.8V | ||||
| 100% Load | 54.859A | 8.920A | 9.102A | 2.970A | 749.24W | 90.40% | 1194 RPM | 45.2 dBA | 45.92°C | 0.987 |
| 12.024V | 5.040V | 3.261V | 5.043V | 828.85W | 55.75°C | 229.9V | ||||
| 110% Load | 61.167A | 8.938A | 9.141A | 2.975A | 824.04W | 89.90% | 1263 RPM | 45.6 dBA | 46.30°C | 0.988 |
| 12.006V | 5.033V | 3.249V | 5.036V | 916.65W | 57.14°C | 229.8V | ||||
| Crossload 1 | 1.969A | 14.010A | 14.005A | 0.501A | 143.10W | 85.09% | 1009 RPM | 43.2 dBA | 43.10°C | 0.941 |
| 12.132V | 5.051V | 3.276V | 5.127V | 168.18W | 50.37°C | 230.2V | ||||
| Crossload 2 | 61.933A | 1.000A | 1.002A | 1.001A | 758.35W | 91.18% | 1200 RPM | 45.2 dBA | 45.43°C | 0.987 |
| 12.026V | 5.116V | 3.323V | 5.091V | 831.70W | 54.77°C | 229.9V | ||||
Efficiency is very good and does, according to our experience, easily meet 80 Plus Gold requirements. The cooling fan didn't engage up to the 40% load test, and the ambient inside the hot box was very high. The fan's rotational speed remained low after it started spinning, even during the 100% and 110% load tests.
Voltage regulation at +12V is satisfactory, although we were hoping to see a reading below 1%. Readings on the minor rails are definitely not amongst the best we have ever encountered: the 3.3V rail even reached a deviation of 3%, which is not something we were expecting of this platform. That said, what counts more is the +12V rail, but some performance points will be lost on the minor rails.
Apr 23rd, 2024 09:13 EDT
change timezone
Latest GPU Drivers
New Forum Posts
- Windows 12 (141)
- Show us your collections thread!! (281)
- Possible near-future 2024 Arrow Lake build.... (46)
- Serious bug in PHP reported! (2)
- Odd RTX 3080 behaviour (1)
- Upgrade Build (105)
- The Official Linux/Unix Desktop Screenshots Megathread (693)
- Share your AIDA 64 cache and memory benchmark here (2913)
- My computer setup - Request for opinions (4)
- The best *budget* ATX PC case on the market? (23)
Popular Reviews
- Horizon Forbidden West Performance Benchmark Review - 30 GPUs Tested
- Fractal Design Terra Review
- Corsair 2000D Airflow Review
- Thermalright Phantom Spirit 120 EVO Review
- Minisforum EliteMini UM780 XTX (AMD Ryzen 7 7840HS) Review
- ASUS GeForce RTX 4090 STRIX OC Review
- NVIDIA GeForce RTX 4090 Founders Edition Review - Impressive Performance
- ASUS GeForce RTX 4090 Matrix Platinum Review - The RTX 4090 Ti
- Creative Pebble X Plus Review
- MSI GeForce RTX 4090 Gaming X Trio Review
Controversial News Posts
- Sony PlayStation 5 Pro Specifications Confirmed, Console Arrives Before Holidays (116)
- NVIDIA Points Intel Raptor Lake CPU Users to Get Help from Intel Amid System Instability Issues (105)
- AMD "Strix Halo" Zen 5 Mobile Processor Pictured: Chiplet-based, Uses 256-bit LPDDR5X (101)
- US Government Wants Nuclear Plants to Offload AI Data Center Expansion (98)
- Windows 10 Security Updates to Cost $61 After 2025, $427 by 2028 (84)
- Developers of Outpost Infinity Siege Recommend Underclocking i9-13900K and i9-14900K for Stability on Machines with RTX 4090 (82)
- TechPowerUp Hiring: Reviewers Wanted for Motherboards, Laptops, Gaming Handhelds and Prebuilt Desktops (74)
- Intel Realizes the Only Way to Save x86 is to Democratize it, Reopens x86 IP Licensing (70)