• Welcome to TechPowerUp Forums, Guest! Please check out our forum guidelines for info related to our community.

TPU Math Check

I thought I left this shit behind when I left University :D
 
You should really use the geometric mean to have consistent results.
Why use geometric mean? I thought thats used mostly for interest rate and similar growth processes?

Just because you see a percent sign in there, doesn't make it an interest rate
 
Why use geometric mean? I thought thats used mostly for interest rate and similar growth processes?

Just because you see a percent sign in there, doesn't make it an interest rate

Because the less weight to the card you use as a reference. Another example:

Card1: 50 FPS in first game, 75 in second game.
Card2: 75 FPS in first game, 50 in second game.

Say you want to use Card1 as a reference.

Card1: 100% in first game, 100% in second game.
Card2: 150% in first game, 67% in second game.

Mean Card1: 100%.
Mean Card2: 109%.

This happens because Card2 in second game gets 67% instead of 50%. :)

EDIT.
The geometric mean works well in these case.
(67 * 150)^1/2 = 100%.
 
wizzard I think you should evaluate the use of geometric mean for average calculations as it might give the more accurate relationship between the 2 [...]

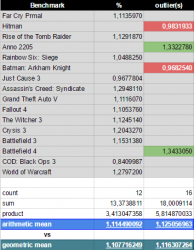
I made a quick google spreedsheat (link)

Picture:
TPU math.png
 
capture2312.jpg


not a lot of difference, but geometric mean does seem to make sense.

I think I'll use that starting with next rebench. Thanks!
Promise me you do not get angry? But for the next time you use another system yet. :toast:
Instead of making the comparison with a particular card, you can compare with the average of all.
And in this case you can use the normal average.

tpu-chart566.png
 
Guys , the people need something simple to use i.e. 20% would mean from 40FPS to 48FPS ! No change is needed
 
Guys , the people need something simple to use i.e. 20% would mean from 40FPS to 48FPS ! No change is needed
I always thought it would be awesome and helpful if the percentages would adjust relatively to the card you mouse over.
 
I always thought it would be awesome and helpful if the percentages would adjust relatively to the card you mouse over.
The reason why we don't use such a system is because I want people to be able to right click the image, get the URL, so they can easily repost it.
 
Instead of making the comparison with a particular card, you can compare with the average of all.
Sorry I don't understand what you are calculating here
 
Sorry I don't understand what you are calculating here

Game1: Card1 25 fps, Card2 50 fps, Card3 75 fps.
Game2: Card1 50 fps, Card2 25 fps, Card3 75 fps.

In an intuitive way Card3 is the fastest, and Card1 and Card2 are equal. To compare them before we introduce the Average.

Game1: Card1 25 fps, Card2 50 fps, Card3 75 fps, Average 50 fps.
Game2: Card1 50 fps, Card2 25 fps, Card3 75 fps, Average 50 fps.

Now we use the Average as a comparison.

Game1: Card1 50%, Card2 100%, Card3 150%, Average 100%.
Game2: Card1 100%, Card2 50%, Card3 150%, Average 100%.

Final: Card1 75%, Card2 75%, Card3 150%.


At this point it is easy to adjust it as you like.

 
Why would you compare RX 480's FPS @ game X (e.g. Far Cry Primal's 58.1) with the arithmetic mean of the FPS of the RX 480 and GTX 1060 of said game ( (58,1+64,7)/2 )? I surely must be missing something here ...
 
Last edited:
Why would you compare RX 480 FPS @ game X (e.g. Far Cry Primal's 58.1) with the arithmetic mean of the FPS of the RX 480 and GTX 1060 of said game ( (58,1+64,7)/2 )? I surely must be missing something here ...
It is another method to not have the initial problem but even more compact the chart, so forget it. :respect:

1^ case
Card1: 50 FPS in first game, 75 FPS in second game.
Card2: 75 FPS in first game, 50 FPS in second game.

Say you want to use Card1 as a reference.

Card1: 100% in first game, 100% in second game.
Card2: 150% in first game, 67% in second game.

Mean Card1: 100%. Geometric Mean Card1: 100%.
Mean Card2: 109%. Geometric Mean Card2: 100%.


Say you want to use Mean as a reference.

Card1: 80% in first game, 120% in second game.
Card2: 120% in first game, 80% in second game.

Mean Card1: 100%.
Mean Card2: 100%.


2^case

Card1: 40 FPS in first game, 50 FPS in second game, 60 FPS in third game.
Card2: 120 FPS in first game, 100 FPS in second game, 90 FPS in third game.

Say you want to use Card1 as a reference.

Card1: 100% in first game, 100% in second game, 100% in third game.
Card2: 300% in first game, 200% in second game, 150% in third game.

Mean Card1: 100%. Geometric Mean Card1: 100%.
Mean Card2: 217%. Geometric Mean Card2: 208%.


Say you want to use Mean as a reference.

Card1: 50% in first game, 67% in second game, 80% in third game.
Card2: 150% in first game, 133% in second game, 120% in third game.


Mean Card1: 66%. --> 100%.
Mean Card2: 134%. --> 203%.
 
Last edited:
geometric mean and outliers is good for benchmark runs since you are taking measurements on the same card, same everything and you want an accurate average of 10 runs without the bugged runs
But for performance summary....I dunno I think it makes no sense
 
I made a quick google spreedsheat (link)

Picture:
View attachment 77171

You took outliers in only ONE direction: it's supposed to be in both directions or there will be quite a big skew in results.

Depending on the amount of total games used, 1 or 2 of each should suffice.

There were benchmarks a while back that were totally skewed by the game project cars. So much so that W1zzard even put an extra field in them (with and without project cars): that's how much a SINGLE game skewed the results.

The idea is to help remove the possibility of this happening again. Doesn't mean it won't happen again but it should make it VERY unlikely.

EDIT

In single card configurations, this SHOULD work but i have serious doubts in multi card configurations. That's because, usually, there are allot more then 2 games that scale poorly with multiple cards, or even scale @ all.
 
Last edited:
You took outliers in only ONE direction: it's supposed to be in both directions or there will be quite a big skew in results.
But the outliers below 1 are much closer to 1 (lowest=84%) than the ones above (128% and higher). Though I didn't mean to skew results or make it a balanced comparison. Just merely pointing out how it could be done ;)

It is another method to not have the initial problem but even more compact the chart, so forget it.
I don't want to forget about it. I'm simply trying to understand and follow.
If I understood you correctly, you suggested to compare a card (point of reference) vs a multitude of cards (the average of 'em). Is that correct?

But in post #32 you incorporated your point of reference when comparing the point of reference to the rest (1 card in your example). Maybe I am simply misunderstanding what you are trying to achieve, but I think you were more less doing what the picture below is showing on the right site, whereas I think you should be doing what I did on the left side.
understand.png
 
Last edited:
But the outliers below 1 are much closer to 1 (0.8409987) than the ones above (1.27972 and higher). Though I didn't mean to skew results or make it a balanced comparison. Just merely pointing out how it could be done ;)

Doesn't matter.

For argument's sake, let's suppose the outliers in one direction were ... say ... 0.45 while on the other side were ... say ... 1.3: you'd still take both out. The card could be so consistent that the outliers were like 0.95 and 1.05 respectively: you'd still take both out.
 
I don't want to forget about it. I'm simply trying to understand and follow.
If I understood you correctly, you suggested to compare a card (point of reference) vs a multitude of cards. Is that correct?
It is correct but doing further calculations, it does not work as expected.

But in post #32 you incorporated your point of reference when comparing the point of reference to the rest (1 card in your example). Maybe I am simply misunderstanding what you are trying to achieve, but I think you were more less doing what the picture below is showing on the right site, whereas I think you should be doing what I did on the left side.
View attachment 77174
Yes I did the math as your right side and indeed it is wrong.

Really, finding a consistent method is more difficult than expected.
 
You took outliers in only ONE direction: it's supposed to be in both directions or there will be quite a big skew in results.
But the outliers below 1 are much nearer to 1 than the ones above. Though I didn't mean to skew results or make it a balanced comparison. Just merely pointing out how it could be done ;)
Doesn't matter.

For argument's sake, let's suppose the outliers in one direction were ... say ... 0.45 while on the other side were ... say ... 1.3: you'd still take both out. The card could be so consistent that the outliers were like 0.95 and 1.05 respectively: you'd still take both out.
Just for you...

corrected math.png
 

Attachments

  • just4you.png
    just4you.png
    25.4 KB · Views: 576
Last edited:
I realized how stupid I am. Just use a if statement.

=IF(C3>B3; C3/B3; 2-B3/C3)

Where B and C are the columns of data.
 
But the outliers below 1 are much nearer to 1 than the ones above. Though I didn't mean to skew results or make it a balanced comparison. Just merely pointing out how it could be done ;)
Just for you...

View attachment 77176

Strange: i must have made an error in my calculations because i arrived @ 1.126379 when i did just that (removed 2 best and 2 worst), but that's just what i was trying to get @.

So long as there's a disclaimer showing how the results are achieved, this way of doing it should prove useful.

As for the whole arithmetic VS geometric thing, regardless of which one get's chosen in the end, removing outliers could still improve overall results.

EDIT

Just noticed where the difference lies: i took out COD black ops 3 and just cause 3 while you took out 2 other games.
Oops. Just noticed I fucked up. Was being hasty since I had more pressing things to do at work :p
Will change it accordingly when I get home ... (edited original post #45)
 
Last edited:
When the collection is big , the error is lesser . So , dont exclude any game . Yet , we play any game no matter which brand they favor , if any
 
So , dont exclude any game . Yet , we play any game no matter which brand they favor , if any
That's my main concern, people will complain about cherry-picking, especially less well informed readers.
 
Back
Top