Aquinus
Resident Wat-man
- Joined
- Jan 28, 2012
- Messages
- 13,199 (2.73/day)
- Location
- Concord, NH, USA
| System Name | Apollo |
|---|---|
| Processor | Intel Core i9 9880H |
| Motherboard | Some proprietary Apple thing. |
| Memory | 64GB DDR4-2667 |
| Video Card(s) | AMD Radeon Pro 5600M, 8GB HBM2 |
| Storage | 1TB Apple NVMe, 2TB external SSD, 4TB external HDD for backup. |
| Display(s) | 32" Dell UHD, 27" LG UHD, 28" LG 5k |
| Case | MacBook Pro (16", 2019) |
| Audio Device(s) | AirPods Pro, Sennheiser HD 380s w/ FIIO Alpen 2, or Logitech 2.1 Speakers |
| Power Supply | Display or Thunderbolt 4 Hub |
| Mouse | Logitech G502 |
| Keyboard | Logitech G915, GL Clicky |
| Software | MacOS 15.3.1 |
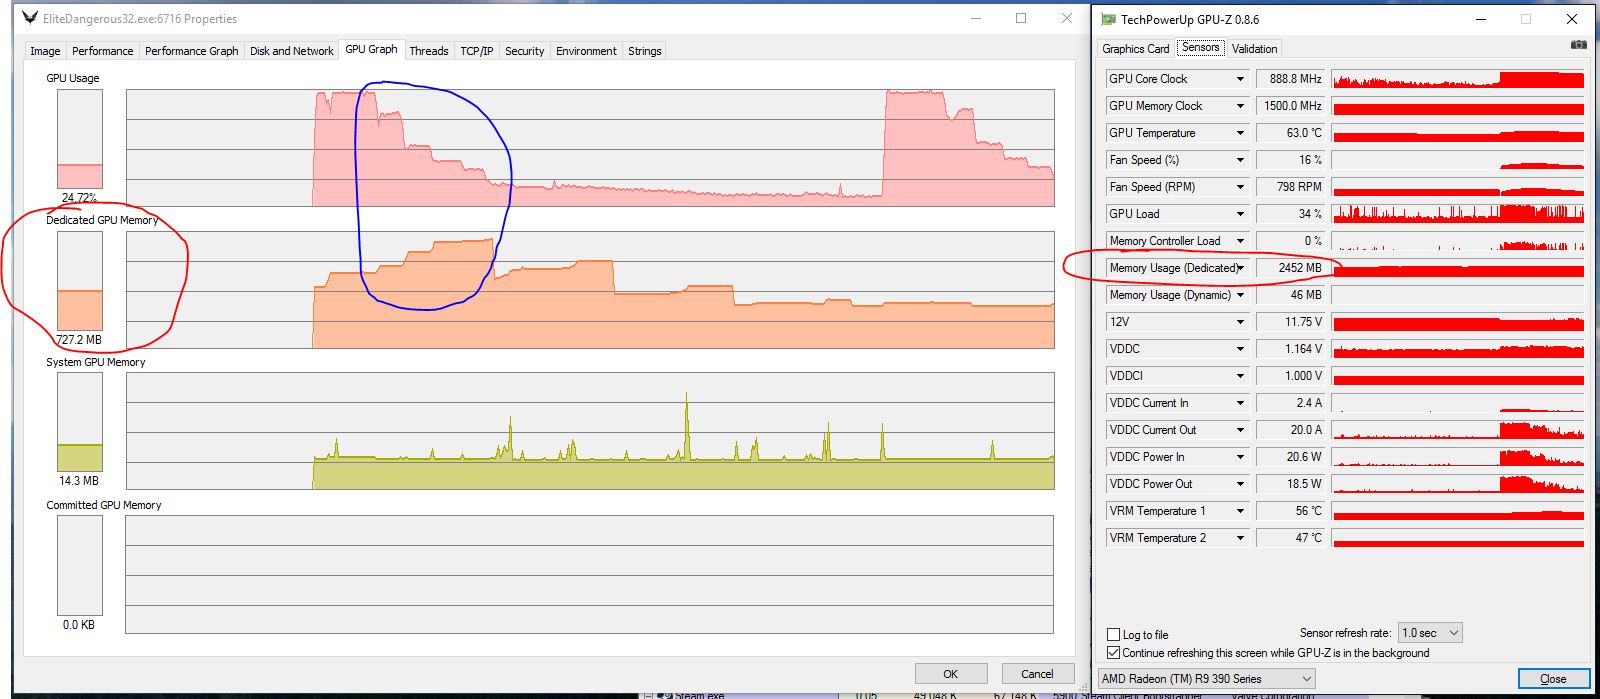
Howdy @W1zzard . I've been doing a ton of debugging of Elite: Dangerous to help FD figure out why there is a slow down in super cruise mode and I came across this little gem. Both MSI AfterBurner and ProcessExplorer are reporting the same kinds of numbers but, GPU-Z seems to think that a lot more GPU memory is being used. I think that both numbers here may be correct but reading different sources. I was wondering if you have any idea why these two numbers would be so vastly different if they're supposedly measuring the same thing. Please ignore that blue circle, that's for the guys over at FD. The red circles indicate what I'm describing. I know that ProcessExplorer is measuring just the application but at idle I'm using ~500MB according to GPU-Z, so if we just factor that out, there is still a pretty big difference.


