I used to consult the graph to have a rough idea how cards performed. But from may to june, the whole graph changed.
What happened? Did you guys re-test all these GPUs, because the graph looks all over the place (if not, please explain)
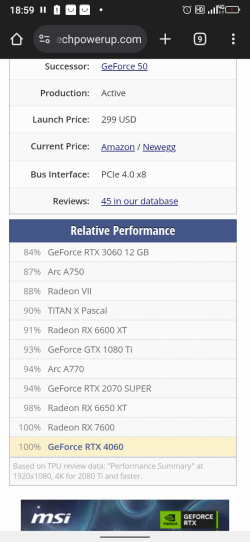
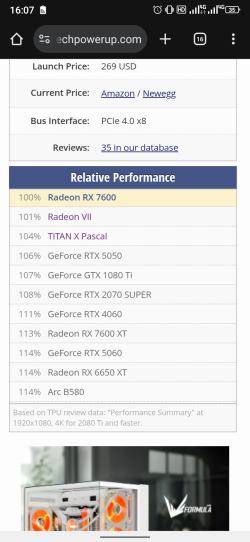
I'll drop 2 screenshots, one from may (or before, i don't remember) and another from the current date.
Example: in may, 6650xt was 2% under 7600 and 7600 was equal to 4060. But now:
7600 is 11% worse than 4060 and 6650xt is 14% better than 7600...
Anyone have any idea what happened? I talked to a guy that i know who works for techpowerup, but he only messes with SSDs so he said maybe they tested under different drivers? But i doubt (would be seriously surprised) if you guys actually re tested all these GPUs.
Thanks. Rexor .L
What happened? Did you guys re-test all these GPUs, because the graph looks all over the place (if not, please explain)
I'll drop 2 screenshots, one from may (or before, i don't remember) and another from the current date.
Example: in may, 6650xt was 2% under 7600 and 7600 was equal to 4060. But now:
7600 is 11% worse than 4060 and 6650xt is 14% better than 7600...
Anyone have any idea what happened? I talked to a guy that i know who works for techpowerup, but he only messes with SSDs so he said maybe they tested under different drivers? But i doubt (would be seriously surprised) if you guys actually re tested all these GPUs.
Thanks. Rexor .L