
- Joined
- May 6, 2018
- Messages
- 1,150 (0.45/day)
- Location
- Upstate NY
| System Name | Dual Socket HP z820 Workstation |
|---|---|
| Processor | Twin Intel Xeon E5 2673 v2 OEM processors (thats a total of 16C/32T) |
| Motherboard | HP Dual Socket Motherboard |
| Cooling | Stock HP liquid cooling |
| Memory | 64GB Registered ECC memory kit (octal channel memory on this rig) |
| Video Card(s) | MSI RX 5700 XT Gaming X 8GB |
| Storage | 2 x 512GB SSD in raid 0 |
| Display(s) | Acer 23" 75Hz Gaming monitors 1080P x2 |
| Case | Brushed Aluminium |
| Audio Device(s) | Integrated (5.1) |
| Power Supply | HP 1125W Stock PSU |
| Mouse | gaming mouse |
| Keyboard | Dell |
| Software | Windows 10 Pro |
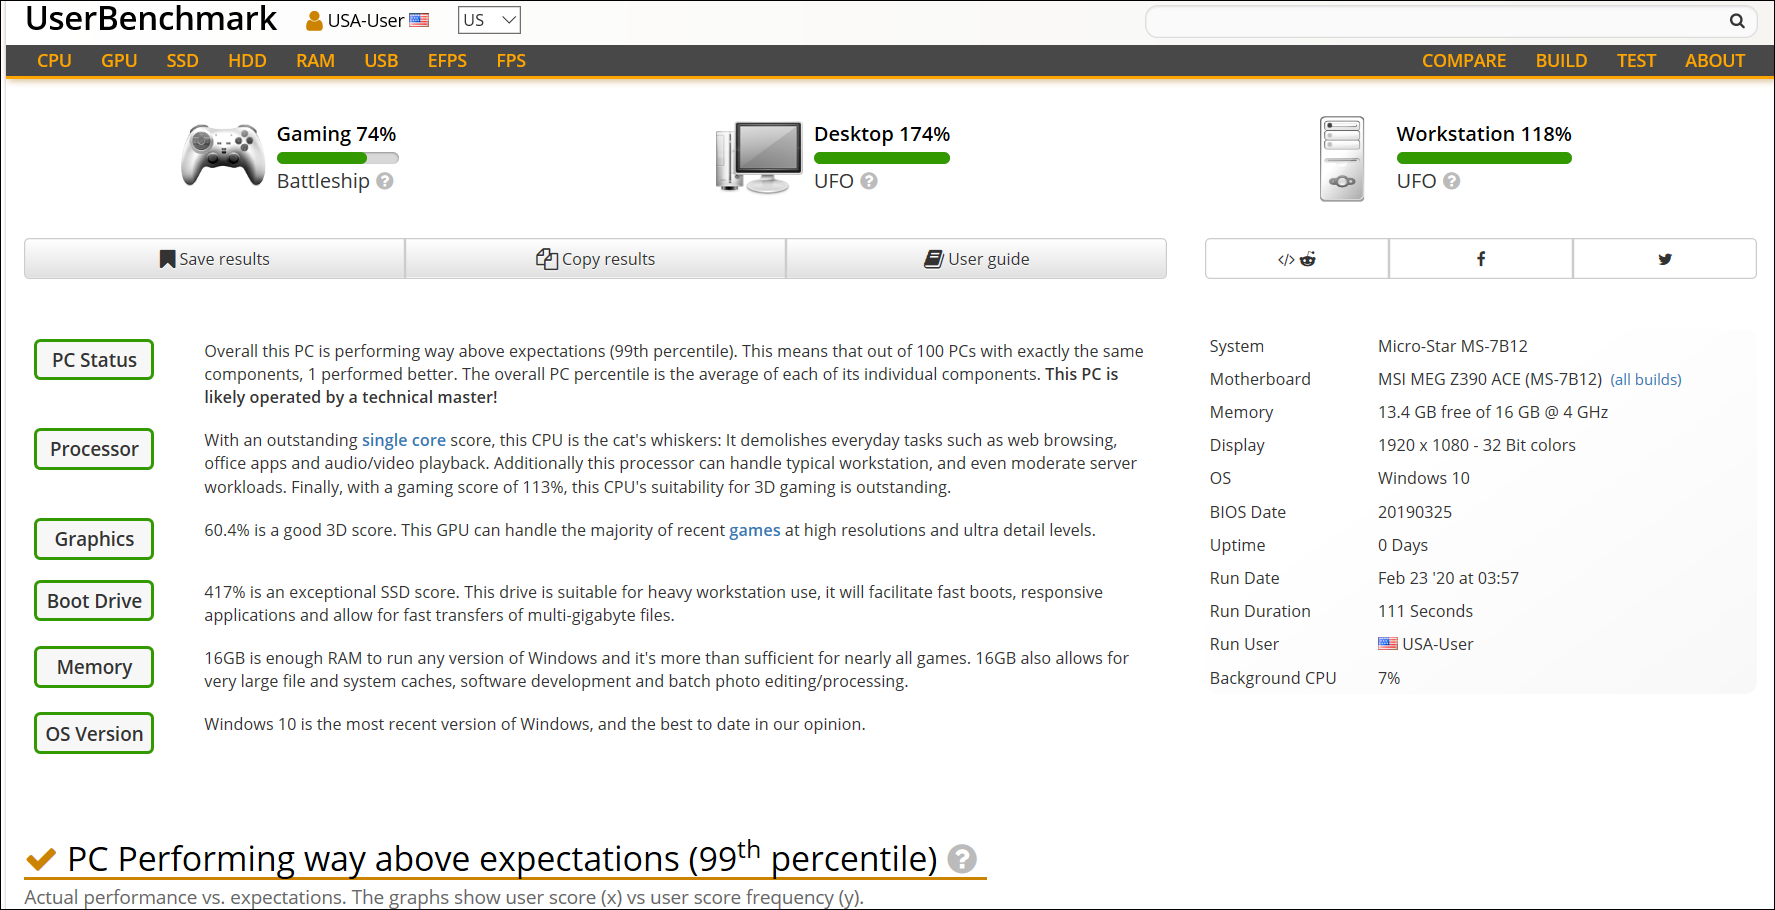
Yes, User-Benchmark gets a bad rap by some in the tech community! I think most of that is unwarranted. At the very least, that criticism will not diminish the competitive nature of this this friendly benchmark competition in the least. If you can cut through all the BS you'll actually see that it has extensive and comprehensive (user driven) stats on even the latest tech hardware, allowing for detailed performance comparisons between rigs and specific hardware choices. More information on exactly how userbenchmark assesses / determines your systems performance can be found later in the thread.
Scoring metrics:
Actual scoring of the competition will be determined by looking at your overall percentile rank, as determined by userbenchmark. In example:

You can compete for highest percentile rank overall, plus you can also compete for specific hardware in specific categories, if you wish.
Considering the benchmarking software is free, readily available and fast to run, I highly recommend anyone reading this to please give it a chance -- just download the benchmark (link below) and let it run. Takes all of one minute...
LINK: User Benchmark Test
Please follow a general layout like this
-Provide a hyperlink to your benchmark result
-Provide a little background information on your rig or your specific overclock, if you'd like
-Any other relevant info you think we should know about your system
You may, or may not take snips of your results. If you have something exceptional and you want everyone to see it, by all means, post it with your result like this:

Notable Submissions as of 12-27-20:
Best Overall CPU Effective Speed = Arctucas, 8 core Intel i9-9900K, 111%
Best Overall GPU Effective Speed = KainXS, Asus nVidia RTX 3070 TUF 8GB, 171%
Best Overall Memory Effective Speed = Arctucas, G.SKILL F4 DDR4 4000 C19 2x16GB Kit, 138%
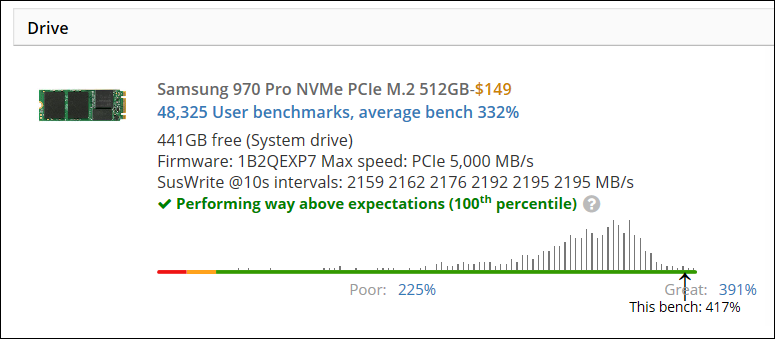
Best Overall SSD Effective Speed = Storm-Chaser, 512GB Samsung 970 Pro NVMe M.2, 417%
In theory, if userbenchmark.com is accurate, which it is, this combination of hardware should net you supreme overall performance, so long as you have the proper tuning and overclocking in place to take advantage of this performance potential. No guarantees, but this assessment does appear to align accurately with known performance data.
Leaderboard entries, listed below, are color coded to make for easy comparisons:
Blue = Team Intel
Red = Team AMD
Orange = 100th percentile Results (top marks)
Green = Honorable Mentions
Red + Bold = Top score from each category
Bold = Honorable mentions in each category
Basically, if it's in a different color or bold, it's a notable result...
A couple pointers to de-mystify this experience:
*In listing the effective CPU speed above in the leaderboard, know that it is being measured relative to a 9900K 8 core CPU.
*In other words, the 8 core 9900K is the CPU performance baseline and the standard to which all other CPUs are measured. (9900K = 100%)
*The Nvidia RTX 2060 super is the GPU performance baseline to which all other GPUs are measured. (RTX 2060s = 100%)
*The Samsung 850 Pro is the SSD performance baseline to which all other SSDs are measured. (850 Pro = 100%)
*Dual channel DDR4 RAM running at 3000 MHz on a Skylake chip = 100% (so this configuration is the memory baseline to which all other memory is compared)
So, effective speed is a (global) comparison, contrasting your CPU 's performance to everything else on the market (example: your CPU vs the world), in other words, grading your processors performance relative to all other CPUs on the market.
Percentile score/result refers to how well your particular hardware does within its own class. (example: your CPU vs all other identical CPU benchmarks in the userbenchmark.com database). In other words, grading your processors performance within it's own class. This is done with your GPU, SSD and memory as well, and both of these results are listed in the same category, as seen below.
Current Leaderboard (updated 2-24)
(Updated 3PM December 30th, 2020)


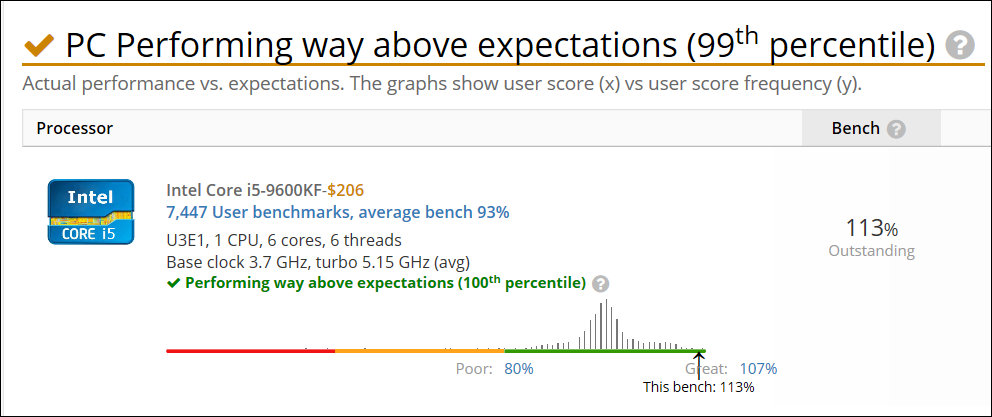
*As you can see from the leaderboard, we have a number of processors highlighted that provide over the 100% CPU effective speed baseline. If you are interested in some of the more detailed comparisons, you can see how userbenchmark.com rates these processors against each other, for example, the 3.7GHz base / 4.6GHz Boost 6C/6T Intel i5-9600KF (Q2 2019) verses the 3.8GHz base / 4.7GHz Boost 8C/16T AMD Ryzen 5800X (Q4 2020); both yield a CPU effective speed of 108% and 107% on the leaderboard, respectively. Understand that both of our overclocked configurations are taken into account by userbenchmark.com when determining CPU Effective speed.
Detailed (and accurate) userbenchmark.com CPU assessments and comparisons can be found here:
UserBenchmark: AMD Ryzen 7 5800X vs Intel Core i5-9600KF
UserBenchmark: Intel Core i5-9600KF vs i7-8700K
*Seeing identical consistency between vabeachboy0s I7-8700K @ 5.15GHz at 108% CPU Effective Speed and storm-chasers i5 9600KF @ 5.15GHz at the SAME 108% Effective Speed indicates very accurate and precise CPU performance assessments, as both of these processors are known to offer nearly identical performance at the same clock speed, only real difference being that the older i7-8700K has hyperthreading, meaning 6 cores and 12 threads; as opposed to only 6 cores and 6 threads for the later generation i5-9600KF (which is also accounted for in the benchmark results listed below).
vabeachboy0's i7-8700K 108% CPU Effective Speed Result:

Storm-Chaser's i5-9600KF 108% CPU Effective Speed Result:

And for comparison purposes, here is CainXS 107% CPU Effective Speed Result:

Again, you will see some tech people out in the world that like to bad mouth userbenchmark.com (as evidenced by the initial resistance to this thread when I first posted this competition a few days ago), but know that it is actually one of the most accurate benchmark sites on the internet, can be trusted, and know that most of these people that bad mouth it simply work to influence marketing or public perception of certain products and they are simply afraid of userbenchmark.com because it accurately lists the performance of some product or piece of hardware that they are desperately working to enhance beyond what the real world benchmarks reveal. Leaving them with no choice but to bash the source as "un-credible"... in fact, these people are not far off!!! Just a few digits in fact!
Userbenchmark.com is not "un-credible"
Userbenchmark.com is "in-credible"
*And again, I am saying this as someone who is in no way connected to them, I just enjoy hosting friendly benchmark competitions so I know who is credible and who is not! And I will NOT withhold the truth from my friends here at TPU! Userbenchmark.com is 100% Trustworthy! Power to the people!
Scoring metrics:
Actual scoring of the competition will be determined by looking at your overall percentile rank, as determined by userbenchmark. In example:
You can compete for highest percentile rank overall, plus you can also compete for specific hardware in specific categories, if you wish.
Considering the benchmarking software is free, readily available and fast to run, I highly recommend anyone reading this to please give it a chance -- just download the benchmark (link below) and let it run. Takes all of one minute...
LINK: User Benchmark Test
Please follow a general layout like this
-Provide a hyperlink to your benchmark result
-Provide a little background information on your rig or your specific overclock, if you'd like
-Any other relevant info you think we should know about your system
You may, or may not take snips of your results. If you have something exceptional and you want everyone to see it, by all means, post it with your result like this:
Notable Submissions as of 12-27-20:
Best Overall CPU Effective Speed = Arctucas, 8 core Intel i9-9900K, 111%
Best Overall GPU Effective Speed = KainXS, Asus nVidia RTX 3070 TUF 8GB, 171%
Best Overall Memory Effective Speed = Arctucas, G.SKILL F4 DDR4 4000 C19 2x16GB Kit, 138%
Best Overall SSD Effective Speed = Storm-Chaser, 512GB Samsung 970 Pro NVMe M.2, 417%
In theory, if userbenchmark.com is accurate, which it is, this combination of hardware should net you supreme overall performance, so long as you have the proper tuning and overclocking in place to take advantage of this performance potential. No guarantees, but this assessment does appear to align accurately with known performance data.
Leaderboard entries, listed below, are color coded to make for easy comparisons:
Blue = Team Intel
Red = Team AMD
Orange = 100th percentile Results (top marks)
Green = Honorable Mentions
Red + Bold = Top score from each category
Bold = Honorable mentions in each category
Basically, if it's in a different color or bold, it's a notable result...
A couple pointers to de-mystify this experience:
*In listing the effective CPU speed above in the leaderboard, know that it is being measured relative to a 9900K 8 core CPU.
*In other words, the 8 core 9900K is the CPU performance baseline and the standard to which all other CPUs are measured. (9900K = 100%)
*The Nvidia RTX 2060 super is the GPU performance baseline to which all other GPUs are measured. (RTX 2060s = 100%)
*The Samsung 850 Pro is the SSD performance baseline to which all other SSDs are measured. (850 Pro = 100%)
*Dual channel DDR4 RAM running at 3000 MHz on a Skylake chip = 100% (so this configuration is the memory baseline to which all other memory is compared)
So, effective speed is a (global) comparison, contrasting your CPU 's performance to everything else on the market (example: your CPU vs the world), in other words, grading your processors performance relative to all other CPUs on the market.
Percentile score/result refers to how well your particular hardware does within its own class. (example: your CPU vs all other identical CPU benchmarks in the userbenchmark.com database). In other words, grading your processors performance within it's own class. This is done with your GPU, SSD and memory as well, and both of these results are listed in the same category, as seen below.
Current Leaderboard (updated 2-24)
(Updated 3PM December 30th, 2020)
*As you can see from the leaderboard, we have a number of processors highlighted that provide over the 100% CPU effective speed baseline. If you are interested in some of the more detailed comparisons, you can see how userbenchmark.com rates these processors against each other, for example, the 3.7GHz base / 4.6GHz Boost 6C/6T Intel i5-9600KF (Q2 2019) verses the 3.8GHz base / 4.7GHz Boost 8C/16T AMD Ryzen 5800X (Q4 2020); both yield a CPU effective speed of 108% and 107% on the leaderboard, respectively. Understand that both of our overclocked configurations are taken into account by userbenchmark.com when determining CPU Effective speed.
Detailed (and accurate) userbenchmark.com CPU assessments and comparisons can be found here:
UserBenchmark: AMD Ryzen 7 5800X vs Intel Core i5-9600KF
UserBenchmark: Intel Core i5-9600KF vs i7-8700K
*Seeing identical consistency between vabeachboy0s I7-8700K @ 5.15GHz at 108% CPU Effective Speed and storm-chasers i5 9600KF @ 5.15GHz at the SAME 108% Effective Speed indicates very accurate and precise CPU performance assessments, as both of these processors are known to offer nearly identical performance at the same clock speed, only real difference being that the older i7-8700K has hyperthreading, meaning 6 cores and 12 threads; as opposed to only 6 cores and 6 threads for the later generation i5-9600KF (which is also accounted for in the benchmark results listed below).
vabeachboy0's i7-8700K 108% CPU Effective Speed Result:
Storm-Chaser's i5-9600KF 108% CPU Effective Speed Result:
And for comparison purposes, here is CainXS 107% CPU Effective Speed Result:
Again, you will see some tech people out in the world that like to bad mouth userbenchmark.com (as evidenced by the initial resistance to this thread when I first posted this competition a few days ago), but know that it is actually one of the most accurate benchmark sites on the internet, can be trusted, and know that most of these people that bad mouth it simply work to influence marketing or public perception of certain products and they are simply afraid of userbenchmark.com because it accurately lists the performance of some product or piece of hardware that they are desperately working to enhance beyond what the real world benchmarks reveal. Leaving them with no choice but to bash the source as "un-credible"... in fact, these people are not far off!!! Just a few digits in fact!
Userbenchmark.com is not "un-credible"
Userbenchmark.com is "in-credible"
*And again, I am saying this as someone who is in no way connected to them, I just enjoy hosting friendly benchmark competitions so I know who is credible and who is not! And I will NOT withhold the truth from my friends here at TPU! Userbenchmark.com is 100% Trustworthy! Power to the people!
Attachments
-
 1608782360244.png128.3 KB · Views: 157
 -
 1608782377520.png128.3 KB · Views: 121
 -
 1609129200287.png64.8 KB · Views: 178
Last edited:
")


