Sorry I was looking at the wrong leaderboard revision. I'll fix that now.
Also give me 30-40 minutes and I will have some answers to your questions, forgot to address yesterday.
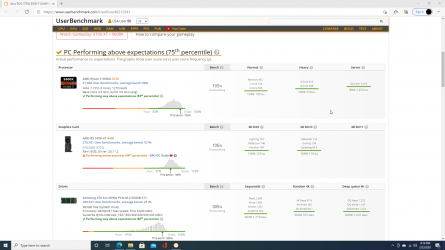
I really don't understand how this benchmark works.. It seems like my pci gen4 m.2 drive's is lowering my score (?) lol
You are not alone, the benchmark is quite complex in terms of assessing system performance and also takes to account the CPU's value for the money. If you go back to page one (if you haven't already) you will see where I laid out the inner workings of this benchmark engine.
Your percentile score is a measured average of all components within your system. So in this case, yes, a supplemental SSD that doesn't score very well will most definitely effect your overall (global) percentile result. I recommend just running your primary SSD for optimal results when running this benchmark.
Notes on Effective Speed:
We calculate
effective speed which measures real world performance for typical users. Effective speed is adjusted by current prices to yield a
value for money rating. Our calculated values are checked against thousands of individual
user ratings. The customizable table below combines these factors to bring you the definitive list of top CPUs.
The CPU value for money rating measures real world performance per unit cost. It is calculated as:
Effective Speed / squareroot(Price) * Scale Factor. The resulting number is a percentage and increases with real speed for a given price. The scale factor is updated periodically to ensure that the best processor scores 100%.
For example, my 9600KF is one of the best in terms of value according to userbenchmark.com (and I happen to agree with this)
Another interesting feature of userbenchmark.com is the extensive library of games used in measuring FPS. You can also compare GPU performance with other user submitted GPU benchmarks (of the same hardware), see the following link for details
FPS - UserBenchmark Search
Effective RAM speed
The effective RAM speed index is weighted as 80% multi-core throughput, 10% single-core throughput and 10% latency. Dual channel RAM running at 3000 MHz on a skylake chip ≈ 100%. See a current list of RAM Kits and their effective speeds (Avg. bench)
here.
AA measure of PC gaming performance that includes frame drops.
Average Fps don't tell the whole story. High average Fps can be accompanied by stuttering which results in a poor overall gaming experience. Effective Fps (EFps) measure gaming experience using both average Fps and frame drops. Frame drops are quantified using the following four statistics:
0.1% and 1% Lows (Avg|Max)
To calculate the 0.1% low all the frames in a sample are sorted from slowest to fastest. For a 60 second sample, the frames in the first 0.1%: 60s * 0.1% = 60s/1000 = 0.06s are used to determine the 0.1% low. The average and maximum Fps of those (slowest) frames are the Avg|Max 0.1% lows. A similar calculation is used for the Avg and Max 1% lows.
(download example calc spreadsheet )
EFps vs Fps
For most games
EFps are similar to average Fps (e.g. GTAV). Where frame delivery is very consistent
EFps are higher than average Fps (e.g. Overwatch). Where frames are relatively inconsistent
EFps are lower than average Fps (e.g. CSGO). EFps incorporate and improve upon average Fps as a measure of real world playability.
Game / Sequence choice
Benchmarks from turn based games such as Total War*, Civ* or canned benchmarks such as ulletical CSGO and the built in benchmarks in many games are essentially rendering benchmarks. These benchmarks don’t measure responsiveness to player inputs, they measure video playback performance. Game benchmarks need to include user inputs in order to measure the stability of frames whilst a user is actually playing. Game choice is also essential. Using games that nobody plays is no better than using Cinebench*. Benchmark data should include video footage of the game sequence and precise game settings so that users can replicate the scores.
Bottlenecks
PC components are similar to links in a chain: weak components bottleneck the whole system. For example:
an AMD Ryzen 3700X bottlenecks an Nvidia 2070 Super. The 3700X costs 40% more money for 11% less performance. The lost performance is similar to downgrading from a
2070S to a 2060S. Publishing EFps data puts UserBenchmark in conflict with the marketing from billion dollar corporations, but it also helps our users to build faster PCs by dodging marketing traps.
Users can verify EFps figures with Afterburner
The percentage of recent positive votes received. 60% is good, 85% is exceptional.
Scores over 85% require users from at least 100 different countries to have recently voted up a product. There are only a small handful of products on the site scoring over 85%. Every user is allowed one vote per product. Unregistered users share one login per country, this reduces the impact of brand reps repeatedly voting on their own products. Given enough time and votes, the rating for a product reflects the global user consensus.

")


")


 ?
?