• Welcome to TechPowerUp Forums, Guest! Please check out our forum guidelines for info related to our community.

TechPowerUp GPU-Z 0.3.8 released

W1zzard

Administrator
Staff member
Joined
May 14, 2004
Messages
28,968 (3.75/day)
Processor Ryzen 7 5700X
Memory 48 GB
Video Card(s) RTX 4080
Storage 2x HDD RAID 1, 3x M.2 NVMe
Display(s) 30" 2560x1600 + 19" 1280x1024
Software Windows 10 64-bit
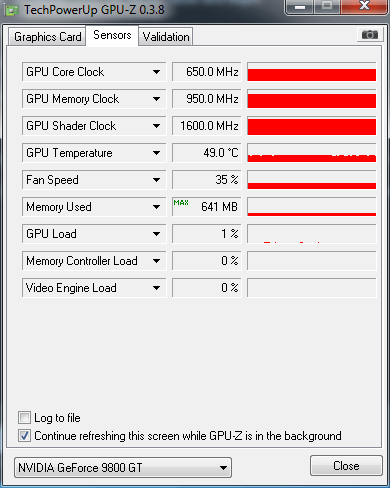
TechPowerUp released the newest version of GPU-Z, our graphics subsystem information and monitoring utility. Version 0.3.8 brings with it some useful updates that fix several crashes and add useful features to the vast amount of information this tiny utility can display. GPU-Z now displays three GPU load percentages on NVIDIA GPUs: 3D rendering core, memory controller and video acceleration engine. In addition to that we set the foundation to allow multi-language support in GPU-Z in the future. To move forward with this we'd like native speakers to help with support for their language. The whole effort is coordinated in our GPU-Z Translation Forum.


DOWNLOAD: TechPowerUp GPU-Z 0.3.8

A complete list of changes according to the change log is as follows:
  • Added framework for translations in GPU-Z, to do that we need your help. Please go to tpu.me/forums/forumdisplay.php?f=72 to submit contributions in your language
  • Added sensors to monitor GPU load percentages on NVIDIA
  • Fixed startup on Windows 2000 (DLL not found)
  • Improved detection/added sensors for ATI M86
  • Fixed several NVAPI crashes
  • Fixed crash when PhysX not available
  • GPU-Z can now be set in its system menu to be always on top of other windows

View at TechPowerUp Main Site
 
Last edited by a moderator:
W1z those extra features are awesome, you da man!
 
Fantastic as always Wiz! Are those new features for monitoring loads on nvidia cards possible on Ati cards?
 
Fantastic as always Wiz! Are those new features for monitoring loads on nvidia cards possible on Ati cards?

nope, nvidia only at this time
 
Awesome, this explains why 1888 pt WUs get so bad PPD. It runs at 100% for 2 seconds, and then at 0-5% for 5 seconds, and then repeats :ohwell:
 
Nice,
Like to see GPU-z re sizable.
 
The GPU load meter is genius, especially for testing those GPU accelerated applications, as it gives a good indication on how much they really use the GPU.
 
The GPU load meter is genius, especially for testing those GPU accelerated applications, as it gives a good indication on how much they really use the GPU.

Agreed. Now I know how much F@H is using each GPU (and working at its full potential).
 
Sweet thanks w1zz
 
Another update:toast: Nice work W1zz!
 
Great downloading now! :)
 
I had a quick question. I always have SLI enabled but i also fold. So when i open GPU-Z and look at memory usage is it telling me the usage for that spacific GPU? or the shared meory in general? because i know when in SLI its only going to use 512 im just not sure what GPU-Z is reading.
 
Anyone with a G80 based card have the Load percentages working?
 
I had a quick question. I always have SLI enabled but i also fold. So when i open GPU-Z and look at memory usage is it telling me the usage for that spacific GPU? or the shared meory in general? because i know when in SLI its only going to use 512 im just not sure what GPU-Z is reading.

my guess it's the usage for the specific gpu. compare the graphics for sli and no-sli to be sure
 
Thank you W1zzard, excellent work. GPUZ now picks up the temps for my Asus 8800gt , have a zotac and asus temps always showed for the zotac but not for asus had to use Rivatuner before.
ive modded these to 9800gt sli, cant seem to get the load showing but the memory usage is a great idea.:)
 
Thx W1zzard! I've made a Polish translation to show you a little appreciation. It's already waiting in the right forum section. :)
Keep up the good work!
 
*sigh... still doesn't operate properly with the Hotfix drivers or AGP Radeon HD4000 cards. XP Pro /32

* GPU shows it's running at 100%
* Fan Speed shows - RPM
* Fan Speed shows - 5%
 
I decided to test out the memory usage monitor with my PNY XLR8 9800 GT 1GB. I played Team Fortress 2 at 1440*900, High settings, 16xAF/16xAF and achieved this maximum memory usage:

8ts.png


Guess i'm glad that I bought a 1024MB 9800 GT.

OS is Windows 7 x64, 191.07 drivers.

Also, GPU-Z is still thinking that my 9800 GT cards are 65nm. My PNY 10DE-0605 has a G92-280-B1 and the BFG 9800 GT Eco that I had for a day was 10DE-0614 with a G92-286-B1 core.
 
Definitely something strange going on... after I 'disabled' (unchecked enable) and re-enabled all the sensors, look what happens.
 

Attachments

  • gpu-z 0.3.8 12-2-09.gif
    gpu-z 0.3.8 12-2-09.gif
    12.7 KB · Views: 1,025
my guess it's the usage for the specific gpu. compare the graphics for sli and no-sli to be sure

As NVAPI says:

Code:
// FUNCTION NAME: NvAPI_GetDisplayDriverMemoryInfo
//
//   DESCRIPTION: Retrieves the display driver memory information for the active display handle.
//                In case of multiGPU scenario the physical framebuffer information is obtained for the GPU associated with active display handle.
//                [b]In case of SLI physical framebuffer information is obtained only from the display owner GPU.[/b]
 
Back
Top