• Welcome to TechPowerUp Forums, Guest! Please check out our forum guidelines for info related to our community.
  • The forums have been upgraded with support for dark mode. By default it will follow the setting on your system/browser. You may override it by scrolling to the end of the page and clicking the gears icon.

how to interpret GPU database results?

Joined
Nov 20, 2021
Messages
57 (0.04/day)
Processor 7800x3D
Motherboard Asus B650E-E
Cooling Arctic liquid freezer III 420
Memory 32GB 6000 CL28 DDR5
Video Card(s) RTX 4090
Storage 990 Pro 4tb
Display(s) Dell AW2725DF QD-OLED 360hz + LG Dual UP + 27GL850B
Audio Device(s) Topping DX7 PRO+
Power Supply Corsair HX850i
Mouse G-Wolves HSK pro 4k
Keyboard Wooting 80HE
Software 10 x64
I was looking at the GPU database and found some inconsistencies.

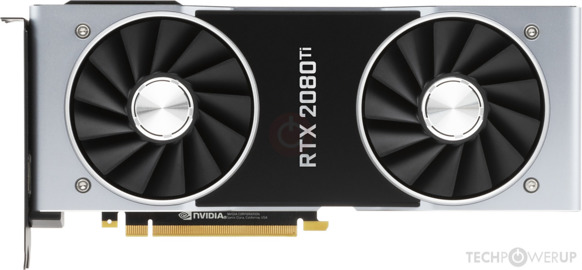
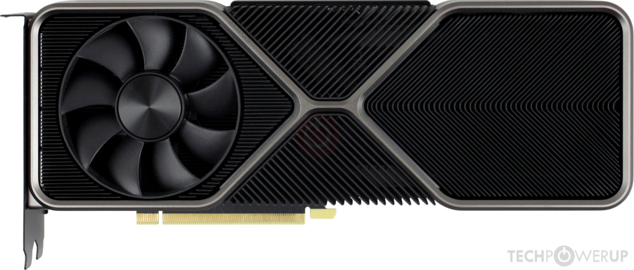
for example trying to find the difference between as 2080TI and a 3080, we look and the database says 39%


but if we go for example to the latest 3080 review


the difference is nowhere near that on any resolution, the relative performance differences are

1080: 41%
1440: 24%
4K: 30%
average: 31.5%

The DB says that the performance for 2080TI and over is 4K, but 4k performance on the reviews is +30% and the DB is a 39% meaning almost a 30% increase discrepancy.

the database stats doesn't match anywhere near those results nor any other review, so, what's wrong or what I am reading wrong from the DB about the results?
 
Last edited:
To prevent the Factory OC of the Noctua model from skewing the results, I took a look at the charts on the 3080 Founders Edition review:

Using the database, the 2080 Ti should have a relative performance of 72%. Per the 3080 FE review, the 2080 Ti has the following relative performance:

1080: 87%
1440: 81%
2160: 76%

This is different than your findings, which include a strong outlier at 1440. As the Noctua 3080 has slightly better performance than the FE model, due to the factory OC, I checked the review for it as well. The 2080 Ti has the following relative performance compared to the Noctua 3080:

1080: 84%
1440: 81%
2160: 77%

The Noctua 3080 has a 2% advantage over the 3080 (I assume this is the FE model?) at all resolutions.

So between Sep 16th, 2020, and May 23rd, 2022 (the 3080 FE and Noctua model review dates), the 2080 Ti performance changed at all resolutions relative to the 3080 FE:

1080: -1%
1440: +2%
2160: +3%

The only reason I can figure out for this is driver changes, assuming all cards were retested for each review. However, this would show that the last-generation card was improving faster than the current generation, which seems illogical at best. None of these numbers match up with the database, nor any sort of averaging makes them make sense. The only possibility I can think of is that the compute capability or memory bandwidth plays into it, so let's look at that.


Name:2080 Ti3080Ratio (3080 as baseline)
FP32:13.45 TFLOPS29.77 TFLOPS45.17%
Pixel Rate:136.0 GPixel/s164.2 GPixel/s82.83%
Texture Rate:420.2 GTexel/s465.1 GTexel/s90.35%
Memory Bandwidth:616.0 GB/s760.3 GB/s81.02%
Sources:

Averaging the FP32 ratio and the performance ratios at 1080, 1440, and 2160 (from the 3080 FE review) gives us the following:

Code:
45.17+87+81+76=289.17
289.17/4=72.29

So it LOOKS like the database works off of a straight average of FHD Gaming, QHD Gaming, 4k Gaming, and FP32 (GPGPU) capabilities. As I base many recommendations on this database's relative performance numbers, this is a legitimate concern for me. Maybe @W1zzard could confirm this?

Edited for clarity and to add links.
 
The database isn't intended to be 100% accurate, nor has it ever been advertised as such. Reviews are the place to look if you want the most up-to-date comparisons.
 
The admin recently mentioned it in a post, from someone asking the exact same question. It's some kind of algorithm from the past that still works surprisingly well to this day.. Can't find it so don't go on a wild goose chase. First off you are making it look worse than it is. In the latest 3090 Ti review we see even less improvement 26,5. Even then this is 10% discrepancie between 139 and 126,5. I also fall into trusting this database too often but in the end of the day, the latest review is what matters.
 
The database isn't intended to be 100% accurate, nor has it ever been advertised as such. Reviews are the place to look if you want the most up-to-date comparisons.
The admin recently mentioned it in a post, from someone asking the exact same question. It's some kind of algorithm from the past that still works surprisingly well to this day.. Can't find it so don't go on a wild goose chase. First off you are making it look worse than it is. In the latest 3090 Ti review we see even less improvement 26,5. Even then this is 10% discrepancie between 139 and 126,5. I also fall into trusting this database too often but in the end of the day, the latest review is what matters.
Just wanted to know if could be trusted, if it cannot ill just ditch it and keep an eye on the latest reviews when needed then, but it's a shame because on the reviews, some older cards are not compared anymore so the database still would have some uses, but not on myhands.

thanks for the answers
 
Just wanted to know if could be trusted, if it cannot ill just ditch it and keep an eye on the latest reviews when needed then, but it's a shame because on the reviews, some older cards are not compared anymore so the database still would have some uses, but not on myhands.

thanks for the answers
I'd say, it can be trusted, but with a huge grain of salt. It's not accurate data, but a good approximation of averages.

Personally, I never look at average data anyway. You're playing with specific games, not averages, so if you want meaningful data, read/watch reviews, and look for the games that you want to play. For example, it doesn't matter to me if a GPU destroys the competition in 10 games that I don't play if it sucks in the one that I'm interested in.

Everything else is an approximation.

I hope I helped.
 
Why not match it up with the 2080 since it’s what the 3080(I guess) is replacing.
 
Back
Top