
Hello. it's newbie on this forum.
I tested my memory with several different ram timing combinations. Tests include:
1. Super PI 32M digits of Pi calculation
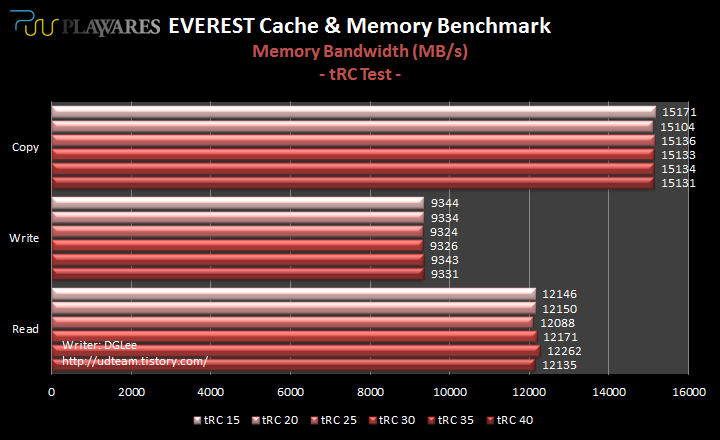
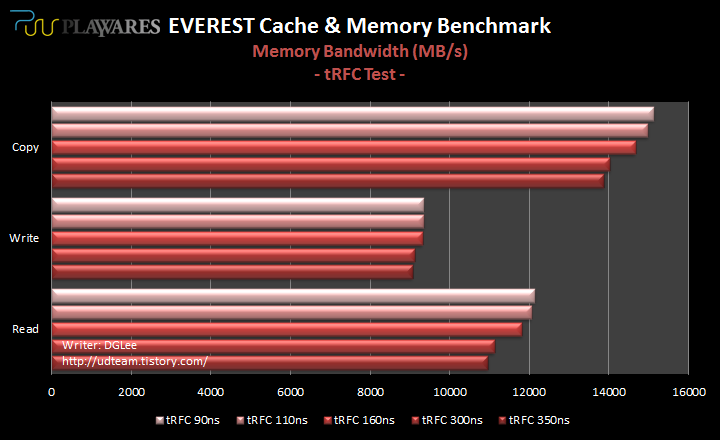
2. Lavalys Everest Cache & Memory Benchmark (Bandwidth & Latency)
3. Video Encoding (1080p TP -> mkv with H.264)
Tested ram timing items are:
1. CL: 6~11
2. tRCD: 9~11
3. tRP: 6~11
4. tRAS: 24~30
5. Command Rate: 1 / 2
6. tRC: 15~40
7. tRFC: 90ns / 110ns / 160ns / 300ns / 350ns
8. tREF: 3.9ms / 7.8ms
For test of a ram timing component, other components (except tRC and tREF) are set to the lowest possible values for variable control while tRC and tREF are to have the highest possible values as default.)
System setting is as follows:
- CPU: AMD Phenom II X6 @ 4.0GHz / NB 2.75GHz
- M/B: ASUS M4A89GTD-PRO USB3
- RAM: G.SKILL PIS PC3-19200 CL9 4GB (2GB x 2) @ 2000MHz
- Storage: Intel X25-M G2 80GB
- PSU: PC Power & Cooling Silencer 910W 80PLUS Silver
Before we see the results below, I think I need to mention about the methodology used in this article: I used two different techniques to analyze the results.
First is to analyze 'numerically': calculate the ratio between 'rate of perf. change' and 'rate of ram timing value change'. It emphasizes a ram timing's theoretical contribution to performance, but not necessarily means that we could/would get those amount of perf. gain (or loss) from dealing with said ram timing component since in practice we don't always treat a ram timing as numerical value (e.g. in BIOS, we don't set 10% more to CL, 5% less to tRCD... see what I mean?)
Rather, many BIOSs provide ram timing options as up/down menu so that a user cannot accurately change the value itself but can change only the provided 'degree' (e.g. in many BIOS, for tREF, there's 3.9ms / 7.8ms / 15.6ms... and so on. There's no 4.0ms or 5.0ms. It's likely a 'degree' rather than a 'numerics'.)
So, the second method is to analyze upon 'degree change': calculate the ratio between 'rate of perf. change' and 'number of degrees change'. It is more likely what we can expect when we're dealing with a ram timing component in practice (in BIOS), but it is apart from theory.
Okay. Then we see the results!
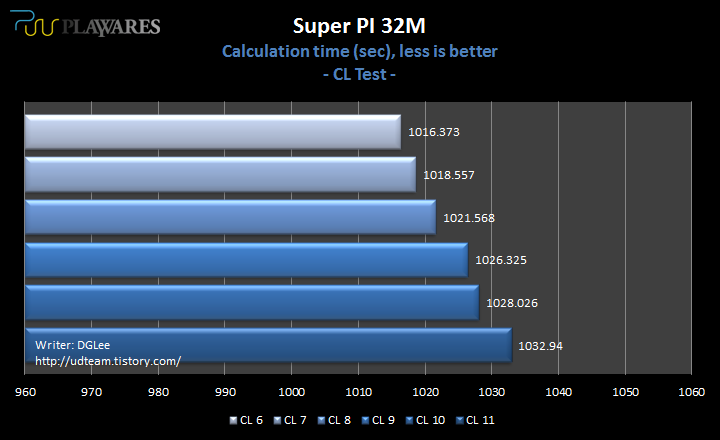
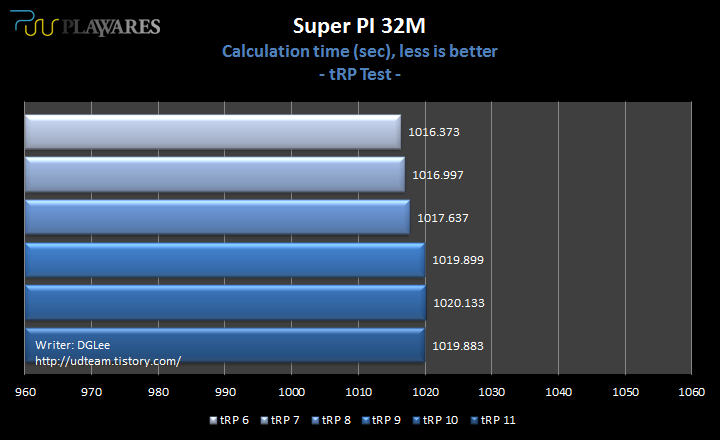
1. Super PI
Note that among ram timing items only tRFC and tREF are indexed by 'time unit' (second) while others by clock count (how many clock cycles (= inverse time unit) are consumed for a ram timing's operation). It's because they (tRFC and tREF) directly indicate characteristics of electrical working mechanism of a memory chip. Both are related to a memory's refresh rate: tREF determines how frequently a chip shall be refreshed and tRFC determines the time elapsed between the moment of 'refresh' (memory access is unavailable) and the moment when a memory access is back to available. So in case of tREF, the bigger value implies the better performance.


Theoretical Analysis for Super PI Test

In theory, CL / tRFC / tRCD / tREF and tRAS contribute more than 1% to performance, respectively.
(Note: 4% contribution of CL means, when we change the value of CL by 10%, the performance will be affected by 10% x 4% = 0.4%)
Practical Analysis for Super PI Test
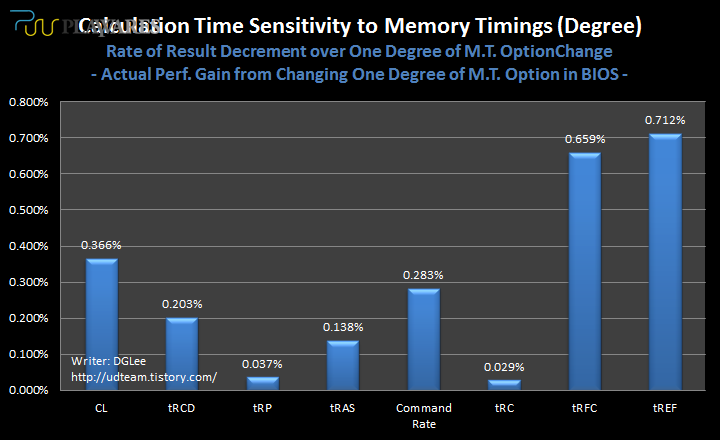
In practice, tRFC and tREF seem to be important since their minimum changeable units of '1-degree' in BIOS are bigger than others. (i.e. CL's minimum unit is '1 clock counts' while tRFC's minimum unit is '20~50ns', which is equivalent to 20~50 clock counts under 1000MHz.)
(continued)
I tested my memory with several different ram timing combinations. Tests include:
1. Super PI 32M digits of Pi calculation
2. Lavalys Everest Cache & Memory Benchmark (Bandwidth & Latency)
3. Video Encoding (1080p TP -> mkv with H.264)
Tested ram timing items are:
1. CL: 6~11
2. tRCD: 9~11
3. tRP: 6~11
4. tRAS: 24~30
5. Command Rate: 1 / 2
6. tRC: 15~40
7. tRFC: 90ns / 110ns / 160ns / 300ns / 350ns
8. tREF: 3.9ms / 7.8ms
For test of a ram timing component, other components (except tRC and tREF) are set to the lowest possible values for variable control while tRC and tREF are to have the highest possible values as default.)
System setting is as follows:
- CPU: AMD Phenom II X6 @ 4.0GHz / NB 2.75GHz
- M/B: ASUS M4A89GTD-PRO USB3
- RAM: G.SKILL PIS PC3-19200 CL9 4GB (2GB x 2) @ 2000MHz
- Storage: Intel X25-M G2 80GB
- PSU: PC Power & Cooling Silencer 910W 80PLUS Silver
Before we see the results below, I think I need to mention about the methodology used in this article: I used two different techniques to analyze the results.
First is to analyze 'numerically': calculate the ratio between 'rate of perf. change' and 'rate of ram timing value change'. It emphasizes a ram timing's theoretical contribution to performance, but not necessarily means that we could/would get those amount of perf. gain (or loss) from dealing with said ram timing component since in practice we don't always treat a ram timing as numerical value (e.g. in BIOS, we don't set 10% more to CL, 5% less to tRCD... see what I mean?)
Rather, many BIOSs provide ram timing options as up/down menu so that a user cannot accurately change the value itself but can change only the provided 'degree' (e.g. in many BIOS, for tREF, there's 3.9ms / 7.8ms / 15.6ms... and so on. There's no 4.0ms or 5.0ms. It's likely a 'degree' rather than a 'numerics'.)
So, the second method is to analyze upon 'degree change': calculate the ratio between 'rate of perf. change' and 'number of degrees change'. It is more likely what we can expect when we're dealing with a ram timing component in practice (in BIOS), but it is apart from theory.
Okay. Then we see the results!
1. Super PI
Note that among ram timing items only tRFC and tREF are indexed by 'time unit' (second) while others by clock count (how many clock cycles (= inverse time unit) are consumed for a ram timing's operation). It's because they (tRFC and tREF) directly indicate characteristics of electrical working mechanism of a memory chip. Both are related to a memory's refresh rate: tREF determines how frequently a chip shall be refreshed and tRFC determines the time elapsed between the moment of 'refresh' (memory access is unavailable) and the moment when a memory access is back to available. So in case of tREF, the bigger value implies the better performance.
Theoretical Analysis for Super PI Test
In theory, CL / tRFC / tRCD / tREF and tRAS contribute more than 1% to performance, respectively.
(Note: 4% contribution of CL means, when we change the value of CL by 10%, the performance will be affected by 10% x 4% = 0.4%)
Practical Analysis for Super PI Test
In practice, tRFC and tREF seem to be important since their minimum changeable units of '1-degree' in BIOS are bigger than others. (i.e. CL's minimum unit is '1 clock counts' while tRFC's minimum unit is '20~50ns', which is equivalent to 20~50 clock counts under 1000MHz.)
(continued)


")
")

 (wasn't concentrating)