 5
5
Thermaltake Toughpower DPS 850 W Review
Efficiency, Temperatures & Noise »Test Setup
All measurements were performed using two Chroma 6314A mainframes equipped with the following electronic loads: six 63123A [350 W each], one 63102A [100 W x2], and one 63101A [200 W]. The aforementioned equipment is able to deliver 2500 W of load, and all loads are controlled by a custom-made software. We also used a Picoscope 3424 oscilloscope, a Picotech TC-08 thermocouple data logger, a Fluke 175 multimeter, and a Yokogawa WT210 power meter. We also included a wooden box, which, along with some heating elements, was used as a hot box. Finally, we had at our disposal four more oscilloscopes (Rigol 1052E and VS5042, Stingray DS1M12, and a second Picoscope 3424), and a CEM DT-8852 sound level meter. You will find more details about our equipment and the review methodology we follow in this article,. Finally, we conduct all of our tests at 40°C-45°C ambient in order to simulate with higher accuracy the environment seen inside a typical system, with 40°C-45°C being derived from a standard ambient assumption of 23°C and 17°C-22°C being added for the typical temperature rise within a system.Primary Rails Voltage Regulation
The following charts show the voltage values of the main rails, recorded over a range from 60 W to the maximum specified load, and the deviation (in percent) for the same load range.


5VSB Regulation
The following chart shows how the 5VSB rail deals with the load we throw at it.

Hold-up Time
Hold-up time is a very important PSU characteristic and represents the amount of time, usually measured in milliseconds, a PSU can maintain output regulations as defined by the ATX spec without input power. In other words, it is the amount of time the system can continue to run without shutting down or rebooting during a power interruption. The ATX spec sets the minimum hold-up time to 16 ms with the maximum continuous output load. In the following screenshot, the blue line is the mains signal and the yellow line is the "Power Good" signal. The latter is de-asserted to a low state when any of the +12V, 5V, or 3.3V output voltages fall below the undervoltage threshold, or after the mains power has been removed for a sufficiently long time to guarantee that the PSU cannot operate anymore.

The unit still failed to pass or even get close to the minimum hold-up time the ATX spec sets, though it uses a pretty large bulk cap. It then failed to pass this test successfully, which is a shame. We will obviously dock the unit points in our final rating for its low hold-up time.
Inrush Current
Inrush current or switch-on surge refers to the maximum, instantaneous input-current drawn by an electrical device when first turned on. Because of the charging current of the APFC capacitor(s), PSUs produce large inrush-current right as they are turned on. Large inrush current can cause the tripping of circuit breakers and fuses and may also damage switches, relays and bridge rectifiers; as a result, the lower the inrush current of a PSU right as it is turned on, the better.
Thanks to the optimal design, registered inrush current was the lowest we have ever measured in units of similar capacity. Thermaltake did a fine job here, though we would prefer a larger bulk cap even if it would inevitably increase the inrush current by an insignificant amount.
Voltage Regulation and Efficiency Measurements
The first set of tests revealed the stability of the voltage rails and the efficiency of the DPS-850. The applied load was equal to (approximately) 20%, 40%, 50%, 60%, 80%, 100%, and 110% of the maximum load the PSU can handle. We conducted two additional tests. In the first test, we stressed the two minor rails (5V and 3.3V) with a high load while the load at +12V was only 0.10 A. This test reveals whether the PSU is Haswell ready or not. In the second test, we dialed the maximum load the +12V rail could handle while the load on the minor rails was minimal. Finally, the numbers in parenthesis show the readings that we took through Thermaltake's application.| Voltage Regulation & Efficiency Testing Data Thermaltake DPS-850 | ||||||||||
|---|---|---|---|---|---|---|---|---|---|---|
| Test | 12 V | 5 V | 3.3 V | 5VSB | Power (DC/AC) | Efficiency | Fan Speed | Fan Noise | Temp (In/Out) | PF/AC Volts |
| 20% Load | 12.305A (12.3A) | 1.973A (1.8A) | 1.988A (2.1A) | 0.981A | 169.74W (161.5W) | 90.94% (90.3%) | 480 RPM | 31.4 dBA | 38.56°C | 0.871 |
| 12.042V (12.03V) | 5.059V (5.04V) | 3.312V (3.3V) | 5.097V | 186.65W | 43.49°C (47.2°C) | 230.2V | ||||
| 40% Load | 24.959A (24.9A) | 3.968A (3.8A) | 3.990A (4.0A) | 1.180A | 339.69W (330W) | 92.81% (92.6%) | 728 RPM | 36.2 dBA | 39.15°C (50.6°C) | 0.939 |
| 12.041V (12.02V) | 5.036V (5.05V) | 3.307V (3.32V) | 5.072V | 366.01W | 44.74°C | 230.1V | ||||
| 50% Load | 31.166A (31.3A) | 4.970A (4.9A) | 4.995A (5.0A) | 1.580A | 424.58W (414.5W) | 92.70% (92.8%) | 795 RPM | 38.4 dBA | 40.34°C (51.8°C) | 0.953 |
| 12.037V (12.07V) | 5.023V (5.04V) | 3.302V (3.33V) | 5.049V | 458.03W | 46.37°C | 230.1V | ||||
| 60% Load | 37.385A (37.5A) | 5.982A (5.9A) | 6.001A (6.0A) | 1.985A | 509.60W (502W) | 92.41% (92.5%) | 877 RPM | 40.2 dBA | 41.37°C (53.0°C) | 0.957 |
| 12.033V (12.05V) | 5.010V (5.04V) | 3.299V (3.35V) | 5.026V | 551.46W | 48.28°C | 230.1V | ||||
| 80% Load | 49.984A (50.3A) | 8.016A (7.9A) | 8.008A (8.0A) | 2.400A | 679.47W (675W) | 91.57% (91.9%) | 995 RPM | 42.1 dBA | 42.67°C (54.9°C) | 0.964 |
| 12.026V (12.13V) | 4.988V (5.05V) | 3.296V (3.37V) | 4.992V | 742.00W | 51.66°C | 230.0V | ||||
| 100% Load | 63.206A (63.6A) | 9.057A (9.1A) | 9.018A (9.0A) | 3.025A | 849.34W (846W) | 90.54% (90.8%) | 1222 RPM | 46.5 dBA | 45.04°C (58.7°C) | 0.968 |
| 12.019V (12.10V) | 4.968V (5.06V) | 3.293V (3.39V) | 4.952V | 938.10W | 54.96°C | 229.9V | ||||
| 110% Load | 70.301A (71.1A) | 9.068A (9.1A) | 9.020A (9.0A) | 3.030A | 934.26W (933W) | 89.89% (90.3%) | 1288 RPM | 47.5 dBA | 45.89°C (60.9°C) | 0.970 |
| 12.014V (12.11V) | 4.960V (5.06V) | 3.293V (3.40V) | 4.944V | 1039.40W | 57.09°C | 229.9V | ||||
| Crossload 1 | 0.097A (0.1A) | 16.015A (15.6A) | 16.004A (16.0A) | 0.004A | 134.14W (132.5W) | 83.55% (81.4%) | 925 RPM | 41.5 dBA | 43.36°C (53.8°C) | 0.851 |
| 12.059V (12.04V) | 5.008V (5.04V) | 3.296V (3.37V) | 5.113V | 160.56W | 49.82°C | 230.3V | ||||
| Crossload 2 | 69.949A (70.6A) | 1.001A (0.9A) | 1.003A (1.1A) | 1.002A | 853.67W (854W) | 90.98% (90.3%) | 1214 RPM | 46.5 dBA | 44.80°C (58.3°C) | 0.968 |
| 12.013V (12.06V) | 5.004V (5.03V) | 3.307V (3.36V) | 5.039V | 938.35W | 54.99°C | 229.9V | ||||
Voltage regulation was absolutely fantastic, and only the 5V rail failed to keep up with the other two rails, though its deviation was still below 2%. Performance on the +12V rail's is jaw dropping since its deviation was only 0.2%! This is then clearly an example of what a PSU can accomplish with digital control. Check the corresponding graph on top of this page and you will notice that two digital units dominate the +12V voltage regulation section with minimal differences between them. Digital control doesn't only have to do with the provided software, or the bells and whistles it gives user who wants to monitor and control as many functions as possible; the digital control feature mostly addresses performance by boosting it considerably over that of classic analog circuits most units today exploit. The only problem is cost: The digital components for this task are expensive and the production lines still need to mature to lower the defective product ratio since the design's complexity makes it more difficult to manufacture.
As you can see from the above table, the fan only ramped up past 1000 RPM after the 80% test, where the ambient inside our hot box was very high—you can pick the option in Thermaltake's DPSApp if you want an ever-more-relaxed profile. Its high efficiency dialectically reduces heat dissipation and the need for airflow to keep its internals at normal temperatures. Though Thermaltake mentions a maximum operating temperature of 40°C, the PSU didn't have any problems at all in delivering its full power and even more at 45°C. We should, however, note that a PSU will last longer the cooler it runs, since its capacitors are then laden with less duress.
That said, we were troubled by its low PF readings, especially in the 20% load test with the maximum-rated-capacity load. The APFC apparently isn't digitally controlled like in Corsair's AXi units, where PF is very high throughout the entire load range. Normal consumers don't need to worry about PF since they only pay for the real power used, but it is still much better for the environment when a PSU has a PF reading as close as possible to the unity PF.
DPSApp Screenshots
Several screenshots of the DPSApp software, which we took during our test sessions, follow. The order of screenshots is the same as the order of the tests shown in the table above (20% load test to Cross-load 2).


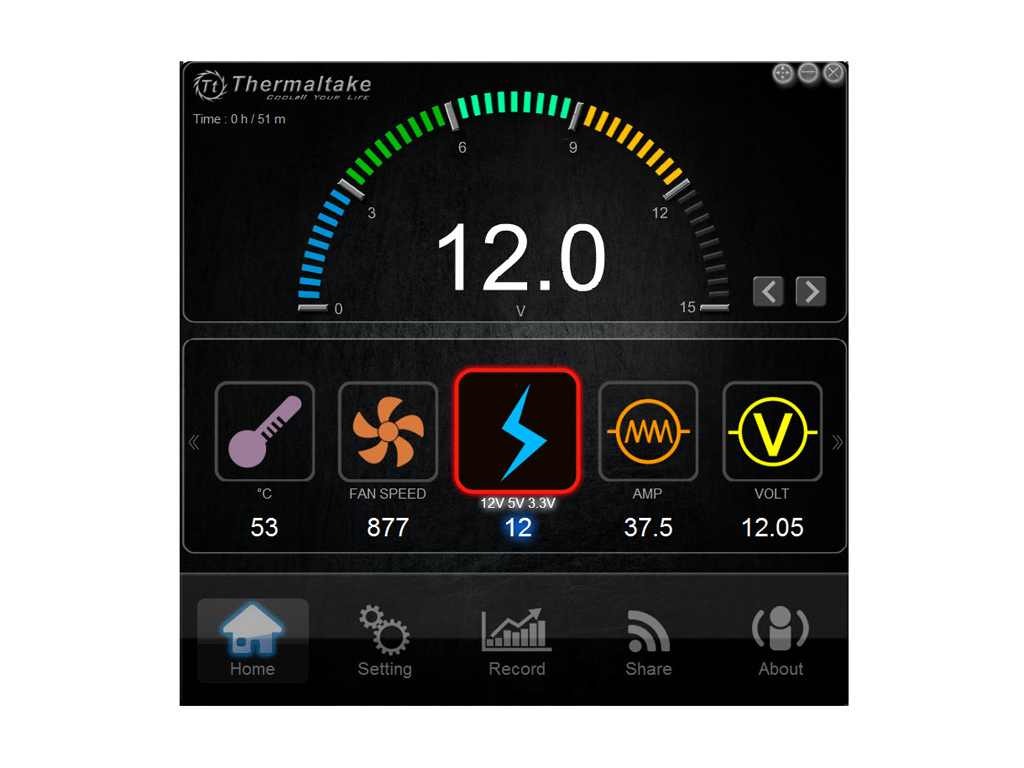

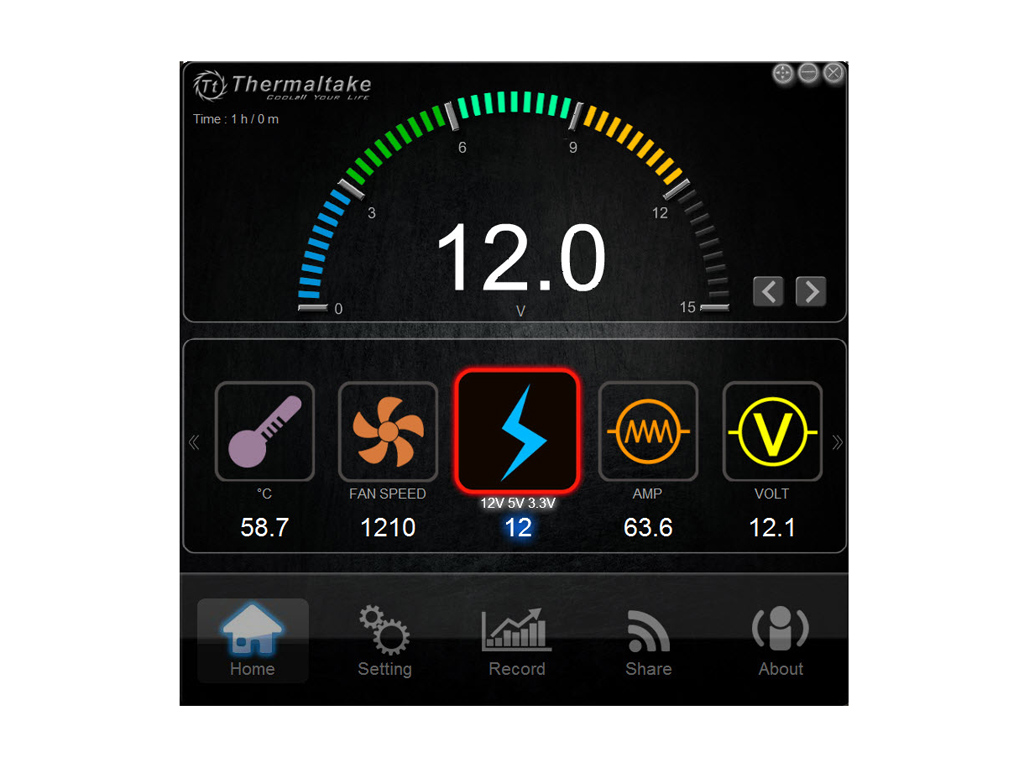


Current output and wattage readings were very close to the real ones, which impressed us. Efficiency results weren't dead-on but close enough to provide an overall picture of the unit's efficiency in real-life, which should satisfy the user's curiosity about how efficient the PSU is. Voltage measurements didn't match our readings, but were never too far off the truth.
May 2nd, 2024 15:01 EDT
change timezone
Latest GPU Drivers
New Forum Posts
- 7800x3d $216 in bundle at Microcenter (16)
- What phone you use as your daily driver? And, a discussion of them. (1503)
- What's your latest tech purchase? (20413)
- Is this Sapphire PULSE RX 5600 XT legit or fake? (27)
- Brother bought a house, found some old PC hardware.. (23)
- Old high quality PSU, or semi-old mid-quality PSU? (46)
- Are all software/scheduling issues with e-cores fixed on Intel 12th to 14th Gen - Willing to give hybrid ach a chance now (92)
- PYPrime 2.x free Memory benchmark. let's see those daily Memory OC performances. (42)
- The Official Thermal Interface Material thread (1132)
- CM 212+ Evo process (2)
Popular Reviews
- Ugreen NASync DXP4800 Plus Review
- ASRock NUC BOX-155H (Intel Core Ultra 7 155H) Review
- Montech Sky Two GX Review
- HYTE THICC Q60 240 mm AIO Review
- Upcoming Hardware Launches 2023 (Updated Feb 2024)
- MOONDROP x Crinacle DUSK In-Ear Monitors Review - The Last 5%
- Team Group T-Force Vulcan ECO DDR5-6000 32 GB CL38 Review
- AMD Ryzen 7 7800X3D Review - The Best Gaming CPU
- Thermalright Phantom Spirit 120 EVO Review
- ASUS Radeon RX 7900 GRE TUF OC Review
Controversial News Posts
- Intel Statement on Stability Issues: "Motherboard Makers to Blame" (228)
- Windows 11 Now Officially Adware as Microsoft Embeds Ads in the Start Menu (159)
- Sony PlayStation 5 Pro Specifications Confirmed, Console Arrives Before Holidays (117)
- AMD's RDNA 4 GPUs Could Stick with 18 Gbps GDDR6 Memory (111)
- NVIDIA Points Intel Raptor Lake CPU Users to Get Help from Intel Amid System Instability Issues (106)
- AMD "Strix Halo" Zen 5 Mobile Processor Pictured: Chiplet-based, Uses 256-bit LPDDR5X (103)
- AMD Ryzen 9 7900X3D Now at a Mouth-watering $329 (99)
- TechPowerUp Hiring: Reviewers Wanted for Motherboards, Laptops, Gaming Handhelds and Prebuilt Desktops (93)