 13
13
Corsair AX860i 860 W Review
Efficiency & Temperatures »Test Setup
All measurements were performed using two Chroma 6314A mainframes equipped with the following electronic loads: six 63123A [350 W each], one 63102A [100 W x2], and one 63101A [200 W]. The aforementioned equipment is able to deliver 2500 W of load, and all loads are controlled by a custom-made software. We also used a Picoscope 3424 oscilloscope, a Picotech TC-08 thermocouple data logger, a Fluke 175 multimeter, and a Yokogawa WT210 power meter. We also included a wooden box, which, along with some heating elements, was used as a hot box. Finally, we had at our disposal four more oscilloscopes (Rigol 1052E and VS5042, Stingray DS1M12, a second Picoscope 3424), and a CEM DT-8852 sound level meter. In this article, you will find more details about our equipment and the review methodology we follow. Finally, we conduct all of our tests at 40 - 45°C ambient in order to simulate with higher accuracy the environment seen inside a typical system, with 40 - 45°C being derived from a standard ambient assumption of 23°C and 17 - 22°C being added for the typical temperature rise within a system.Primary Rails Voltage Regulation
The following charts show the voltage values of the main rails, recorded over a range from 60W to the maximum specified load, and the deviation (in percent) for the same load range.


5VSB Regulation
The following chart shows how the 5VSB rail deals with the load we throw at it.

Hold-up Time
The hold-up time is a very important characteristic of a PSU and represents the amount of time, usually measured in milliseconds, that a PSU can maintain output regulations as defined by the ATX spec without input power. In other words, it is the amount of time that the system can continue to run without shutting down or rebooting during a power interruption. The ATX spec sets the minimum hold-up time to 16 ms at maximum continuous output load. In the following screenshot, the blue line is the mains signal and the yellow line is the "Power Good" signal. The latter is de-asserted to a low state when any of the +12V, 5V, or 3.3V output voltages fall below the undervoltage threshold, or after the mains power has been removed for a sufficiently long time to guarantee that the PSU cannot operate anymore.

This unit easily surpassed the ATX hold-up time threshold by taking the lead from its sibling with a 0.2 ms difference.
Inrush Current
Inrush current or switch-on surge refers to the maximum, instantaneous input-current drawn by an electrical device as it is turned on. Because of the charging current of the APFC capacitor(s), PSUs produce large inrush-current right as they are turned on. Large inrush current can cause the tripping of circuit breakers and fuses and may also damage switches or relays; as a result, the lower the inrush current of a PSU right as it is turned on, the better.
The higher capacity APFC cap is, compared to the AX760i, responsible for the larger inrush current that the AX860i registered.
Voltage Regulation and Efficiency Measurements
The first set of tests revealed the stability of the voltage rails and the efficiency of the AX860i. The applied load was equal to (approximately) 20%, 40%, 50%, 60%, 80%, 100% and 110% of the maximum load that the PSU can handle. In addition, we conducted two more tests. In the first test, we stressed the two minor rails (5V and 3.3V) with a high load while the load at +12V was only 2 A, and in the second test, we dialed the maximum load that the +12V rail could handle while the load on the minor rails was minimal.| Voltage Regulation & Efficiency Testing Data Corsair AX860i | |||||||||
|---|---|---|---|---|---|---|---|---|---|
| Test | 12 V | 5 V | 3.3 V | 5VSB | Power (DC/AC) | Efficiency | Fan Speed | Temp (In/Out) | PF/AC Volts |
| 20% Load | 12.486A | 1.982A | 1.984A | 0.995A | 171.73W (168W) | 91.24% (89.4%) | 0 RPM | 54.16°C (55.5°C) | 0.981 |
| 12.025V | 5.046V | 3.321V | 5.021V | 188.22W (188W) | 43.41°C | 230.0V | |||
| 40% Load | 25.325A | 3.969A | 3.981A | 1.196A | 343.66W (350W) | 93.29% (94.6%) | 428 RPM | 43.65°C (46.3°C) | 0.995 |
| 12.024V | 5.033V | 3.313V | 5.007V | 368.39W (370W) | 50.20°C | 230.0V | |||
| 50% Load | 31.615A | 4.961A | 4.987A | 1.596A | 429.55W (446W) | 93.56% (97%) | 592 RPM | 44.08°C (45.3°C) | 0.997 |
| 12.022V | 5.038V | 3.308V | 5.003V | 459.12W (460W) | 51.39°C | 229.9V | |||
| 60% Load | 37.919A | 5.957A | 5.971A | 2.003A | 515.50W (516W) | 93.45% (93.5%) | 724 RPM | 45.07°C (46.3°C) | 0.998 |
| 12.019V | 5.031V | 3.315V | 4.988V | 551.62W (552W) | 52.75°C | 229.9V | |||
| 80% Load | 50.689A | 7.957A | 7.991A | 2.410A | 687.37W (690W) | 92.81% (93.2%) | 1560 RPM | 45.54°C (47.3°C) | 0.999 |
| 12.015V | 5.022V | 3.303V | 4.972V | 740.65W (740W) | 53.57°C | 229.9V | |||
| 100% Load | 64.046A | 8.990A | 8.987A | 3.034A | 859.25W (868W) | 91.93% (92.9W) | 1872 RPM | 46.11°C (46.3°C) | 0.999 |
| 12.016V | 5.004V | 3.305V | 4.940V | 934.65W (934W) | 54.51°C | 229.7V | |||
| 110% Load | 71.201A | 8.992A | 8.985A | 3.035A | 945.23W (966W) | 91.35% (93.4%) | 2036 RPM | 46.34° (46.5°C)C | 0.999 |
| 12.016V | 5.003V | 3.305V | 4.940V | 1034.75W (1034W) | 55.19°C | 229.7V | |||
| Crossload 1 | 1.965A | 15.005A | 15.005A | 0.501A | 151.38W (154W) | 86.48% (87.5%) | 700 RPM | 44.07°C (46.3°C) | 0.978 |
| 12.024V | 5.026V | 3.320V | 5.039V | 175.05W (176W) | 51.47°C | 230.2V | |||
| Crossload 2 | 71.603A | 1.001A | 1.003A | 1.001A | 873.87W (884W) | 92.35% (93.2%) | 1656 RPM | 44.49°C (43.8°C) | 0.999 |
| 12.018V | 5.019V | 3.308V | 4.998V | 946.30W (948W) | 52.33°C | 229.7V | |||
As you can see, the PSU easily managed to handle 110% of its maximum rated capacity load with an ambient that exceeded 46°C, and the best part is that it did so with an excellent voltage-regulation on all rails and with very high efficiency. It is very impressive to see a PSU manage such low deviations on all rails under these severe conditions while registering a sky-high efficiency that reaches 93.5% at typical load. The digital control is, apparently, to be praised for such a performance, and Corsair did the right thing by investing in this technology, although it raises the price tag by a lot.
Regarding the fan speed, the PSU operated in fanless mode at 20% load and only from 40% load and onward did the fan engage with, at first, slow speeds. Its speed increased dramatically with 80% load and more; reaching 2000 RPM with 110% load. The fan is noisy at high RPM, but it will put out very little noise – noise that will most likely be covered up by other component in the chassis - at normal ambient closer to the PSU's real-life loads.
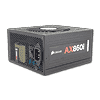
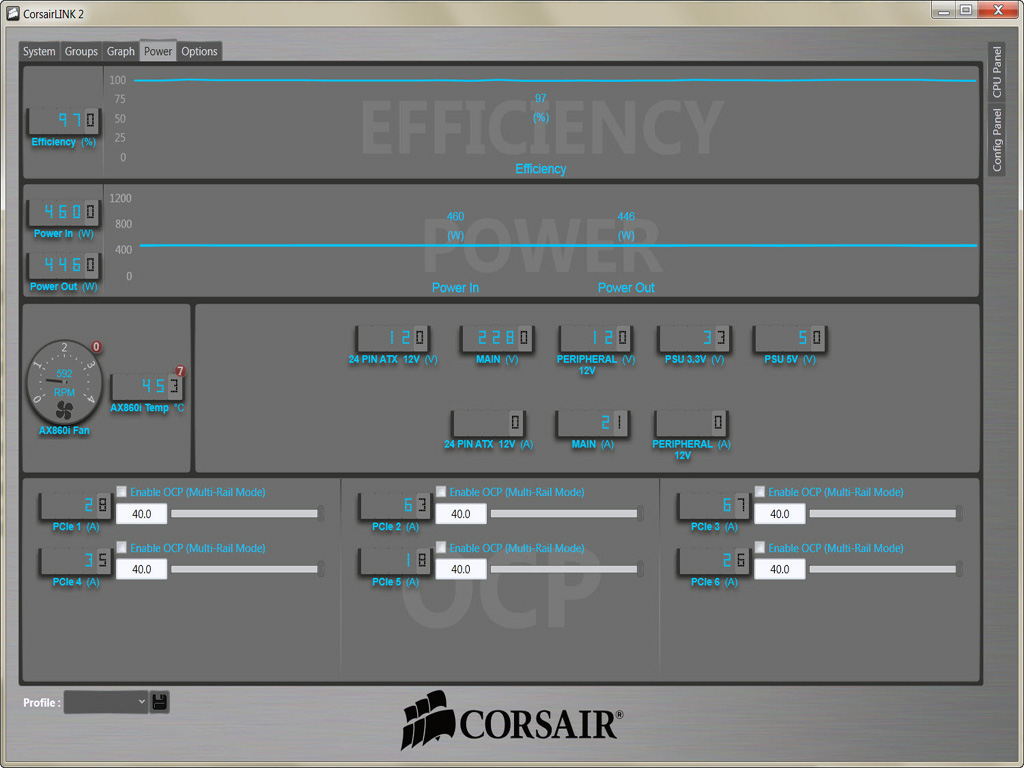
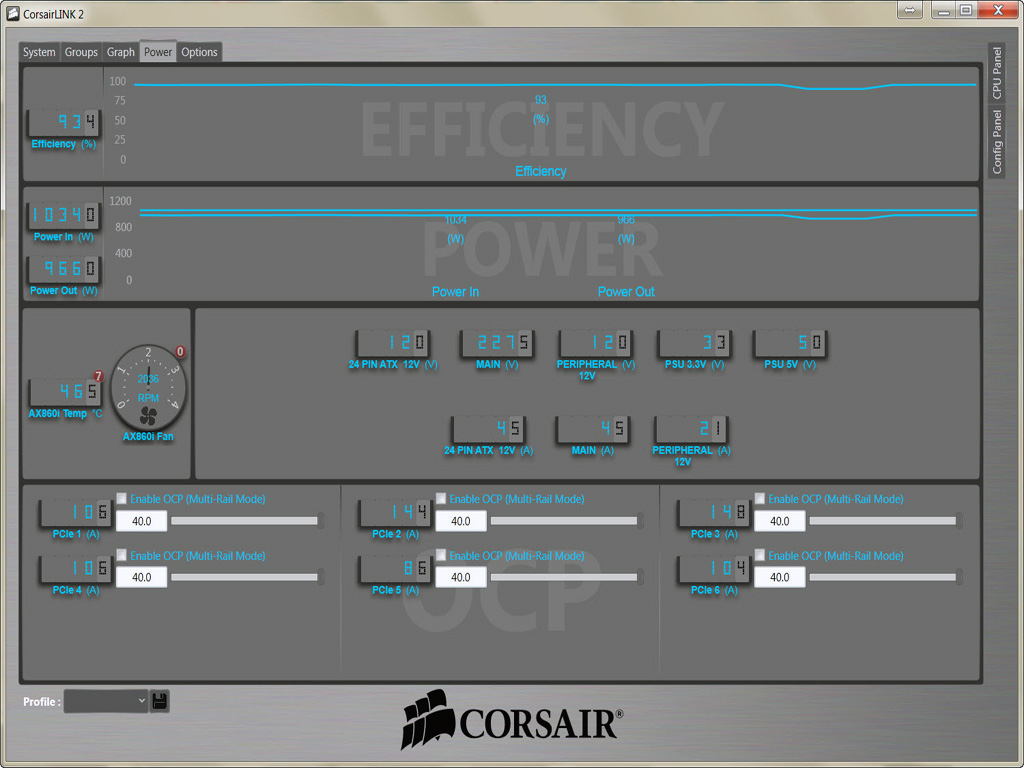
As for the readings of the Corsair Link software: the power measurements are close to the real ones and the differences are, especially with 60% and more load, amazingly small. Provided efficiency readings are also close to the ones that we measured with our equipment. Finally, the voltage readings remained unchanged during all tests, something that is normal given voltage drops on all rails were minimal.
Corsair Link Screenshots
Several screenshots of the Corsair Link software, which we took during our test sessions, follow. The order of the screenshots is the same as the order of the tests shown in the table above (20% load test to Cross-load 2).


Apr 26th, 2024 01:09 EDT
change timezone
Latest GPU Drivers
New Forum Posts
- What's your latest tech purchase? (20341)
- Horizontal black lines popping up on my screen? (0)
- Which new games will you be buying? (316)
- Alphacool CORE 1 CPU block - bulging with danger of splitting? (20)
- Black screen after muting (5)
- What phone you use as your daily driver? And, a discussion of them. (1481)
- What are you playing? (20530)
- Secure boot already open help (0)
- TPU's Nostalgic Hardware Club (18465)
- Post your Speedometer 3.0 Score (36)
Popular Reviews
- Fractal Design Terra Review
- Thermalright Phantom Spirit 120 EVO Review
- Corsair 2000D Airflow Review
- ASUS GeForce RTX 4090 STRIX OC Review
- NVIDIA GeForce RTX 4090 Founders Edition Review - Impressive Performance
- ASUS GeForce RTX 4090 Matrix Platinum Review - The RTX 4090 Ti
- MSI GeForce RTX 4090 Suprim X Review
- Gigabyte GeForce RTX 4090 Gaming OC Review
- MSI GeForce RTX 4090 Gaming X Trio Review
- MSI GeForce RTX 4090 Suprim Liquid X Review
Controversial News Posts
- Sony PlayStation 5 Pro Specifications Confirmed, Console Arrives Before Holidays (117)
- Windows 11 Now Officially Adware as Microsoft Embeds Ads in the Start Menu (110)
- NVIDIA Points Intel Raptor Lake CPU Users to Get Help from Intel Amid System Instability Issues (106)
- AMD "Strix Halo" Zen 5 Mobile Processor Pictured: Chiplet-based, Uses 256-bit LPDDR5X (101)
- US Government Wants Nuclear Plants to Offload AI Data Center Expansion (98)
- AMD's RDNA 4 GPUs Could Stick with 18 Gbps GDDR6 Memory (88)
- Developers of Outpost Infinity Siege Recommend Underclocking i9-13900K and i9-14900K for Stability on Machines with RTX 4090 (85)
- Windows 10 Security Updates to Cost $61 After 2025, $427 by 2028 (84)