 2
2
EVGA Bronze 500 W Review
Efficiency, Temperatures & Noise »Test Setup
All measurements were performed using two Chroma 6314A mainframes equipped with the following electronic loads: six 63123A [350 W each], one 63102A [100 W x2], and one 63101A [200 W]. The aforementioned equipment is able to deliver 2500 W of load, and all loads are controlled by a custom-made software. We also used a Picoscope 3424 oscilloscope, a Picotech TC-08 thermocouple data logger, a Fluke 175 multimeter, and a Yokogawa WT210 power meter. We also included a wooden box, which, along with some heating elements, was used as a hot box. Finally, we had at our disposal four more oscilloscopes (Rigol 1052E and VS5042, Stingray DS1M12, and a second Picoscope 3424), and a CEM DT-8852 sound level meter. In this article, you will find more details about our equipment and the review methodology we follow. Finally, we conduct all of our tests at 40°C-45°C ambient in order to simulate with higher accuracy the environment seen inside a typical system, with 40°C-45°C being derived from a standard ambient assumption of 23°C and 17°C-22°C being added for the typical temperature rise within a system.Primary Rails Voltage Regulation
The following charts show the voltage values of the main rails, recorded over a range from 60 W to the maximum specified load, and the deviation (in percent) for the same load range.


5VSB Regulation
The following chart shows how the 5VSB rail deals with the load we throw at it.

Hold-up Time
The hold-up time is a very important characteristic of a PSU and represents the amount of time, usually measured in milliseconds, that a PSU can maintain output regulations as defined by the ATX spec without input power. In other words, it is the amount of time the system can continue to run without shutting down or rebooting during a power interruption. The ATX spec sets the minimum hold-up time to 16 ms with the maximum continuous output load. In the following screenshot, the blue line is the mains signal and the yellow line is the "Power Good" signal. The latter is de-asserted to a low state when any of the +12V, 5V, or 3.3V output voltages fall below the undervoltage threshold, or after the mains power has been removed for a sufficiently long time to guarantee that the PSU cannot operate anymore.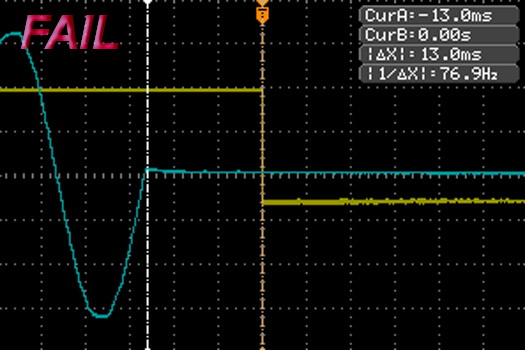
The small hold-up cap didn't allow the PSU to achieve the minimum allowed hold-up time. These caps don't come cheap so companies prefer to use small ones, especially in budget units.
Inrush Current
Inrush current or switch-on surge refers to the maximum, instantaneous input-current drawn by an electrical device when first turned on. Because of the charging current of the APFC capacitor(s), PSUs produce large inrush-current right as they are turned on. Large inrush current can cause the tripping of circuit breakers and fuses and may also damage switches, relays and bridge rectifiers; as a result, the lower the inrush current of a PSU right as they are turned on, the better.
This unit's inrush current was very low because of the small hold-up cap responsible for its failure in the previous test. This is a good example of even a bad thing bringing about something good.
Voltage Regulation and Efficiency Measurements
The first set of tests revealed the stability of the voltage rails and the efficiency of the 500B. The applied load was equal to (approximately) 20%, 40%, 50%, 60%, 80%, 100%, and 110% of the maximum load that the PSU can handle. We conducted two additional tests. In the first test, we stressed the two minor rails (5V and 3.3V) with a high load while the load at +12V was only 0.10 A. This test reveals whether the PSU is Haswell ready or not. In the second test, we dialed the maximum load the +12V rail could handle while the load on the minor rails was minimal.| Voltage Regulation & Efficiency Testing Data EVGA 500B | ||||||||||
|---|---|---|---|---|---|---|---|---|---|---|
| Test | 12 V | 5 V | 3.3 V | 5VSB | Power (DC/AC) | Efficiency | Fan Speed | Fan Noise | Temp (In/Out) | PF/AC Volts |
| 20% Load | 6.463A | 1.983A | 1.991A | 1.004A | 99.77W | 83.82% | 1176 RPM | 40.8 dBA | 39.76°C | 0.924 |
| 12.098V | 5.042V | 3.308V | 4.975V | 119.03W | 42.58°C | 230.2V | ||||
| 40% Load | 13.317A | 3.981A | 4.016A | 1.210A | 199.67W | 86.49% | 1448 RPM | 43.7 dBA | 40.56°C | 0.963 |
| 12.054V | 5.017V | 3.284V | 4.948V | 230.87W | 43.89°C | 230.1V | ||||
| 50% Load | 16.645A | 4.984A | 5.043A | 1.620A | 249.67W | 86.44% | 1613 RPM | 46.4 dBA | 41.65°C | 0.971 |
| 12.030V | 5.007V | 3.270V | 4.928V | 288.83W | 45.22°C | 230.2V | ||||
| 60% Load | 19.987A | 6.000A | 6.080A | 2.035A | 299.70W | 86.19% | 1773 RPM | 49.1 dBA | 42.92°C | 0.976 |
| 12.005V | 4.996V | 3.256V | 4.906V | 347.74W | 46.99°C | 230.2V | ||||
| 80% Load | 26.883A | 8.036A | 8.176A | 2.459A | 399.64W | 85.50% | 1836 RPM | 50.2 dBA | 44.47°C | 0.983 |
| 11.952V | 4.974V | 3.227V | 4.872V | 467.42W | 49.22°C | 230.2V | ||||
| 100% Load | 34.502A | 9.043A | 9.273A | 3.102A | 499.54W | 84.54% | 1836 RPM | 50.2 dBA | 46.19°C | 0.987 |
| 11.879V | 4.976V | 3.203V | 4.833V | 590.90W | 51.87°C | 230.1V | ||||
| 110% Load | 38.838A | 9.034A | 9.292A | 3.106A | 549.50W | 84.08% | 1836 RPM | 50.2 dBA | 46.40°C | 0.988 |
| 11.839V | 4.982V | 3.196V | 4.826V | 653.55W | 52.35°C | 230.1V | ||||
| Crossload 1 | 0.095A | 14.013A | 14.004A | 0.000A | 111.33W | 76.59% | 1858 RPM | 50.4 dBA | 43.27°C | 0.937 |
| 12.482V | 4.622V | 3.240V | 4.946V | 145.35W | 47.06°C | 230.3V | ||||
| Crossload 2 | 39.969A | 1.001A | 1.002A | 1.002A | 481.60W | 84.98% | 1824 RPM | 50.1 dBA | 46.55°C | 0.986 |
| 11.715V | 5.172V | 3.253V | 4.914V | 566.72W | 52.67°C | 230.1V | ||||
Apr 24th, 2024 21:58 EDT
change timezone
Latest GPU Drivers
New Forum Posts
- I am getting artifacting when I change Windows security settings. Is my GPU failing, or is this just a Windows issue? (10)
- Is there a technical reason that Windows 11 doesn't have built into it battery charge limitation? (42)
- (Anti) SFF fun house (347)
- Cinebench crashed my PC. My Wi-Fi stopped working, and I keep getting a "Please wait" screen when I boot up my PC. (30)
- The TPU UK Clubhouse (24783)
- Sharing experience with MSI RTX 3070 vBIOS update to enable Resizable Bar with MB Z490 (2)
- Share your AIDA 64 cache and memory benchmark here (2915)
- Will a RTX 4070 TI super bottleneck a Ryzen 9 7950X3D? (58)
- The best *budget* ATX PC case on the market? (24)
- GTX 1070 Ti - TDP Issues - Always Power Throttling (4)
Popular Reviews
- Fractal Design Terra Review
- Thermalright Phantom Spirit 120 EVO Review
- Corsair 2000D Airflow Review
- Minisforum EliteMini UM780 XTX (AMD Ryzen 7 7840HS) Review
- ASUS GeForce RTX 4090 STRIX OC Review
- NVIDIA GeForce RTX 4090 Founders Edition Review - Impressive Performance
- ASUS GeForce RTX 4090 Matrix Platinum Review - The RTX 4090 Ti
- MSI GeForce RTX 4090 Suprim X Review
- Gigabyte GeForce RTX 4090 Gaming OC Review
- MSI GeForce RTX 4090 Gaming X Trio Review
Controversial News Posts
- Sony PlayStation 5 Pro Specifications Confirmed, Console Arrives Before Holidays (116)
- NVIDIA Points Intel Raptor Lake CPU Users to Get Help from Intel Amid System Instability Issues (106)
- AMD "Strix Halo" Zen 5 Mobile Processor Pictured: Chiplet-based, Uses 256-bit LPDDR5X (101)
- US Government Wants Nuclear Plants to Offload AI Data Center Expansion (98)
- Windows 10 Security Updates to Cost $61 After 2025, $427 by 2028 (84)
- Developers of Outpost Infinity Siege Recommend Underclocking i9-13900K and i9-14900K for Stability on Machines with RTX 4090 (84)
- TechPowerUp Hiring: Reviewers Wanted for Motherboards, Laptops, Gaming Handhelds and Prebuilt Desktops (78)
- AMD's RDNA 4 GPUs Could Stick with 18 Gbps GDDR6 Memory (73)