 32
32
EVGA SuperNOVA NEX1500 Classified 1500 W Review
Transient Response Tests »Test Setup
All measurements were performed using ten electronic loads (seven Array 3711A [300 W each] and three Array 3710A [150 W each]), which are able to deliver over 2500 W of load and are controlled by a custom-made software. We also used a Picoscope 3424 oscilloscope, a Picoscope TC-08 thermocouple data logger, a Fluke 175 multimeter, and an Instek GPM-8212 power meter. We also included a wooden box which, along with some heating elements, was used as a hot box. Finally, we had at our disposal four more oscilloscopes (Rigol 1052E and VS5042, Stingray DS1M12, and a second Picoscope 3424) and a CEM DT-8852 sound level meter. In this article, you will find more details about our equipment and the review methodology we follow. We conduct all of our tests at 40 - 45°C ambient in order to simulate with higher accuracy the environment seen inside a typical system, with 40 - 45°C being derived from a standard ambient assumption of 23°C and 17 - 22°C being added for the typical temperature rise within a system.Voltage Regulation Charts
The following charts show the voltage values of the main rails, recorded over a range of 60W to the maximum specified load, and the deviation (in percent) for the same load range.


5VSB Regulation Chart
The following chart shows how the 5VSB rail deals with the load we throw at it.

Efficiency Chart
In this chart you will find the efficiency of the NEX1500 at low loads and at loads equal to 20-100% of the PSU’s maximum rated load.
Fan RPM & Delta Temperature
In the following chart, the cooling fan's speed (RPMs), along with the delta difference between input and output temperature, are illustrated. The following results were obtained at 25C°-30C° ambient.
Voltage Regulation and Efficiency Measurements
The first set of tests revealed the stability of the voltage rails and the efficiency of the NEX1500. The applied load was equal to (approximately) 20%, 40%, 50%, 60%, 80%, and 100% of the maximum load that the PSU can handle. In addition, we conducted two more tests. In the first test, we stressed the two minor rails (5V and 3.3V) with a high load, while the load at +12V was only 2 A, and, in the second test, we dialed the maximum load that the +12V rail could handle, while the load on the minor rails was minimal.| Voltage Regulation & Efficiency Testing Data EVGA NEX1500 | |||||||||
|---|---|---|---|---|---|---|---|---|---|
| Test | 12 V | 5 V | 3.3 V | 5VSB | Power (DC/AC) | Efficiency | FAN RPMS | Temp (In/Out) | PF/AC Volts |
| 20% Load | 22.690A | 1.974A | 1.969A | 0.996A | 300.00W (260W) | 92.17% (87%) | 950 | 41.8°C (42.0°C) | 0.810 |
| 12.268V (12.21V) | 5.084V (5.02V) | 3.353V (3.32V) | 5.020V | 325.50W (313W) | 45.1°C | 230.9V | |||
| 40% Load | 45.869A | 3.991A | 3.991A | 1.202A | 600.00W (574W) | 92.81% (93%) | 1020 | 43.1°C (42.0°C) | 0.877 |
| 12.223V (12.21V) | 5.039V (5.02V) | 3.319V (3.33V) | 4.984V | 646.50W (656W) | 47.8°C | 231.4V | |||
| 50% Load | 57.449A | 5.018A | 5.026A | 1.622A | 750.00W (734W) | 92.31% (92%) | 1186 | 44.4°C (42.1°C) | 0.894 |
| 12.189V (12.21V) | 5.016V (5.01V) | 3.300V (3.33V) | 4.930V | 812.50W (820W) | 49.5°C | 231.9V | |||
| 60% Load | 69.194A | 6.052A | 6.071A | 2.044A | 900.00W (895W) | 91.70% (92%) | 1400 | 44.9°C (43.2°C) | 0.911 |
| 12.138V (12.21V) | 4.992V (5.01V) | 3.282V (3.33V) | 4.886V | 981.50W (1003W) | 50.2°C | 230.1V | |||
| 80% Load | 92.650A | 8.156A | 8.214A | 2.482A | 1200.15W (1226W) | 89.73% (91%) | 2460 | 45.9°C (44.1°C) | 0.934 |
| 12.102V (12.20V) | 4.938V (5.01V) | 3.241V (3.34V) | 4.837V | 1337.50W (1358W) | 51.5°C | 230.3V | |||
| 100% Load | 116.654A | 9.270A | 9.354A | 4.274A | 1500.20W (1548W) | 87.63% (90%) | 4448 | 48.9°C (44.4°C) | 0.932 |
| 12.042 (12.21V) | 4.901V (5.01V) | 3.209V (3.34V) | 4.680V | 1712.00W (1840W) | 55.2°C | 228.0V | |||
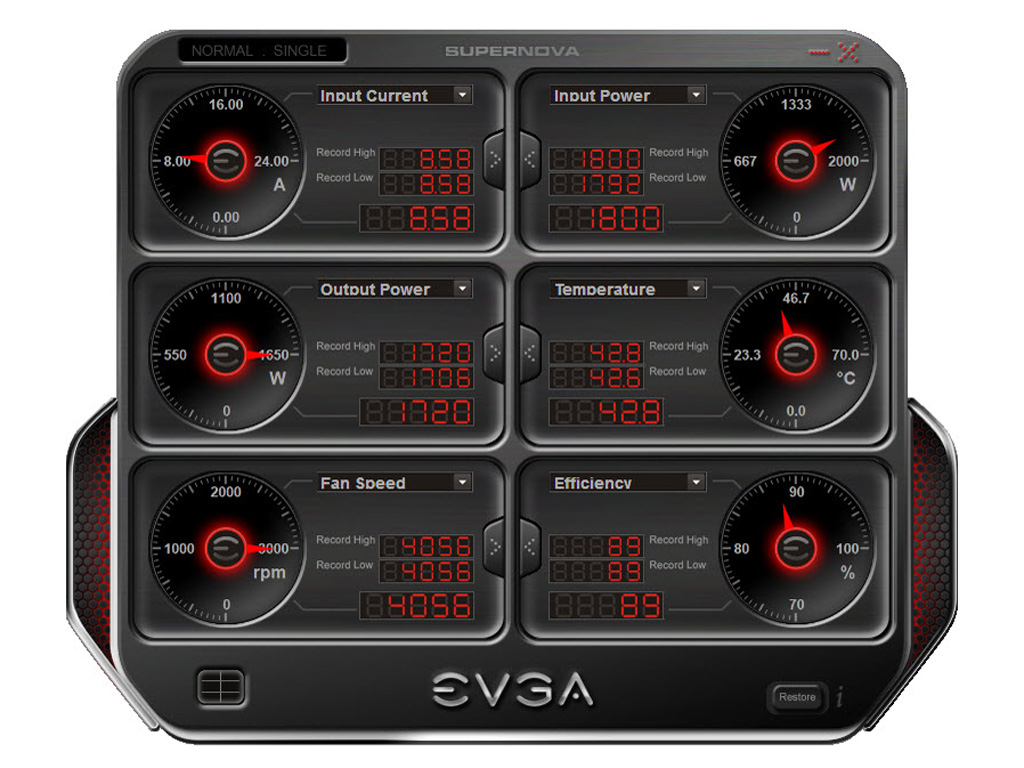
| 110% Load | 129.477A | 9.278A | 9.389A | 4.274A | 1650.70W (1720W) | 86.83% (89%) | 4448 | 46.9°C (42.8°C) | 0.945 |
| 12.013V (12.21V) | 4.886V (5.00V) | 3.191V (3.34V) | 4.680V | 1901.00W (1800W) | 53.5°C | 223.0V | |||
| Crossload 1 | 1.998A | 18.012A | 18.000A | 0.500A | 176.62W (148W) | 79.37% (45%) | 1032 | 45.2°C (46.0°C) | 0.755 |
| 12.292V (12.22V) | 4.977V (5.00V) | 3.328V (3.39V) | 5.029V | 222.53W (211W) | 50.6°C | 230.8V | |||
| Crossload 2 | 123.815A | 1.000A | 1.000A | 1.000A | 1503.83W (1568W) | 88.01% (89%) | 4448 | 48.7°C (44.7°C) | 0.930 |
| 12.040V (12.21V) | 4.959V (5.01V) | 3.227V (3.31V) | 4.913V | 1708.72W (1798W) | 55.1°C | 229.2V | |||
Before we start the analysis of this test session's results, we should note that the numbers in parenthesis show the readings that we took with the EVGA SuperNOVA program.
Efficiency starts very high with 20% of max rated capacity and stays above 90% up to 60% load. It drops a little below 90% at 1200 W and registers a fairly decent 87.6% reading at full load. 87.6% may look low but the ambient inside the hotbox was almost 49°C at the time, something that surely made things much worse. The PSU also managed to deliver 1650 W with ease with nearly 47°C ambient and kept a good voltage regulation at +12V. The minor rails, on the other hand, didn't register tight voltage regulation. We also spotted a problem at 5VSB during the full load and the 110% load tests. Some of you may argue that this scenario, with the full load at 5VSB during normal operation, is highly unrealistic, but we would still like to see this rail keep a normal voltage regulation. Most PSUs we have tested so far did.
Another thing that made an impression was the low PF readings throughout all load levels. Apparently, the APFC circuit isn't optimally tuned so PF is low, especially for a Gold unit. The fan noise was really loud during the full and 110% load tests since it spun at 4450 RPMs. The fan is much quieter, but still audible, even with 1000 or lower RPM, at lower loads. It does emit an annoying high-pitch sound. We should note here that we used the silent fan profile, available through the SuperNOVA software, during all test sessions.
The measured voltage readings by SuperNOVA are not accurate, and the same applies to half of its efficiency readings. Strangely enough, the efficiency readings by the software do not match the recorded DC/AC power measurements; the corresponding function apparently needs to be revised. In other words, SuperNOVA fails to provide accurate measurements in most cases.
Efficiency at Low Loads
In the next tests, we measured the efficiency of the NEX1500 at loads much lower than 20% of its maximum rated load (the lowest load that the 80 Plus Standard measures). The loads that we dialed were 40, 60, 80, and 100 W (for PSUs with over 500W of capacity). This is important for settings where the PC is in idle mode with power saving turned on.| Efficiency at Low Loads EVGA NEX1500 | |||||||
|---|---|---|---|---|---|---|---|
| Test # | 12 V | 5 V | 3.3 V | 5 VSB | Power (DC/AC) | Efficiency | PF/AC Volts |
| 1 | 1.813A | 1.966A | 1.957A | 0.198A | 40.00W | 70.61% | 0.195 |
| 12.321V | 5.108V | 3.378V | 5.100V | 56.65W | 231.3V | ||
| 2 | 3.356A | 1.966A | 1.959A | 0.394A | 60.00W | 76.83% | 0.450 |
| 12.321V | 5.106V | 3.376V | 5.073V | 78.10W | 231.8V | ||
| 3 | 4.897A | 1.971A | 1.960A | 0.591A | 80.00W | 79.56% | 0.490 |
| 12.319V | 5.105V | 3.374V | 5.073V | 100.55W | 230.4V | ||
| 4 | 6.440A | 1.971A | 1.961A | 0.792A | 100.00W | 81.70% | 0.534 |
| 12.318V | 5.103V | 3.372V | 5.047V | 122.40W | 229.9V | ||
At low loads, efficiency is decent to say the least, considering the huge capacity of this unit. Even with a mere 40 W load, the PSU manages to register an over 70% reading, with 80 W being a breath away from 80%, and 100 W load surpassing the aforementioned mark quite easily.
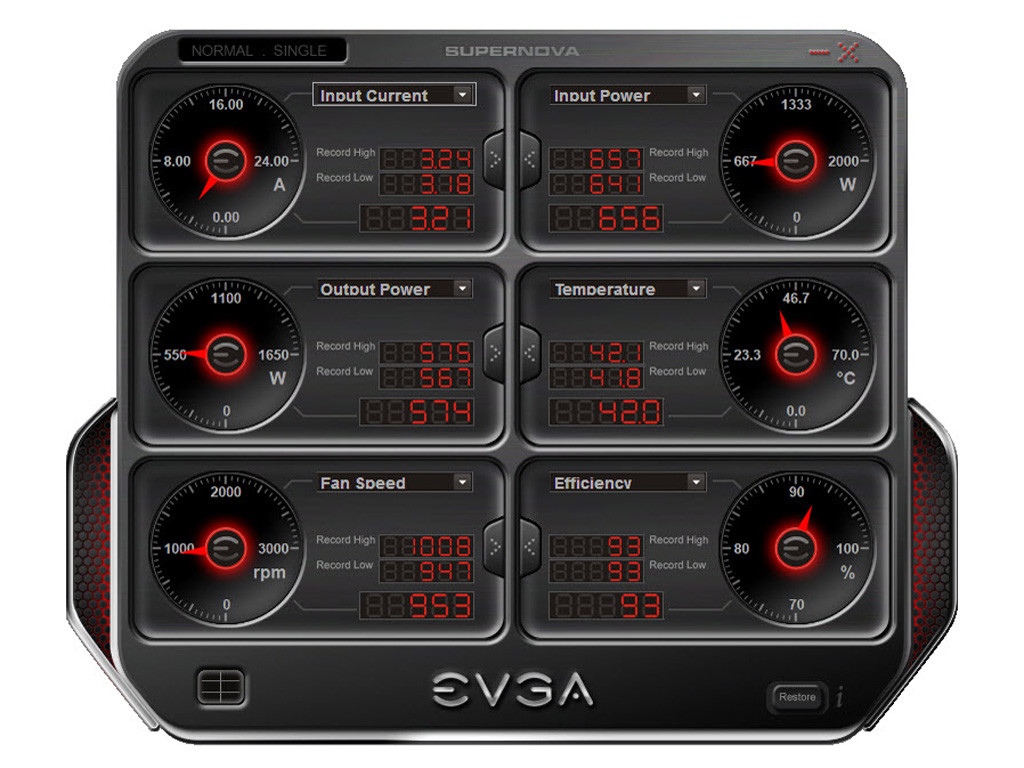
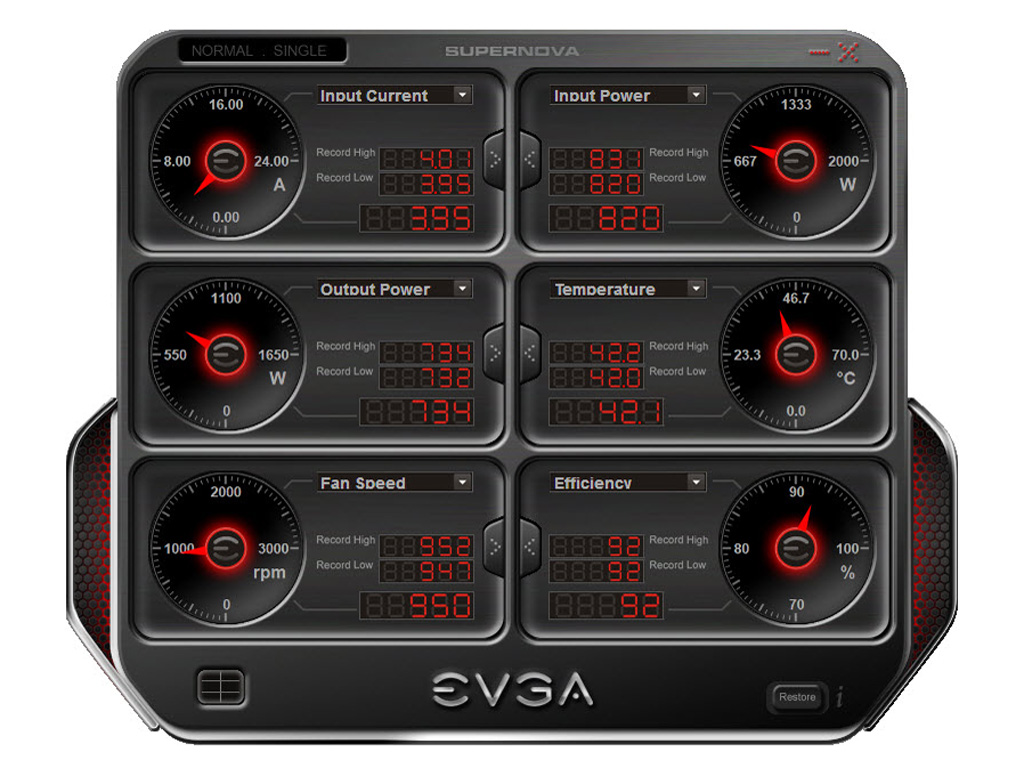
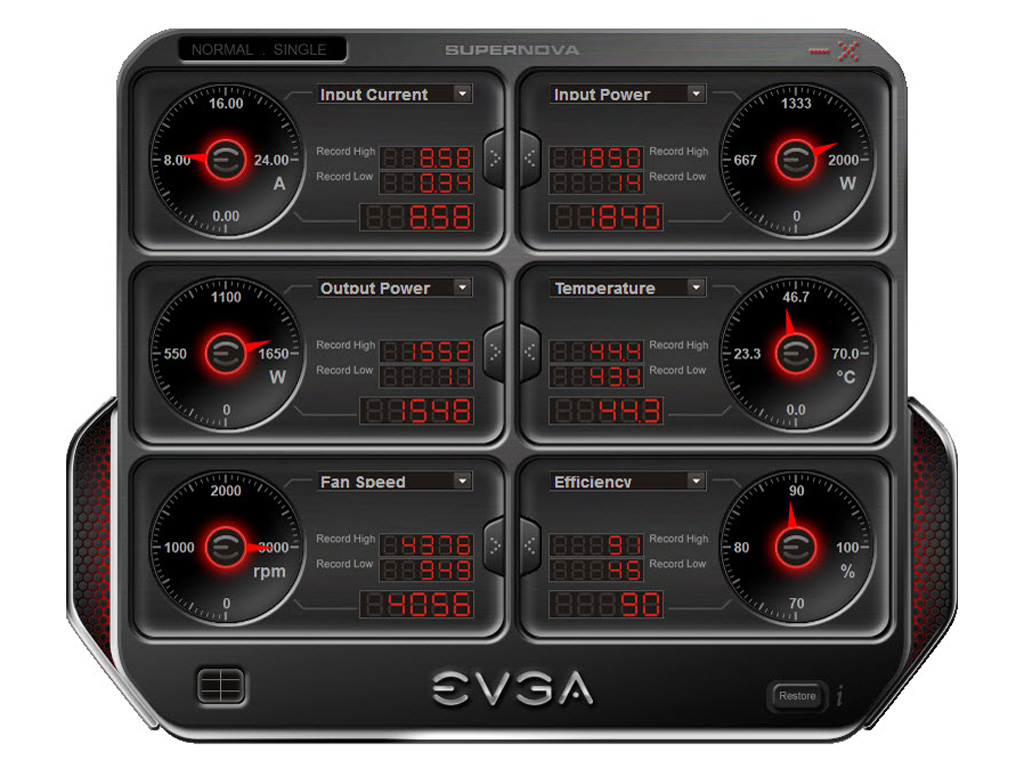
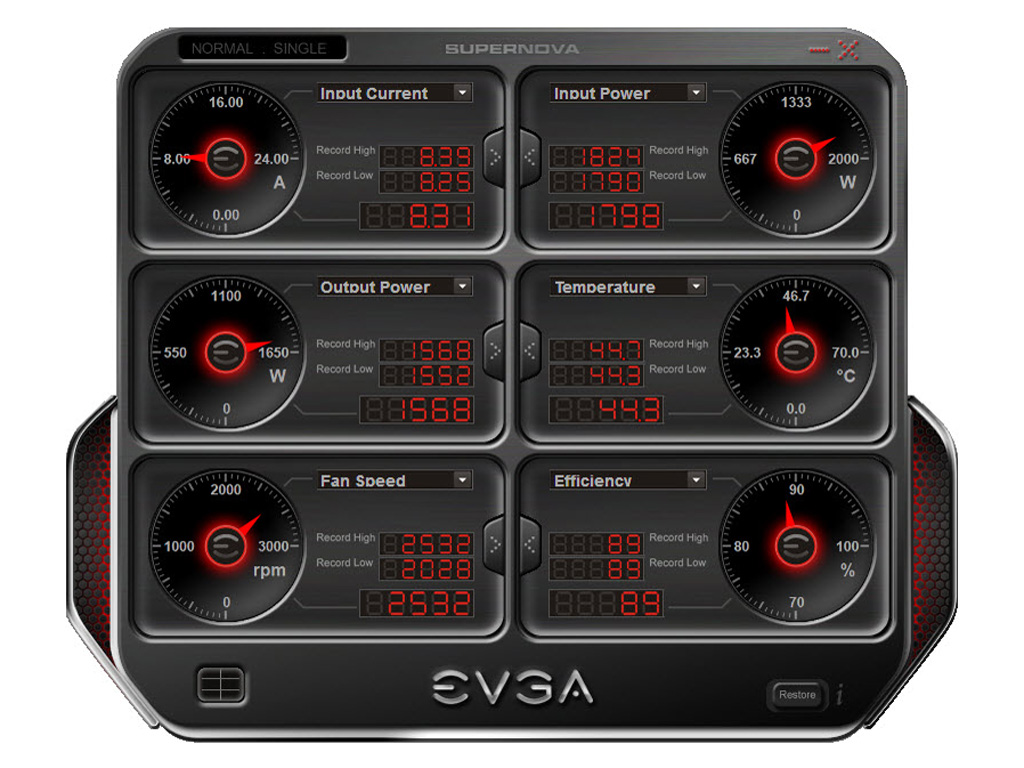
Monitoring Software Screenshots
Several screenshots of the monitoring software, which we took during the above test sessions, can be found below. The order of the screenshots is the same with the order of the tests shown on the previous two tables (20% load test — Cross-load 2, low loads efficiency test #1 — test #4).


5VSB Efficiency
The ATX spec states that the 5VSB standby supply's efficiency should be as high as possible and recommends 50% or higher efficiency with 100mA of load, 60% or higher with 250mA of load, and 70% or higher with 1A or more of load.We will take four measurements: three at 100, 250, and 1000 mA, and one with the full load that the 5VSB rail can handle.
| 5VSB Efficiency EVGA NEX1500 | ||||
|---|---|---|---|---|
| Test # | 5VSB | Power (DC/AC) | Efficiency | PF/AC Volts |
| 1 | 0.100A | 0.51W | 8.64% | 0.066 |
| 5.100V | 5.90W | 231.3V | ||
| 2 | 0.250A | 1.28W | 18.69% | 0.078 |
| 5.100V | 6.85W | 230.0V | ||
| 3 | 1.000A | 5.05W | 44.49% | 0.129 |
| 5.047V | 11.35W | 230.1V | ||
| 4 | 4.000A | 19.36W | 62.45% | 0.301 |
| 4.841V | 31.00W | 230.9V | ||
Efficiency at 5VSB is absolutely terrible and you will find the reason behind this performance in the following tests. Apparently, the 5VSB rail is this PSU's weak link.
Power Consumption in Idle & Standby
In the table below, you will find the power consumption and the voltage values of all rails (except -12V) when the PSU is in idle mode (powered on but without any load on its rails) and the power consumption when the PSU is in standby mode (without any load at 5VSB).| Idle / Standby EVGA NEX1500 | ||||||
|---|---|---|---|---|---|---|
| Mode | 12 V | 5 V | 3.3 V | 5VSB | Power (AC) | PF/AC Volts |
| Idle | 12.327V | 5.100V | 3.393V | 5.100V | 15.55W | 0.166 |
| 230.8V | ||||||
| Standby | 5.25W | 0.060 | ||||
| 230.5V | ||||||
The PSU totally fails to meet the ErP Lot 6 2010 requirements since it consumes five times more than the 1 W limit. As it seems, they forgot this compliance, which is essential for all products sold in the EU. High phantom power is also responsible for the horrific efficiency of the 5VSB rail. EVGA should look into this matter and try to find a way to fix it in a future revision of this PSU.
Apr 26th, 2024 21:22 EDT
change timezone
Latest GPU Drivers
New Forum Posts
- Rare GPUs / Unreleased GPUs (1877)
- looking to build a new system and im considering asrock brand but i have some doubts/concerns. (15)
- AAF Optimus DCH Audio Modded Driver for Windows 10/11 - For ALL HDAUDIO Enumerator Chips (652)
- Help me identify rx 580 card ? (0)
- Strange system crashes out of nowhere help (9)
- What phone you use as your daily driver? And, a discussion of them. (1494)
- Secure boot already open help (11)
- TechPowerUp Screenshot Thread (MASSIVE 56K WARNING) (4213)
- The Official Linux/Unix Desktop Screenshots Megathread (705)
- Alphacool CORE 1 CPU block - bulging with danger of splitting? (32)
Popular Reviews
- Ugreen NASync DXP4800 Plus Review
- Quick Look: MOONDROP CHU 2 Budget In-Ear Monitors
- HYTE THICC Q60 240 mm AIO Review
- MOONDROP x Crinacle DUSK In-Ear Monitors Review - The Last 5%
- CeBIT 2008: Akasa Review
- CeBIT 2008: Cyber E Sport Review
- Thermalright Phantom Spirit 120 EVO Review
- Gigabyte GeForce RTX 4070 Ti Super Gaming OC Review
- Upcoming Hardware Launches 2023 (Updated Feb 2024)
- Alienware Pro Wireless Gaming Keyboard Review
Controversial News Posts
- Windows 11 Now Officially Adware as Microsoft Embeds Ads in the Start Menu (135)
- Sony PlayStation 5 Pro Specifications Confirmed, Console Arrives Before Holidays (117)
- NVIDIA Points Intel Raptor Lake CPU Users to Get Help from Intel Amid System Instability Issues (106)
- AMD "Strix Halo" Zen 5 Mobile Processor Pictured: Chiplet-based, Uses 256-bit LPDDR5X (103)
- US Government Wants Nuclear Plants to Offload AI Data Center Expansion (98)
- AMD's RDNA 4 GPUs Could Stick with 18 Gbps GDDR6 Memory (95)
- Developers of Outpost Infinity Siege Recommend Underclocking i9-13900K and i9-14900K for Stability on Machines with RTX 4090 (85)
- Windows 10 Security Updates to Cost $61 After 2025, $427 by 2028 (84)