TPU PSU Performance Rating Methodology Explained |
|
|
Author: crmaris
Date: 2011-11-18 15:18:03
|
|
Voltage Regulation
In an ideal world a PSU would maintain a constant voltage level regardless load, but in real life scenarios there is always a voltage drop on each rail as the load increases. In our tests voltage regulation shows the difference between the initial voltage readings with 60W of load (and not with no load at all since many PSUs don't work well with no load on their rails and some others feature no load protection) and the voltage readings on all rails with full load.We calculate the voltage regulation rating of all ratings using the following equation:

In the formula above, you can see that 5V and 3.3V have a lower weighting factor and 5VSB the lowest. This is because the 12V line is by far the most important in a system and its stability is crucial. We use the same system in the other formulas below, too.
Ripple Voltage
Ripple are the AC fluctuations (periodic) and noise (random) found in the DC rails of a PSU. We take the ripple readings of all rails from the 100% load test and combine them in equation shown below.
Advanced Transient Response
How well a power supply reacts to sudden changes in load is a very good indication of the unit's power quality. We take the higher deviation each rail registered in the two Advanced Transient Response tests we conduct in order to calculate the performance.
Turn On Transient Voltage Overshoots
Performance calculation in these tests is rather simple since we use only the rough value of the registered spike, compared to the nominal value of +12V and 5VSB rails. At +12V we use only the higher voltage overshoot and ignore the other one (if there is any of course). To give an example: if the higher registered voltage overshoot at +12V is +12.5V then the spike is 0.5V (12.5V – 12.0V) so we use this value in our equation.
Efficiency
For must users out there efficiency is one of the most important factors when they look for a new PSU. In our equation we take the mean value of efficiency readings at 20%, 50% and 100% of the unit's maximum rated capacity load, subtract it from 100 (represents the perfect 100% efficiency).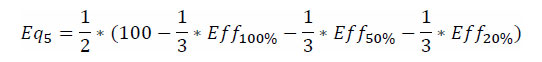
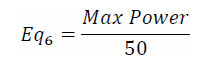
Capacity
When you directly compare the voltage regulation, efficiency or ripple readings of a 400 W unit to those of a 1500 W model then the comparison is anything but fair.For example, when looking at voltage regulation at 60 W load, the regulation range for a 400 W PSU is 340 W (= 400 W - 60 W). However, when testing a 1500 W model, it is much bigger: 1440 W (= 1500 W - 60 W). With such a huge difference it is natural that the smaller capacity unit will most likely register much better voltage regulation, or ripple. So we added a normalization that would set things right. This factor is directly derived from the rated power of each unit.
Final Performance Rating Function
Now that we have calculated all six above factors it's time to combine them to calculate the final performance rating. We take 100 as the perfect score and start subtracting results (1)-(5) and finally take into account the capacity (6)
The result of is the unit's final Performance Rating.
Performance Rating Calculation Example
For this example we will use Seasonic's flagship, the P-1000 PSU:(1) 1.41 + 0.5 x 1.43 + 0.5 x 2.24 + 0.25 x 3.33 = 4.0775
(2) 0.1 x (24 + 0.5 x 12.5 + 0.5 x 14.9 + 0.25 x 13.6) = 4.11
(3) 0.2 x (1.34 + 0.5 x 1.82 + 0.5 x 2.57 +0.25 x 2.37) = 0.8255
(4) (0+0.5) = 0.5
(5) 0.5 x (100 - 1/3 * 90.81 + 1/3 * 92.79 + 1/3 * 91.16) = 4.206667
(6) 1000 / 50 = 5
Performance Rating = 100 – 4.0775 + 4.11 + 0.8255 + 0.5 + 4.206667 + 5 = 100 – 13.569 + 5 = 91.280333
Conclusion
We hope that by now you understood the methodology we follow to calculate the performance rating of each PSU. We tried to make it as clear as possible and we are sure that the math is fairly easy to follow. Your comments are welcome!
Apr 25th, 2024 05:27 EDT
change timezone
Latest GPU Drivers
New Forum Posts
- Last game you purchased? (254)
- What phone you use as your daily driver? And, a discussion of them. (1472)
- What's your latest tech purchase? (20338)
- Meta Horizon OS (16)
- Core i5-6300U (14)
- (Anti) SFF fun house (351)
- Alphacool CORE 1 CPU block - bulging with danger of splitting? (4)
- The TPU UK Clubhouse (24786)
- Github comments used to push malware via Microsoft repo urls (3)
- Bizarre Throttlestop issue (5)
Popular Reviews
- Fractal Design Terra Review
- Thermalright Phantom Spirit 120 EVO Review
- Corsair 2000D Airflow Review
- Minisforum EliteMini UM780 XTX (AMD Ryzen 7 7840HS) Review
- ASUS GeForce RTX 4090 STRIX OC Review
- NVIDIA GeForce RTX 4090 Founders Edition Review - Impressive Performance
- ASUS GeForce RTX 4090 Matrix Platinum Review - The RTX 4090 Ti
- MSI GeForce RTX 4090 Suprim X Review
- MSI GeForce RTX 4090 Gaming X Trio Review
- Gigabyte GeForce RTX 4090 Gaming OC Review
Controversial News Posts
- Sony PlayStation 5 Pro Specifications Confirmed, Console Arrives Before Holidays (116)
- NVIDIA Points Intel Raptor Lake CPU Users to Get Help from Intel Amid System Instability Issues (106)
- AMD "Strix Halo" Zen 5 Mobile Processor Pictured: Chiplet-based, Uses 256-bit LPDDR5X (101)
- US Government Wants Nuclear Plants to Offload AI Data Center Expansion (98)
- Windows 10 Security Updates to Cost $61 After 2025, $427 by 2028 (84)
- Developers of Outpost Infinity Siege Recommend Underclocking i9-13900K and i9-14900K for Stability on Machines with RTX 4090 (84)
- Windows 11 Now Officially Adware as Microsoft Embeds Ads in the Start Menu (83)
- TechPowerUp Hiring: Reviewers Wanted for Motherboards, Laptops, Gaming Handhelds and Prebuilt Desktops (78)