 8
ADATA SD820 Portable SSD 1 TB Review - Sturdy and Lightweight
Value & Conclusion »Test Setup
| Test System Portable SSD 2026 | |
|---|---|
| Processor: | Intel Core Ultra 7 265K Arrow Lake 5.5 GHz, 8+12 cores/20 threads |
| Motherboard: | ASUS TUF Gaming Z890-PRO WiFi BIOS 2401 |
| USB Host Controller: | ASUS ThunderboltEX 5 add-on card Intel JHL9580 2-port TB5 + USB4 V2 Host |
| Memory: | 2× 16 GB DDR5-5600 |
| Storage: | ADATA XPG Mars Blade 980 2 TB PCI-Express Gen 5, NVMe 2.0 |
| Graphics: | Integrated |
| Cooling: | Thermalright Assassin X120 Refined SE |
| Power Supply: | MSI MAG A750BN 750 W ATX 2.52/16-pin 12VHPWR |
| Case: | Kolink Observatory HF Mesh Core |
| Operating System: | Windows 11 Pro 25H2 VBS enabled (Windows 11 default) |
CrystalDiskMark
The most popular storage benchmark, CDM highlights maximum performance levels on offer.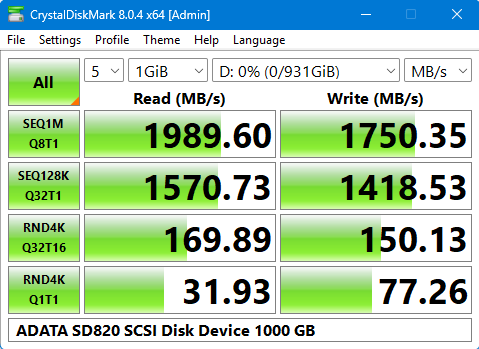
Sequential Throughput
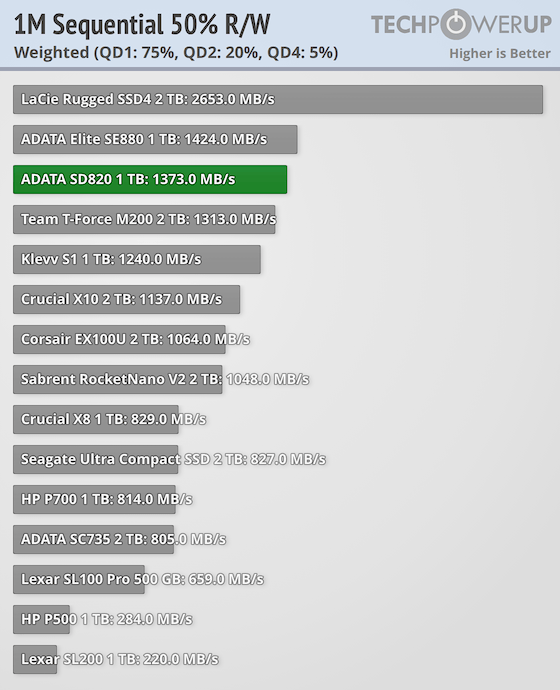
For portable storage devices, most file transfers are typically sequential in nature. This section provides insight into how the drive performs under various sequential read, sequential write, and sequential mixed (read/write) workloads. We test the drive at multiple queue depths, ranging from 1 to 128. In addition to sequential read and write tests, we also evaluate a mixed workload that randomly issues read or write requests with equal probability.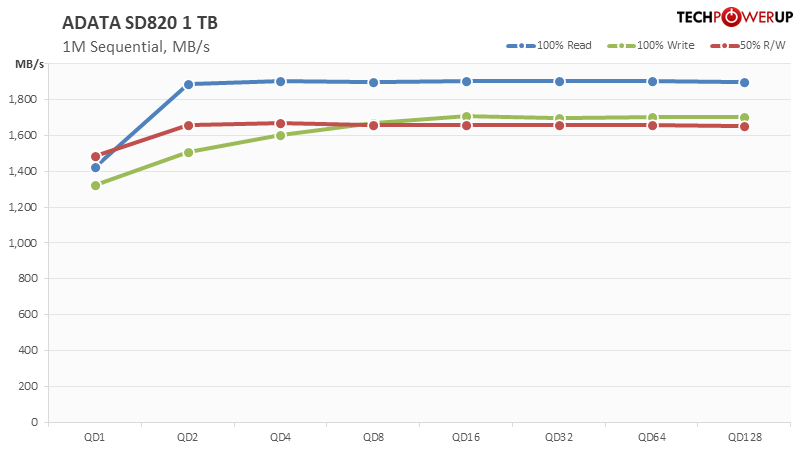
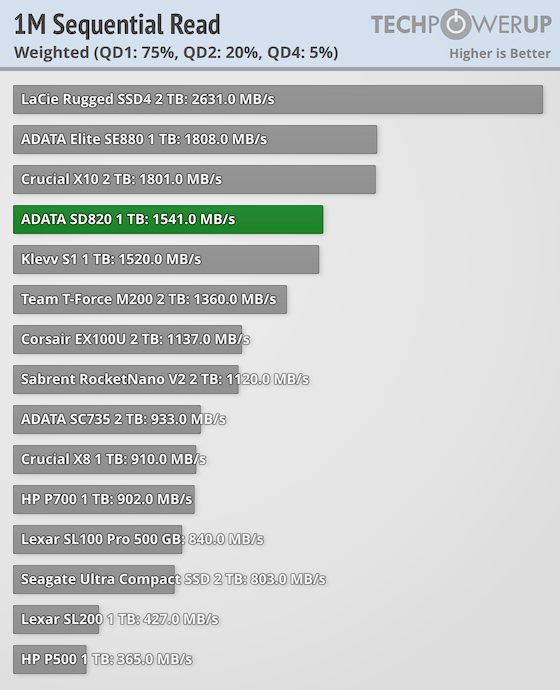
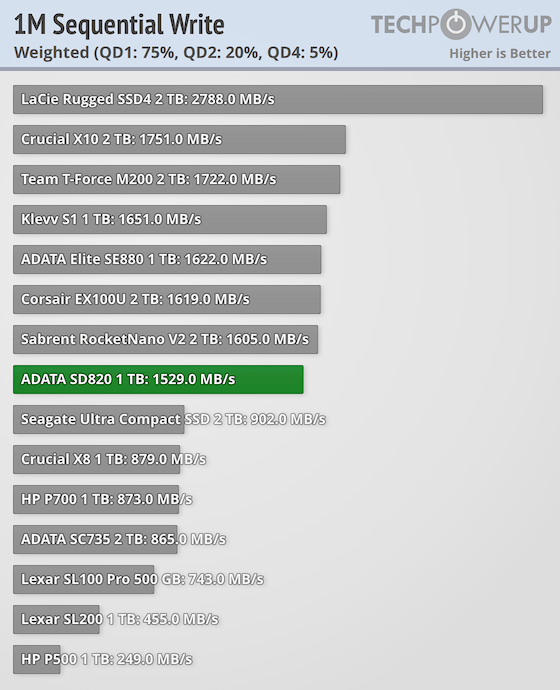
These bar graphs show how the drive compares to various competing offers. We report a combined and weighted score that's designed to represent real-life consumer workloads effectively. The weighting factors were chosen to reflect typical low queue depth loads, rather than the drive's absolute maximum performance numbers, which have little impact on real-world usage.
Random Access Performance
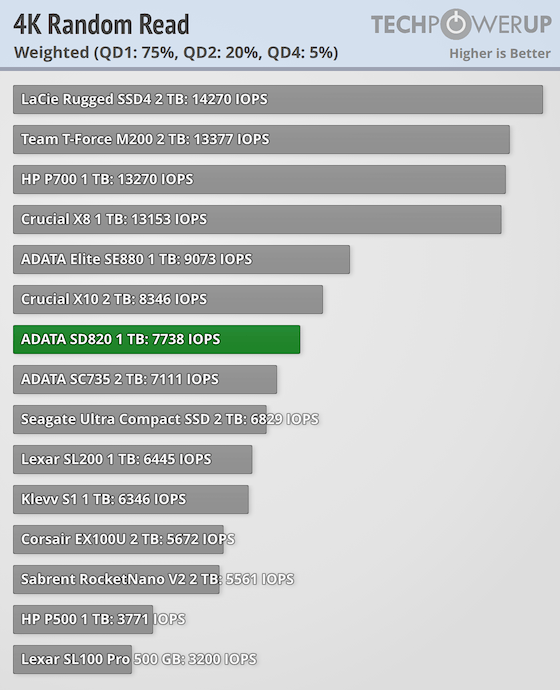
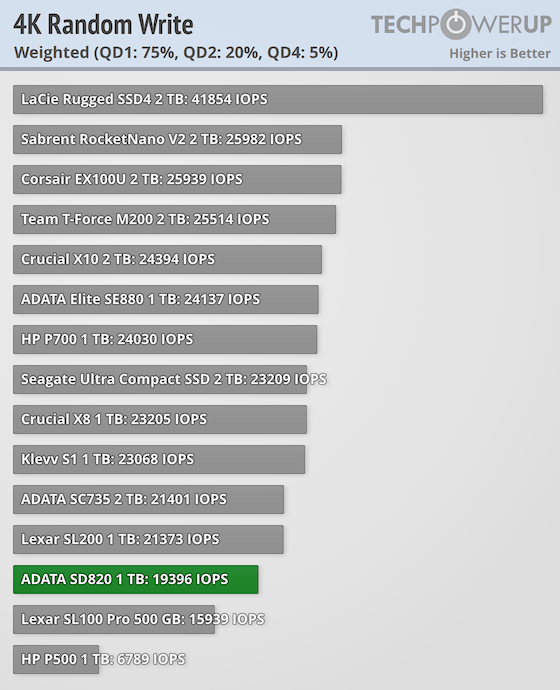
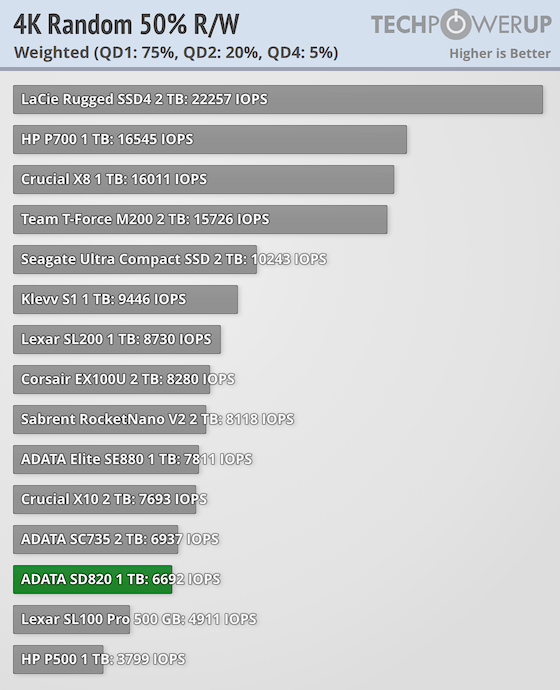
While random access performance is less critical for portable SSDs than for internal ones, it becomes important in scenarios where applications or operating systems are run directly from the drive, or during large backup and restore operations. In this section, we test 4K random I/O, which transfers small chunks of data spread across an 8 GB workspace. As before, a third data point is included for a mixed workload that randomly issues read or write requests with equal probability. Please note that the vertical axis uses non-linear scaling to improve visibility of the low queue depth values—which are more relevant for daily workloads.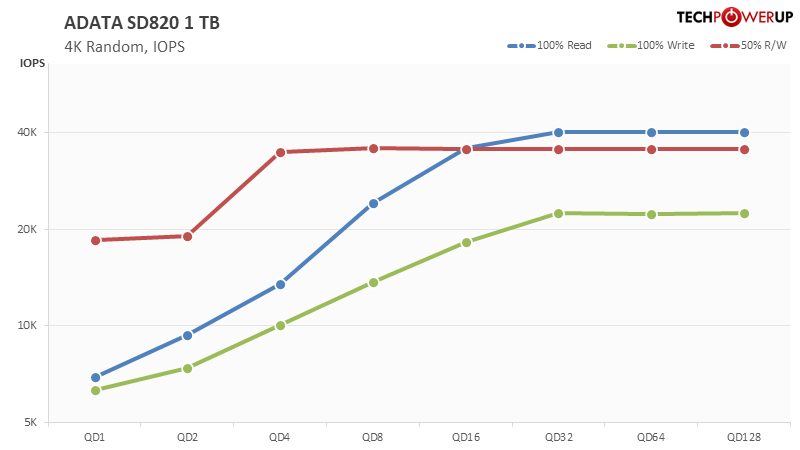
Here's how the drive compares to rivals.
Sustained Write Performance
Portable SSDs are a segment above USB flash drives, because they are expected to provide performance closer to internal SSDs. Sustained write performance is probably the most important test series, as it highlights how the drive performs with large write operations spanning the entire disk. Real-world use-cases include whole system backups and imaging of internal SSDs. Your internal SSD is able to sustain reads at thousands of MB/s throughout its user space, but can your portable SSD keep up?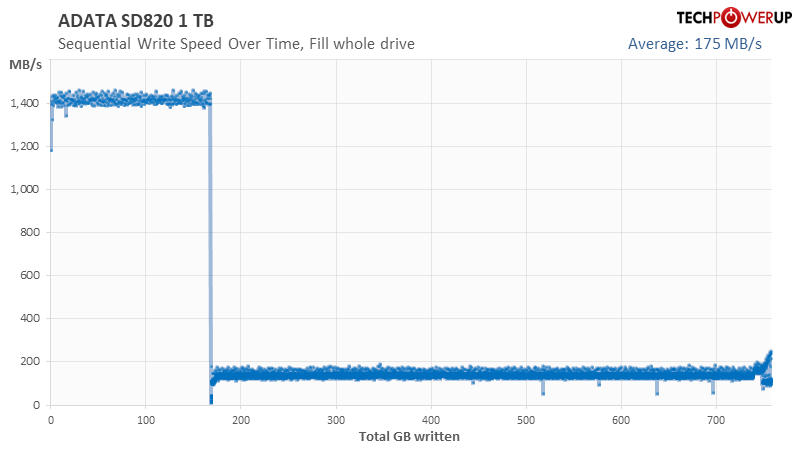
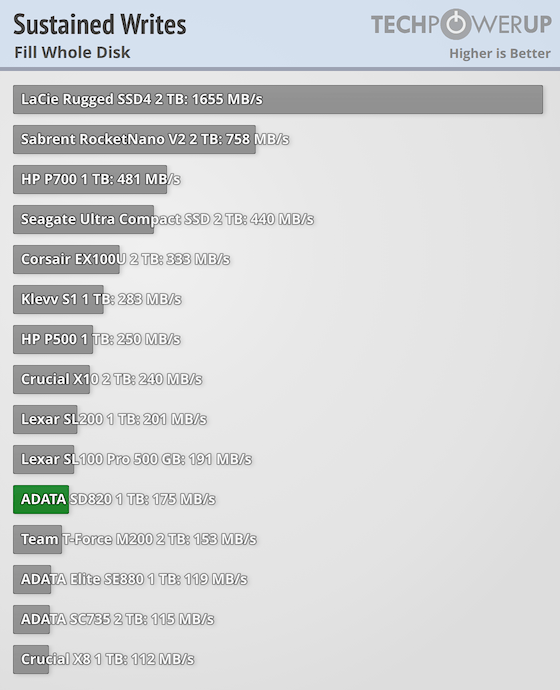
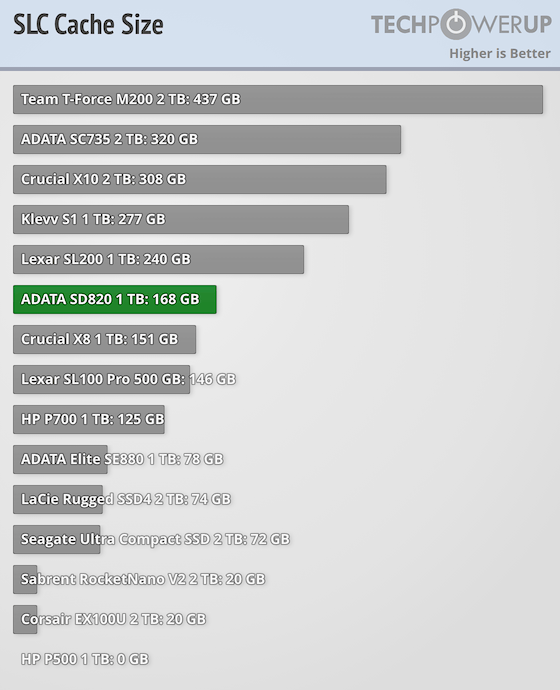
Based on the above sustained write graphs, we are able to pinpoint the SLC cache size. Although today's portable SSDs ship with QLC or TLC NAND flash, they are able to treat a portion of their NAND flash area as SLC for the highest possible write performance, and only upon exhausting this area, begin to treat the drive as its native flash type. The graph below compares SLC cache sizes.
Relative Performance
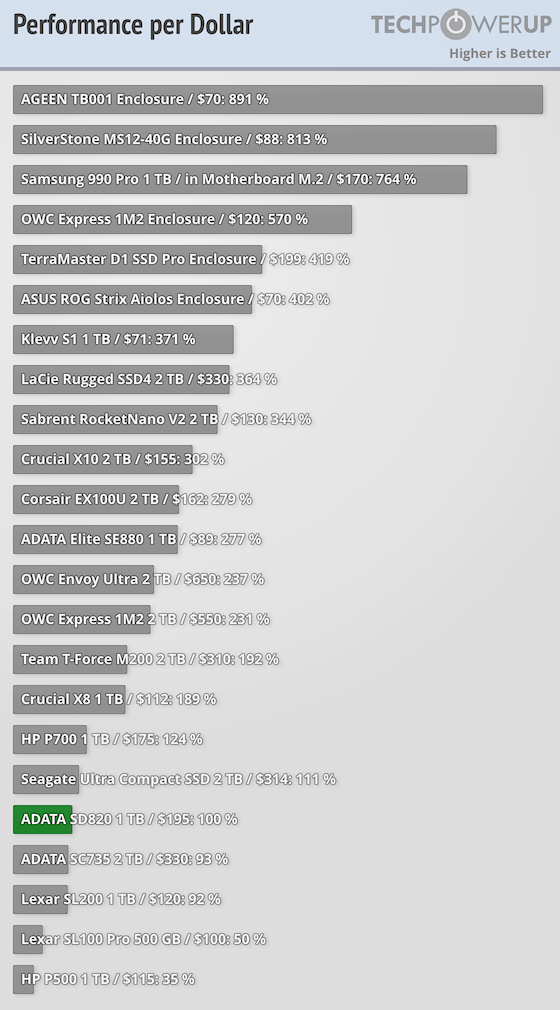
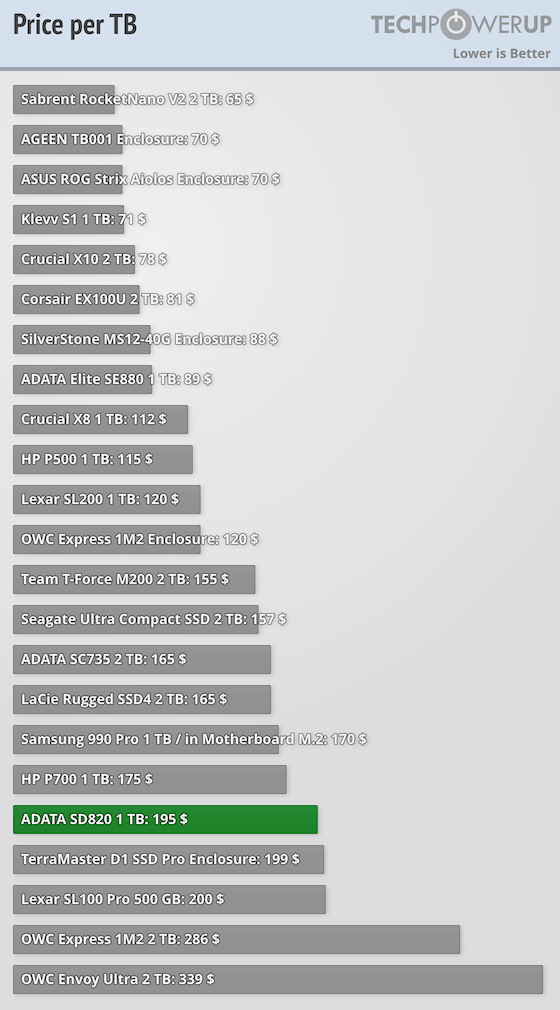
The graphs below show how the drive compares to others, spanning 40 Gbps, 20 Gbps, and 10 Gbps drives we have in our collection, and what kind of performance per Dollar we're looking at. Admittedly, some of these drives are old, dating back a few years, we used their last available online prices.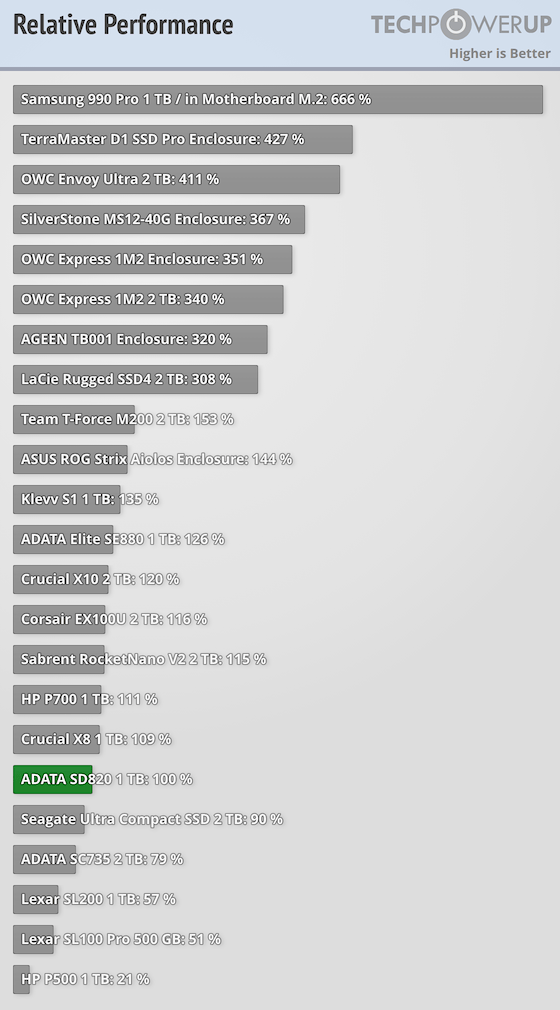
Nov 18th, 2026 13:38 PST
change timezone
Latest GPU Drivers
New Forum Posts
- Can i play GTA 6 now? (Joke) (6)
- Very unusual two gaming-pc scenarios. (12)
- Dell Workstation Owners Club (3513)
- Any other old-timers here planning to play WoW Forever? (151)
- Time to upgrade CPU and MOBO (33)
- The Filthy, Rotten, Nasty, Helpdesk-Nightmare picture clubhouse (2876)
- WarpCoreBench scores! (67)
- Honestly, do you care about GTA VI? (144)
- Acer Predator BiFrost Radeon RX 9070 OC (9)
- DTS DCH Driver for Realtek HDA [DTS:X APO4 + DTS Interactive] (2814)
Popular Reviews
- Acemagic Retro X3 Review
- Upcoming Hardware Launches 2027 (Updated Nov 2026)
- AMD Zen 6 Technical Deep Dive
- ASUS ROG Strix B850-I Gaming Wi-Fi7 W Review
- Corsair HX1000i Shift Crystal Review
- Biwin Black Opal NV7400 2 TB Review
- Chieftec Iceberg PRO 360 DARK Review
- AMD Ryzen 7 9800X3D Review - The Best Gaming Processor
- Pulsar Office Tour & First Look at P1 Dual-Sensor Mouse
- Phantom Blade Zero Performance Benchmark Review - 35 GPUs Tested
TPU on YouTube
Controversial News Posts
- NVIDIA Co-Founder and CEO Jensen Huang Officially Resigns (478)
- Report: Jensen Huang Eyes NVIDIA Comeback (187)
- Open Letter Asking NVIDIA to Reinstate Jensen Huang Passes 115,000 Signatures (184)
- OpenAI CEO Argues Home PCs Waste the World's Limited DRAM Supply (152)
- NVIDIA Launches Investigation Into Jensen Huang's Relationship With Suspected Chinese Spy (136)
- Intel "Raptor Lake Next" 16-Core and 20-Core CPUs Surface (130)
- Legendary Game Studio BioWare Shuts Down Following EA Layoffs (104)
- Dell CEO Says the Memory Shortage Will Get Worse in 2027 (95)