 12
Bosgame M5 Review
Web & Office Productivity »General Performance
AIDA64 Cache & Memory
The AIDA64 memory benchmark measures how quickly data moves between system memory and the CPU's cache hierarchy. It provides a closer look at memory bandwidth, latency, and cache behavior.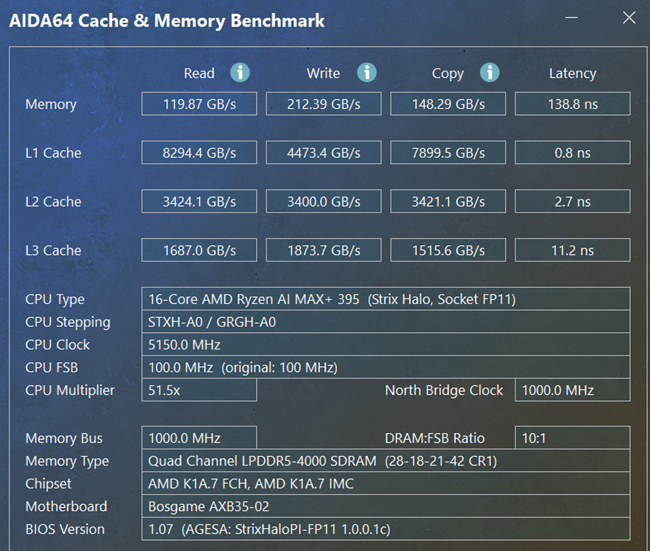
The M5's memory subsystem delivered 119.87 GB/s reads, 212.39 GB/s writes, and 148.29 GB/s copies, with 138.8 ns latency. These results show strong CPU-side memory bandwidth from the LPDDR5X subsystem, while the comparatively high latency is the tradeoff visible in this particular run. The Radeon 8060S shares the same physical memory pool, although these AIDA64 figures should not be interpreted as a direct measurement of GPU memory bandwidth.
Cinebench
Cinebench uses Maxon's Redshift rendering engine to measure processor rendering performance across both single-threaded and multithreaded workloads. Comparing both scores shows how well the processor handles lightly threaded tasks and heavier rendering jobs.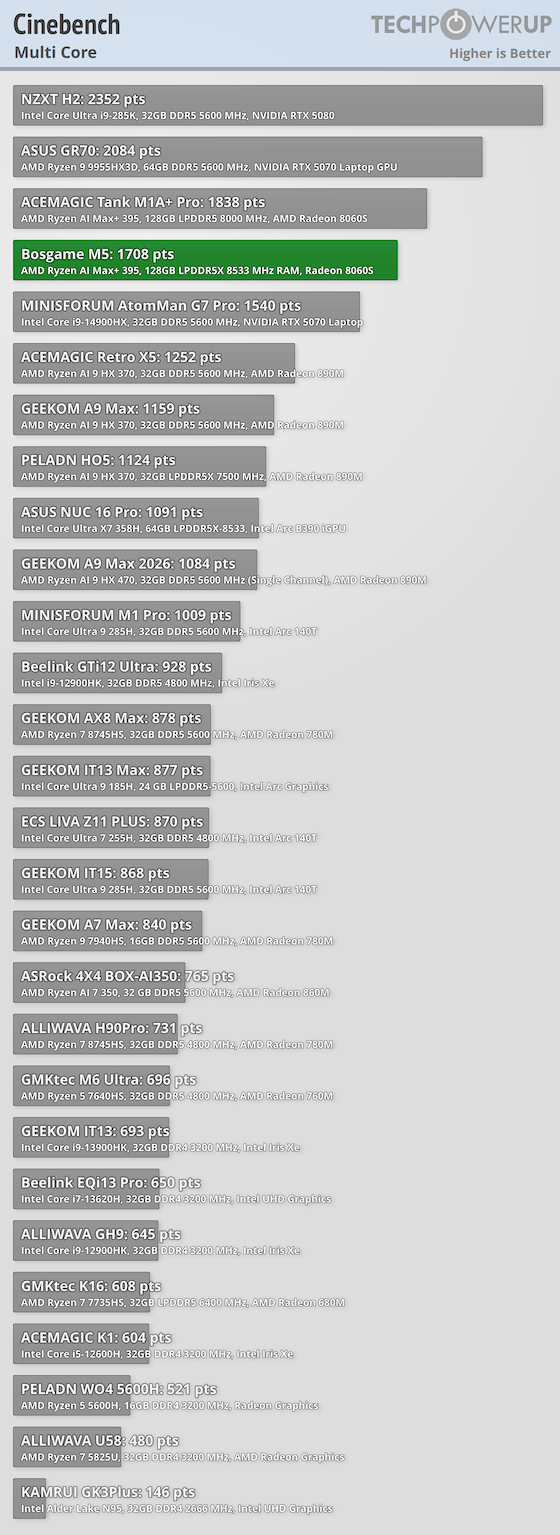
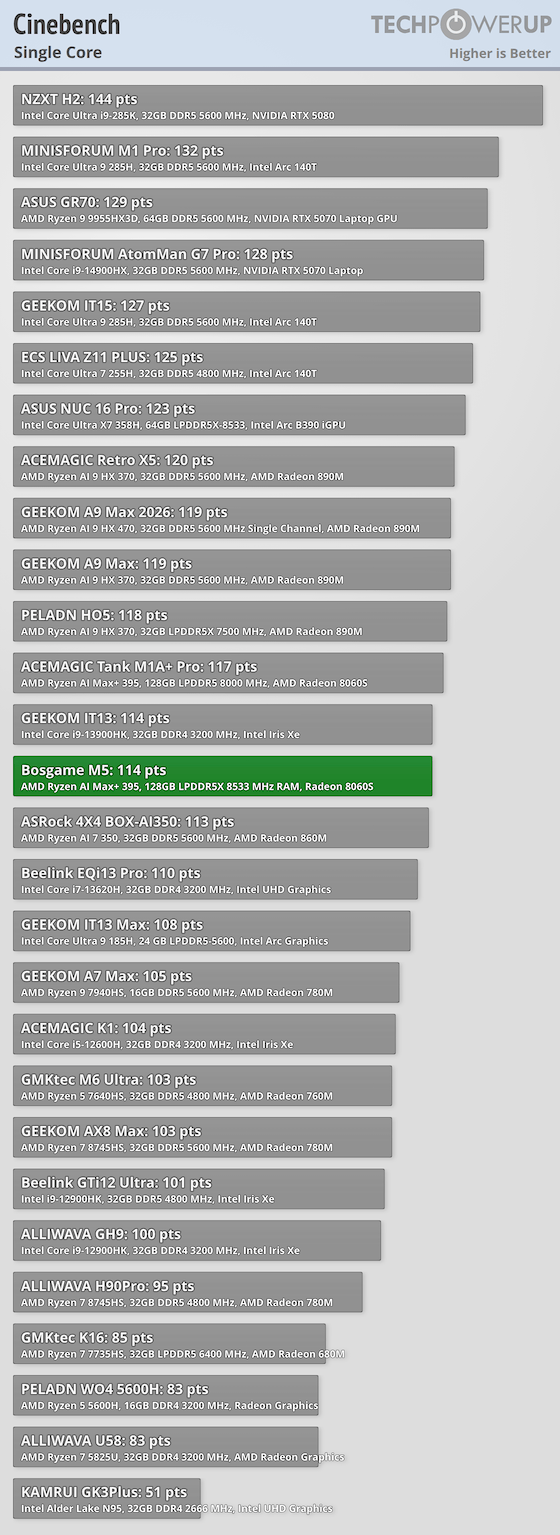
The M5 posted 1,708 points in multicore and 114 points in single-core, placing its heavier rendering result below the similarly configured ACEMAGIC Tank M1A+ Pro at 1,838 points. Single-core performance is very close between the two systems, but the larger multicore gap shows that sustained all-core rendering is one area where the M5 does not get as much performance from the processor.
Performance Mode had a noticeable effect on sustained CPU throughput, increasing the multicore score from 1,708 to 1,810, a 6% gain. Single-core remained essentially unchanged at 113 points, showing that the higher-power profile primarily benefits sustained multicore work.
7-Zip
7-Zip's built-in benchmark measures processor performance during data compression and decompression. It's a useful indicator of how a system handles file-heavy workloads such as packing archives, installing software, or building projects.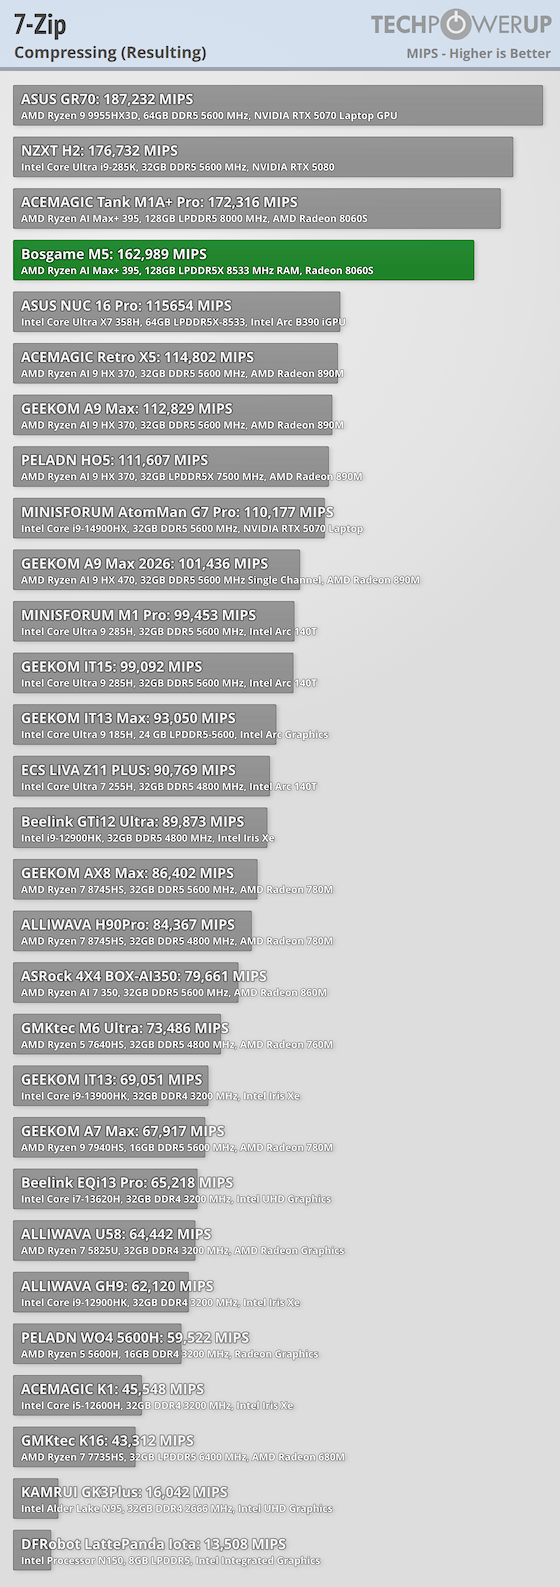
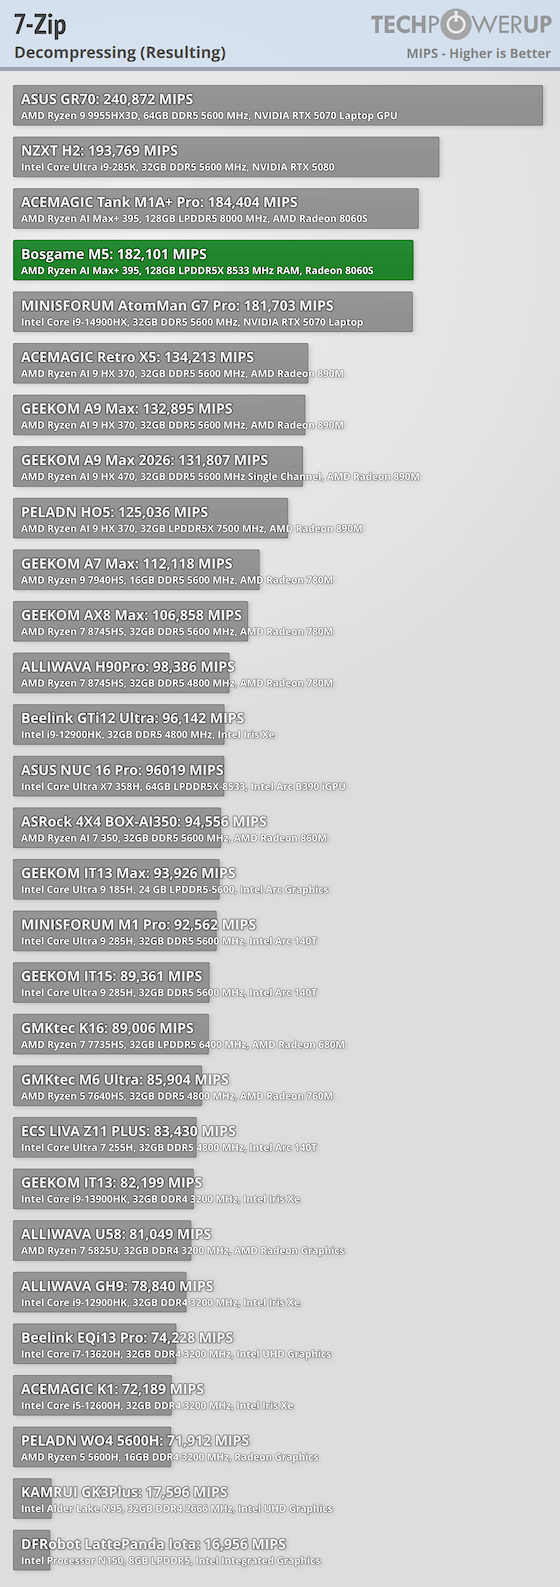
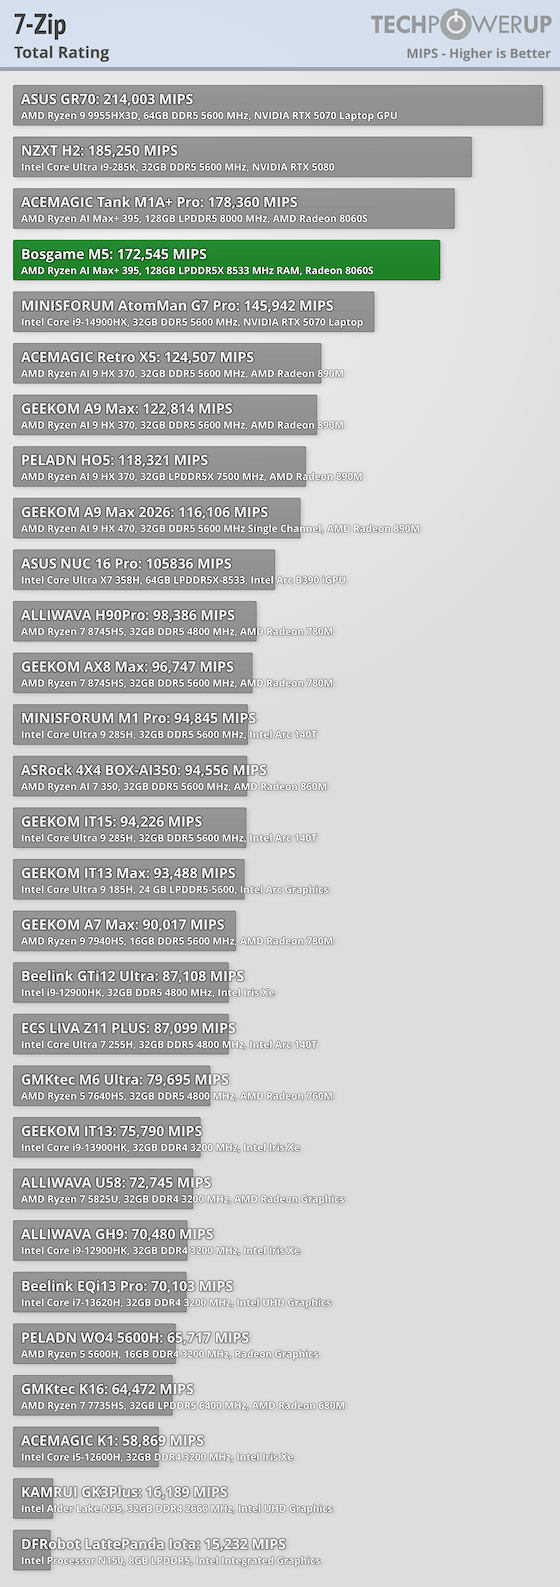
The M5 reached 162,989 MIPS in compression, 182,101 MIPS in decompression, and 172,545 MIPS overall, keeping it near the top of this compact-PC comparison set. The Tank M1A+ Pro records 178,360 MIPS overall, so BOSGAME gives up some compression throughput while remaining very close in decompression.
PCMark
PCMark runs a collection of common desktop activities, including web browsing, video conferencing, office applications, and media workflows. It gives a broad look at day-to-day desktop performance.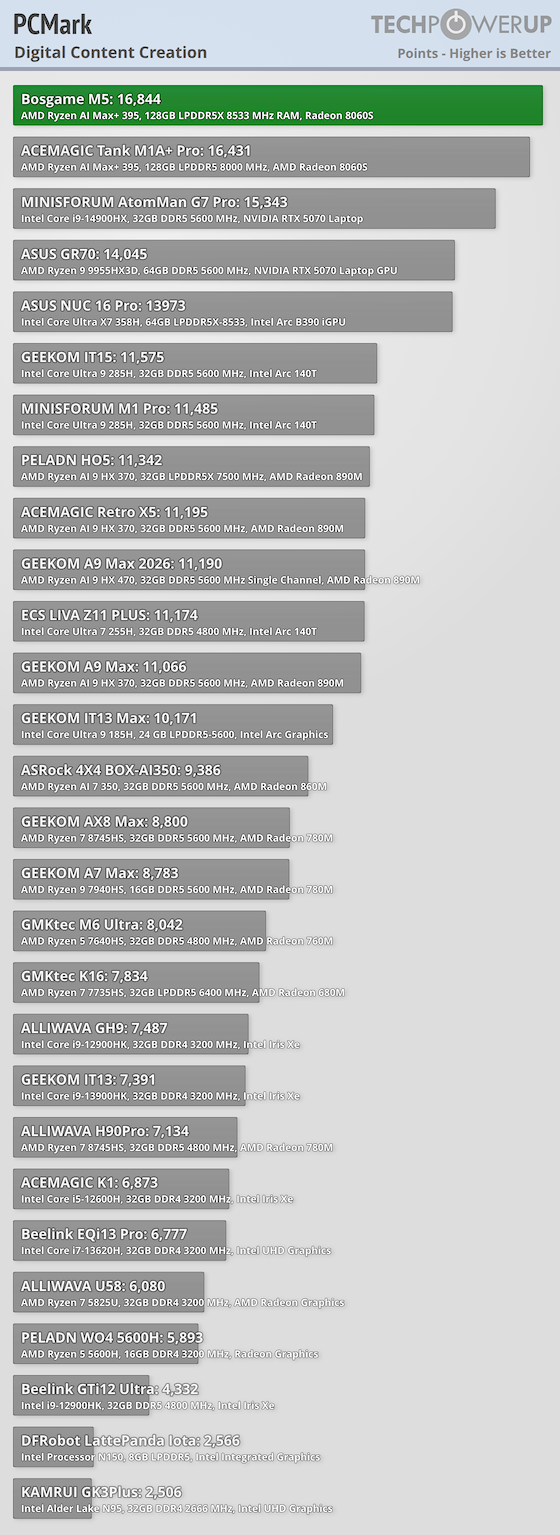
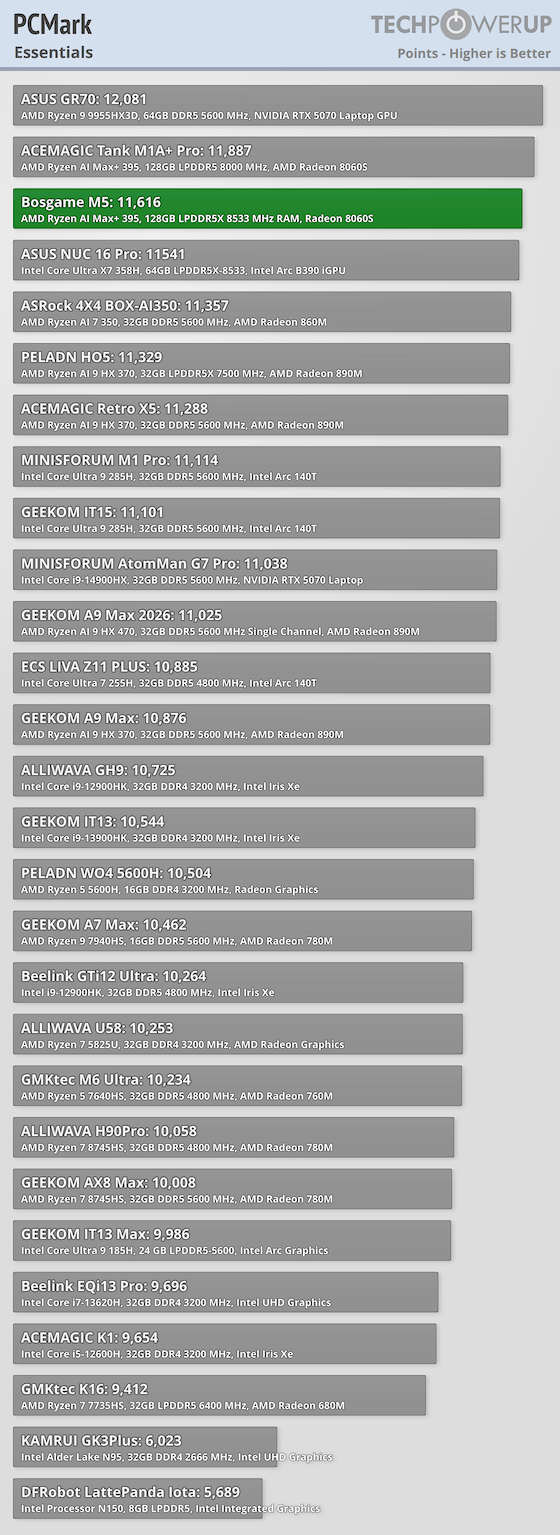
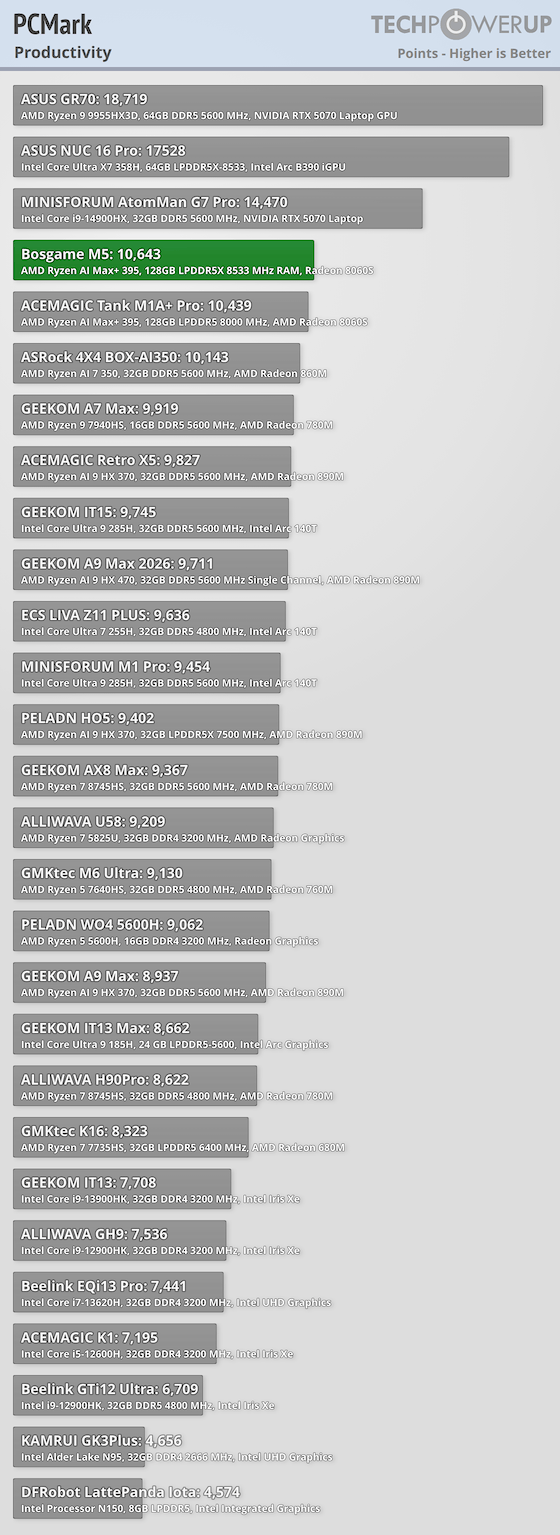
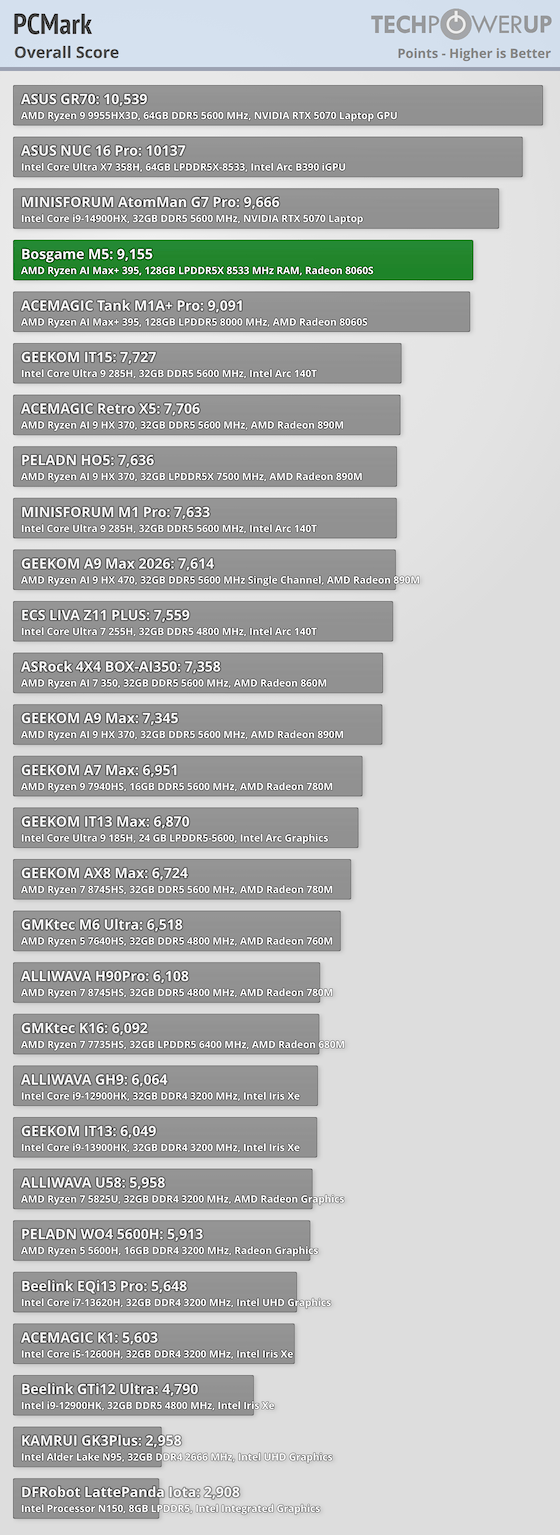
The M5 produced a 9,155-point overall result and 16,844 points in Digital Content Creation, with the latter becoming the highest score in this chart set. Its overall score also edges the Tank M1A+ Pro at 9,091 points, showing that the M5's lower Cinebench multicore result does not carry across the broader mix of desktop workloads.
Y-Cruncher
Y-Cruncher calculates digits of Pi with extreme precision, pushing both CPU and memory to their limits. It's useful for gauging raw compute ability and stability under heavy math workloads.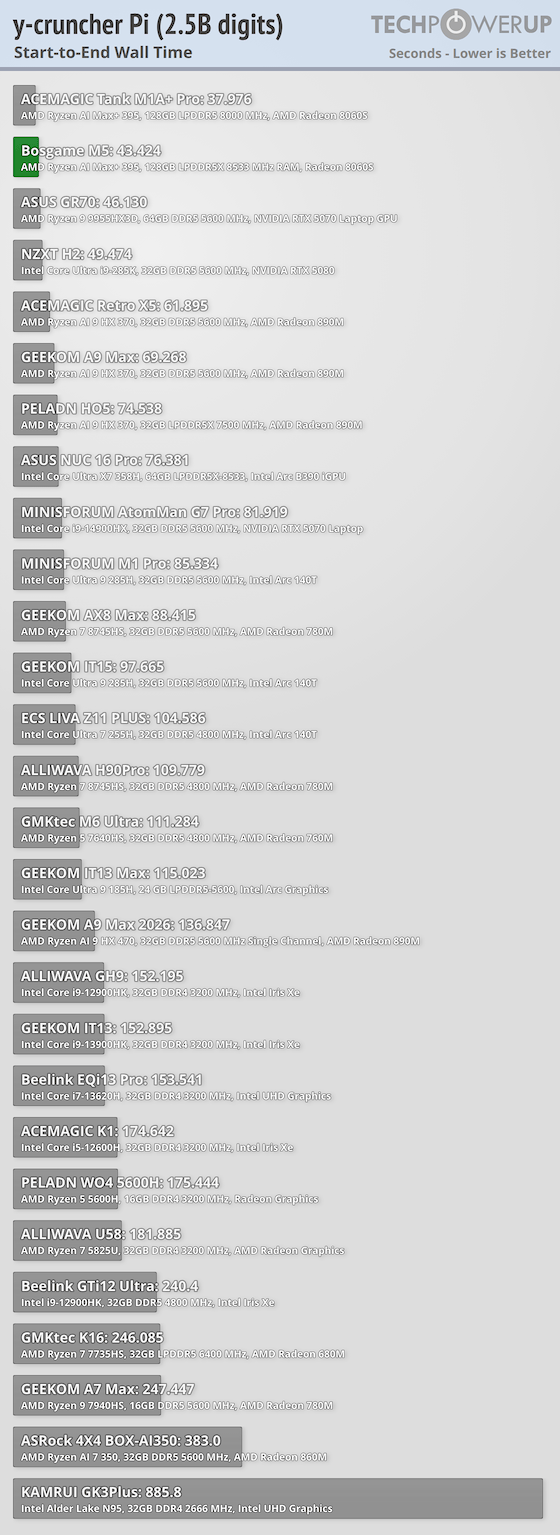
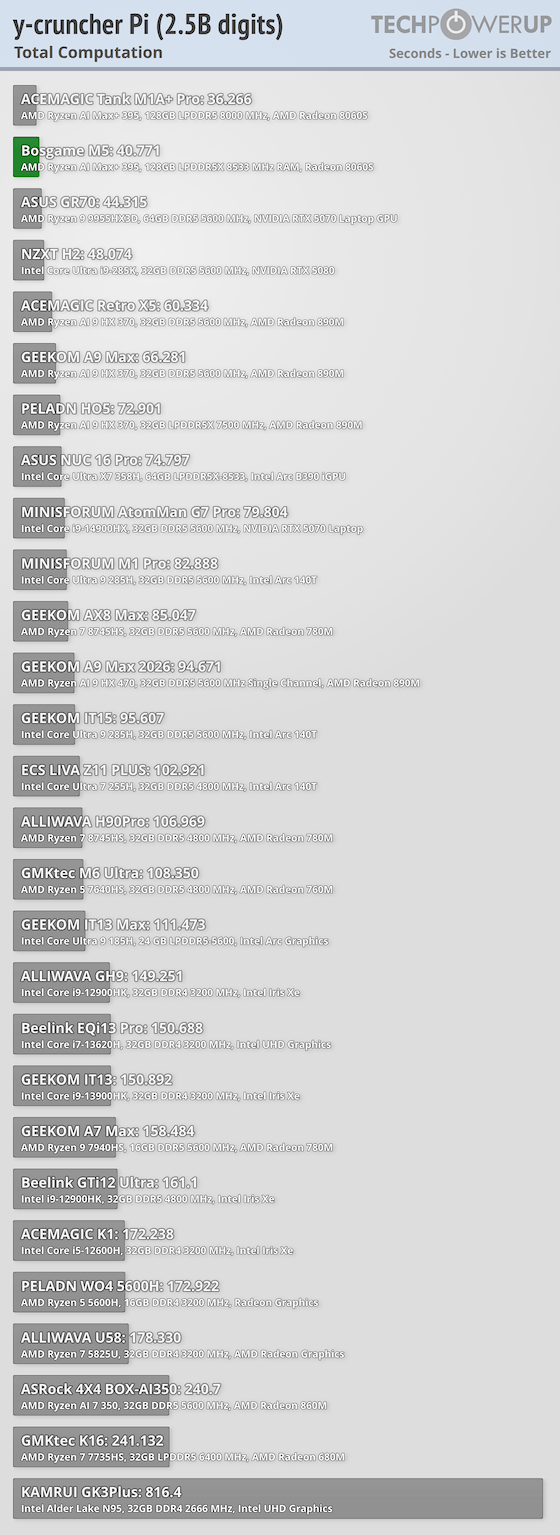
The M5 completed the 2.5-billion-digit calculation in 40.771 seconds of computation time and 43.424 seconds from start to finish. The Tank M1A+ Pro is quicker at 36.266 and 37.976 seconds respectively, making this another sustained CPU and memory workload where the competing Ryzen AI Max+ 395 implementation has an advantage.
Geekbench
Geekbench tests a wide variety of workloads, from encryption and machine learning to office productivity and photo editing. It also includes a GPU compute test, which provides a useful look at graphics performance outside of games.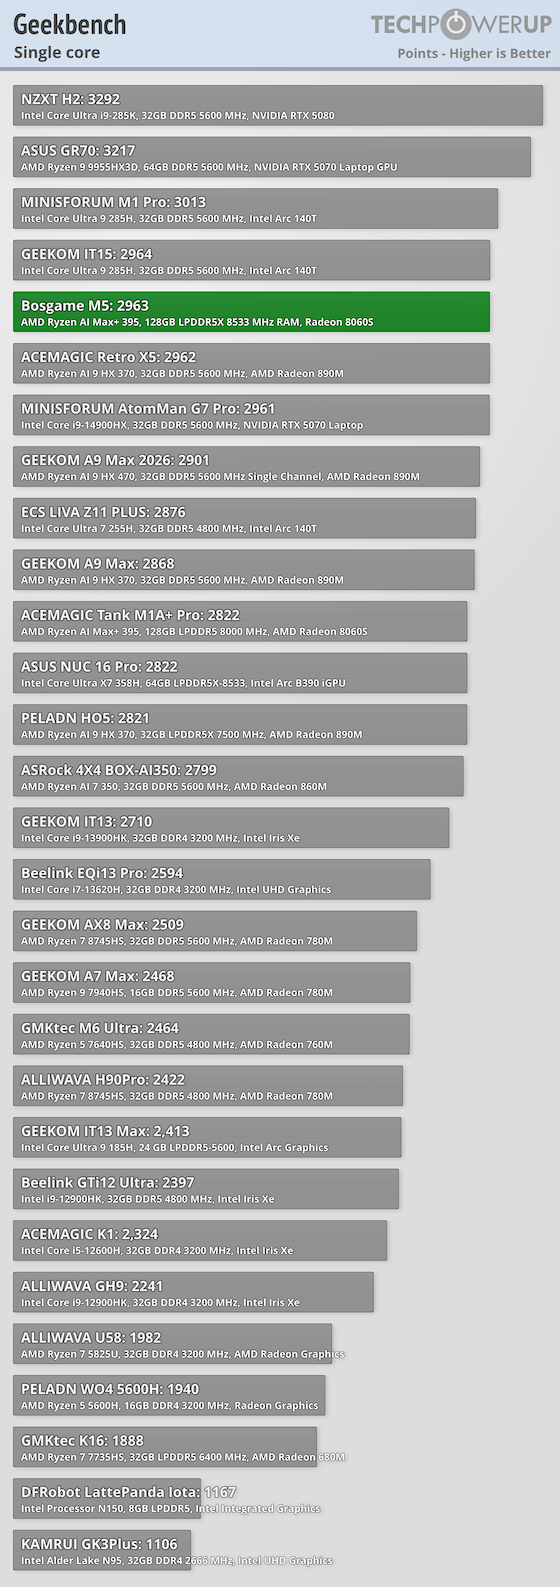
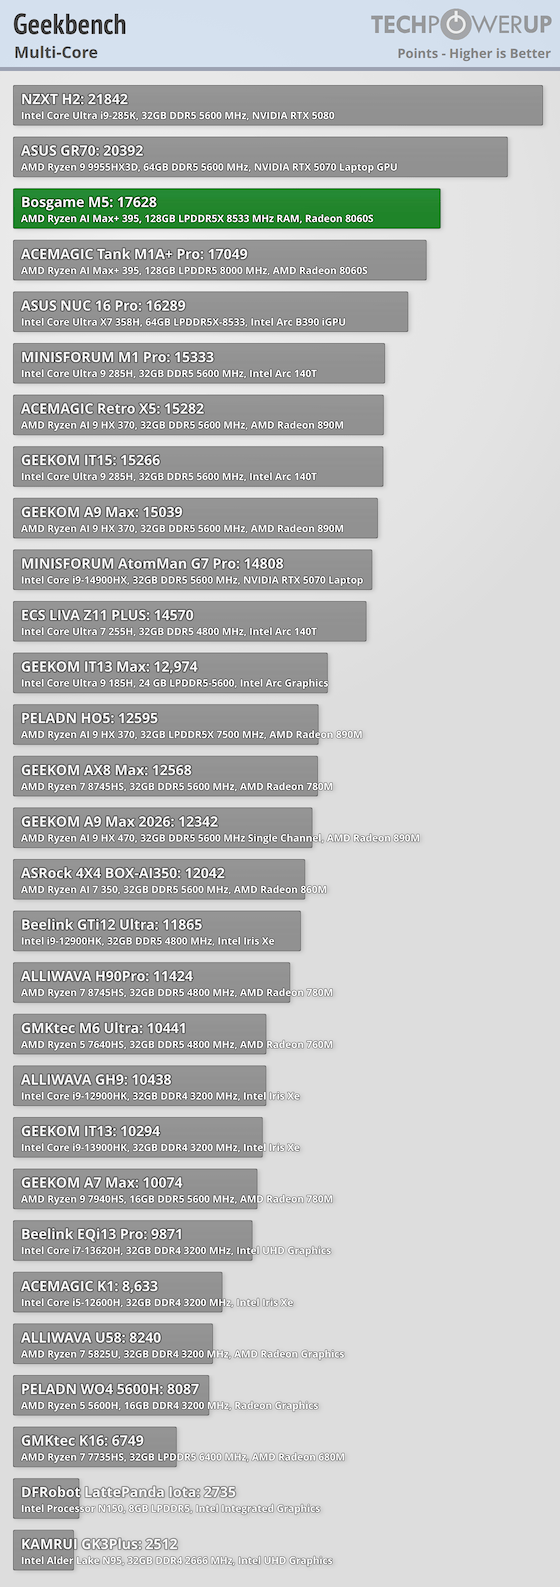
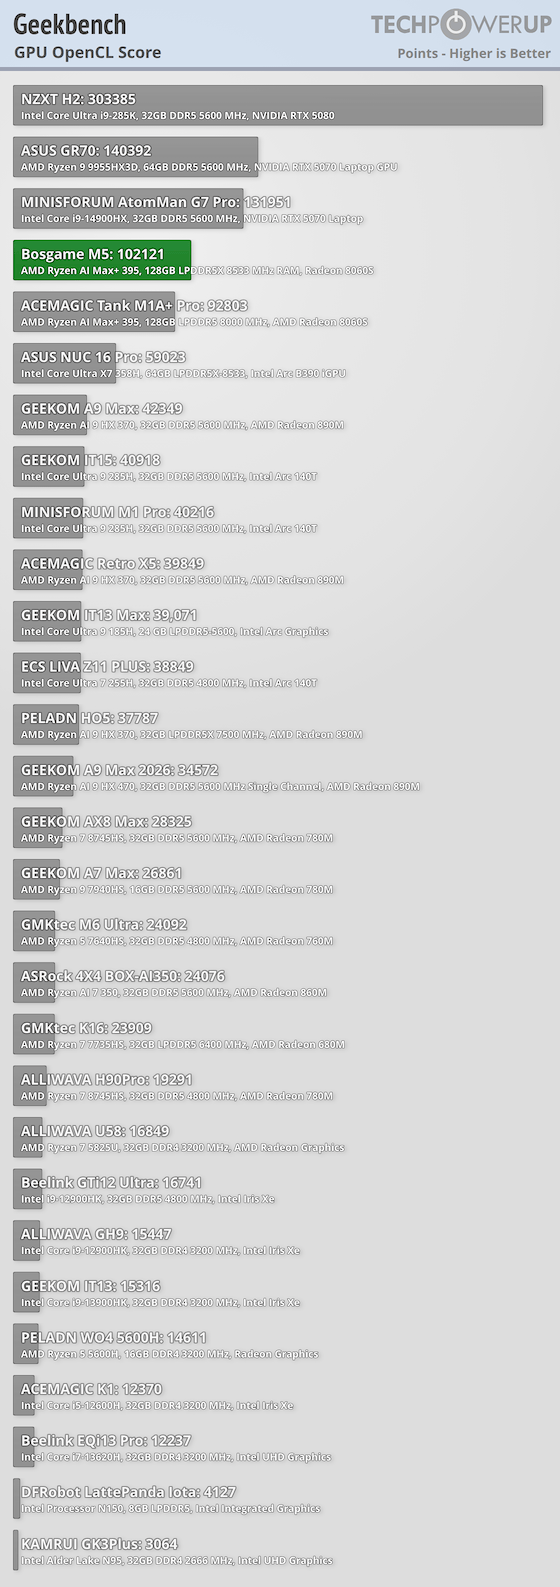
The M5 scored 2,963 in single-core, 17,628 in multicore, and 102,121 in the OpenCL GPU test, giving it a strong showing across both processor and integrated-graphics work. Those figures all exceed the Tank M1A+ Pro's 2,822, 17,049, and 92,803 scores, which shows that the performance relationship between these two systems changes noticeably with workload type.
Nov 19th, 2026 15:40 CST
change timezone
Latest GPU Drivers
New Forum Posts
- Honestly, do you care about GTA VI? (163)
- Windows 11 General Discussion (7736)
- Current Sales, Bundles, Giveaways (10448)
- Last game you purchased? (1409)
- WarpCoreBench scores! (76)
- Got the EOL 32GB TridentZ 6000 CL26 1.4V (12)
- Dell Workstation Owners Club (3516)
- Making a game in Godot engine (4)
- DTS DCH Driver for Realtek HDA [DTS:X APO4 + DTS Interactive] (2815)
- Security Apps (2)
Popular Reviews
- Acemagic Retro X3 Review
- Ugreen NASync DXP4800 GT Review
- Upcoming Hardware Launches 2027 (Updated Nov 2026)
- Pulsar Office Tour & First Look at P1 Dual-Sensor Mouse
- AMD Zen 6 Technical Deep Dive
- Biwin Black Opal NV7400 2 TB Review
- Sapphire Radeon RX 7700 XT Pure Review
- Sapphire Radeon RX 7700 XT Pulse Review
- AMD Ryzen 7 9800X3D Review - The Best Gaming Processor
- Chieftec Iceberg PRO 360 DARK Review
TPU on YouTube
Controversial News Posts
- NVIDIA Co-Founder and CEO Jensen Huang Officially Resigns (488)
- Report: Jensen Huang Eyes NVIDIA Comeback (223)
- Open Letter Asking NVIDIA to Reinstate Jensen Huang Passes 115,000 Signatures (184)
- OpenAI CEO Argues Home PCs Waste the World's Limited DRAM Supply (152)
- NVIDIA Launches Investigation Into Jensen Huang's Relationship With Suspected Chinese Spy (136)
- Intel "Raptor Lake Next" 16-Core and 20-Core CPUs Surface (130)
- Legendary Game Studio BioWare Shuts Down Following EA Layoffs (104)
- Dell CEO Says the Memory Shortage Will Get Worse in 2027 (95)