 11
DFRobot LattePanda Iota Review
Web & Office Productivity »General Performance
AIDA64 Cache & Memory
The AIDA64 memory benchmark measures how quickly data moves between system memory and the CPU's cache hierarchy. It provides insight into bandwidth (read/write/copy speeds) and latency, which directly affect responsiveness in everyday computing and the performance of integrated graphics that share system memory.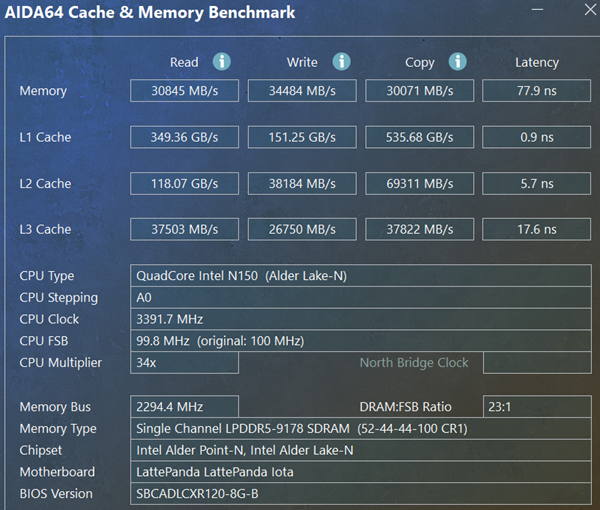
Memory performance on the LattePanda Iota comes in at 30,845 MB/s read, 34,484 MB/s write, and 30,071 MB/s copy, with a latency of 77.9 ns. For a system using single-channel LPDDR5, those bandwidth numbers are solid and give the platform a bit more headroom than older DDR4-based Mini-PCs in this class. The higher latency is expected, especially in a low-power design like this, and shows up more in heavier or memory-sensitive workloads.
Cache performance scales as expected for the N150. L1 cache reaches 349.36 GB/s read and 535.68 GB/s copy with extremely low 0.9 ns latency, while L2 and L3 step down to 118.07 GB/s read/5.7 ns latency and 37,503 MB/s read/17.6 ns latency, respectively.
7-Zip
7-Zip's built-in benchmark measures CPU performance when compressing and decompressing data. It's a good indicator of how a system handles file-heavy workloads such as packing archives, installing software, or building projects.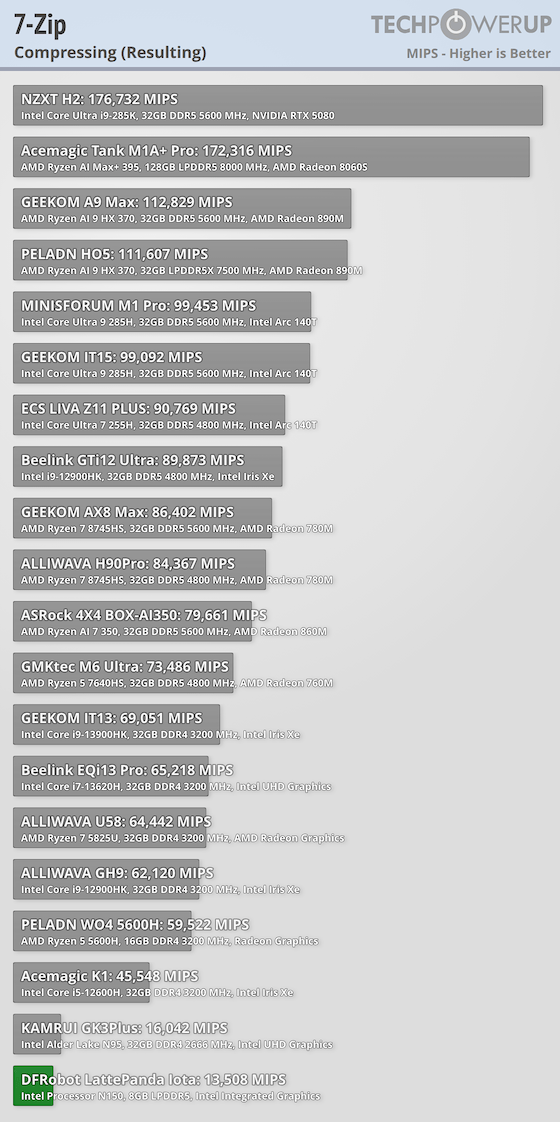
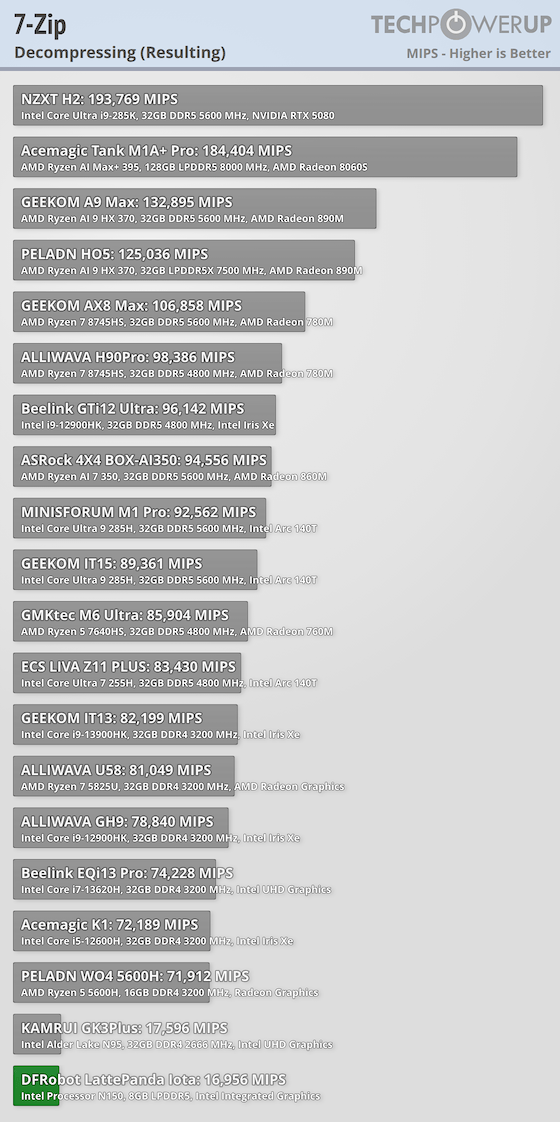
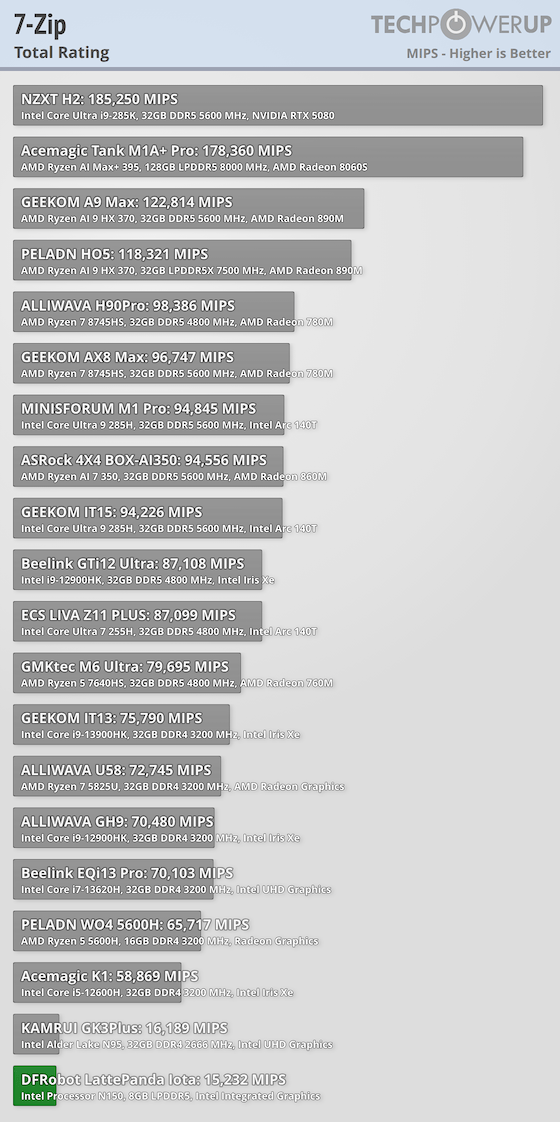
The LattePanda Iota scores 13,508 in compression, 16,956 in decompression, and 15,232 overall, which puts it near the bottom of the chart but still in line with other N150 systems. The gap between compression and decompression is normal, and the totals line up with the board's intended role as a light-duty embedded or utility platform rather than a heavy compute box.
PCMark 10
PCMark simulates common desktop activities across browsing, video conferencing, office apps, and media workflows. It provides a composite view of how a system will feel in day-to-day usage.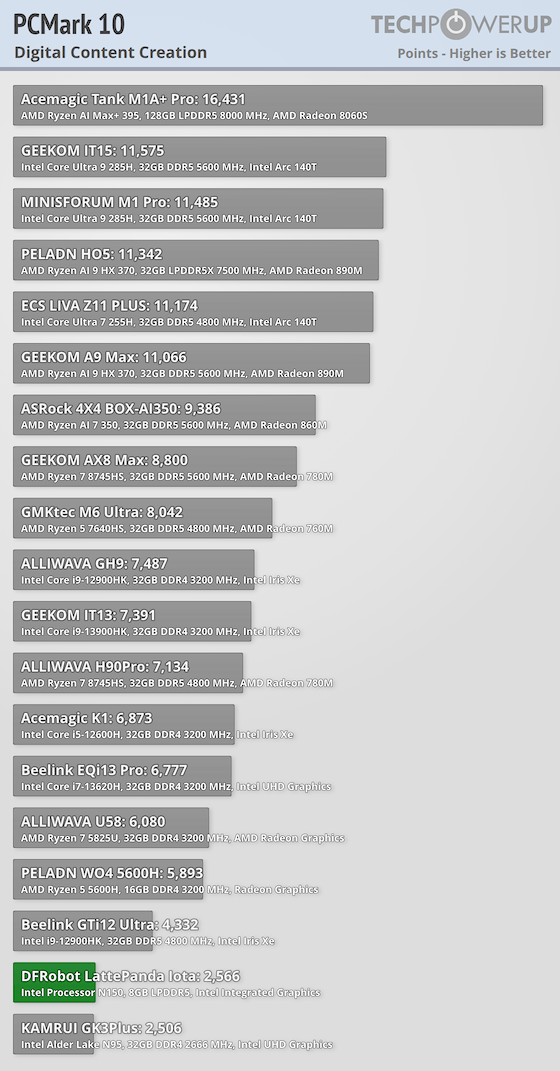
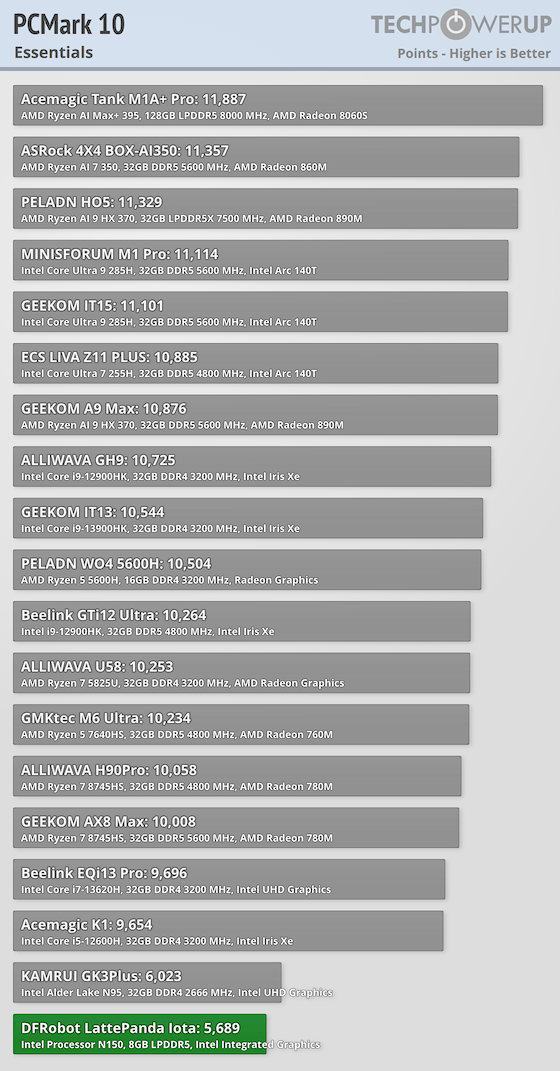
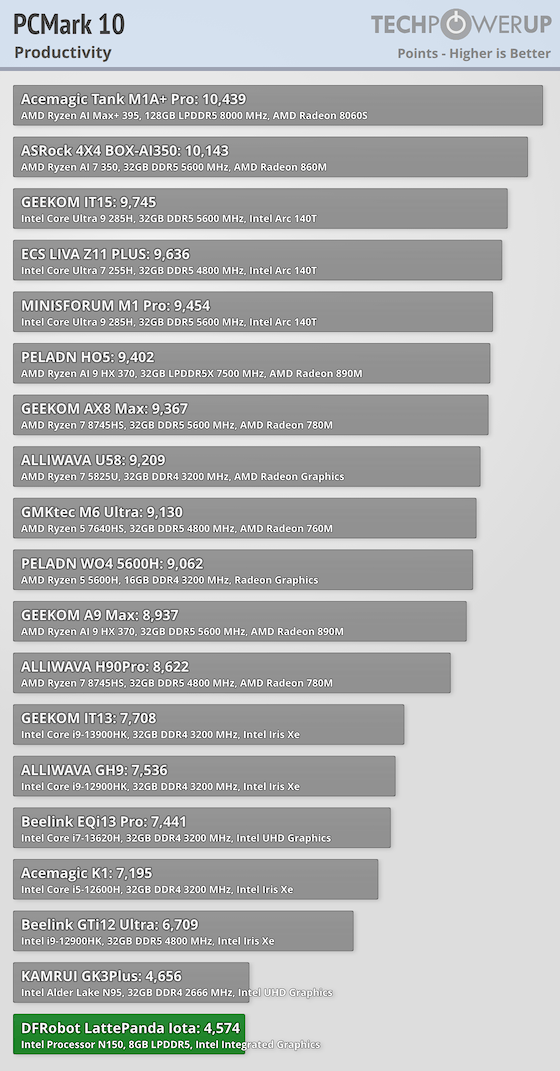
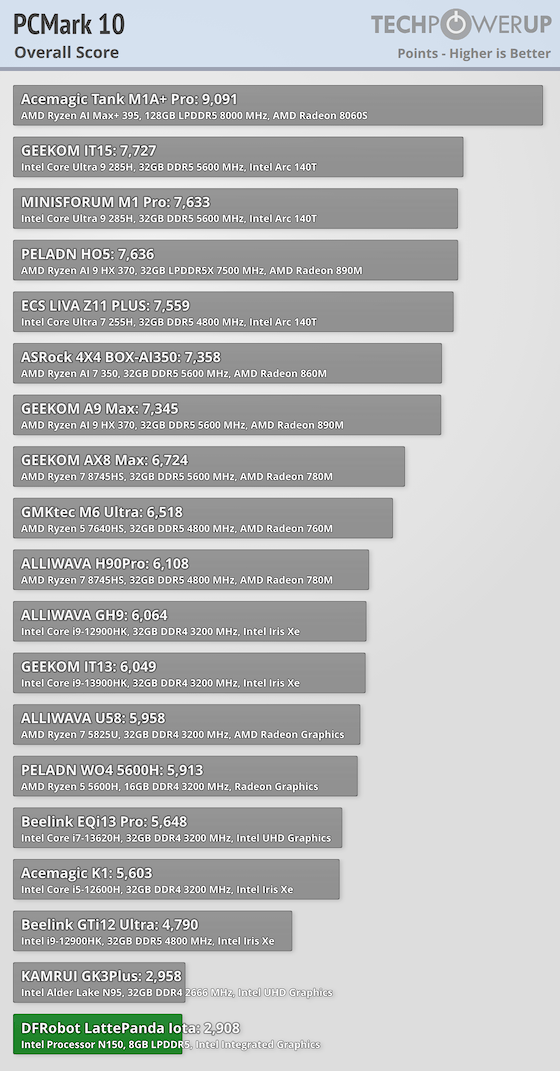
PCMark 10 results come in at 5,689 for Essentials, 4,574 for Productivity, 2,566 for Digital Content Creation, and 2,908 overall. The gap between lighter tasks and content creation is pretty evident, with basic desktop workloads being manageable while heavier client workloads drop off quickly. These scores were expected, though.
Geekbench
Geekbench tests a wide variety of workloads, from encryption and machine learning to office productivity and photo editing. It also includes GPU acceleration, giving a broader view of system capability.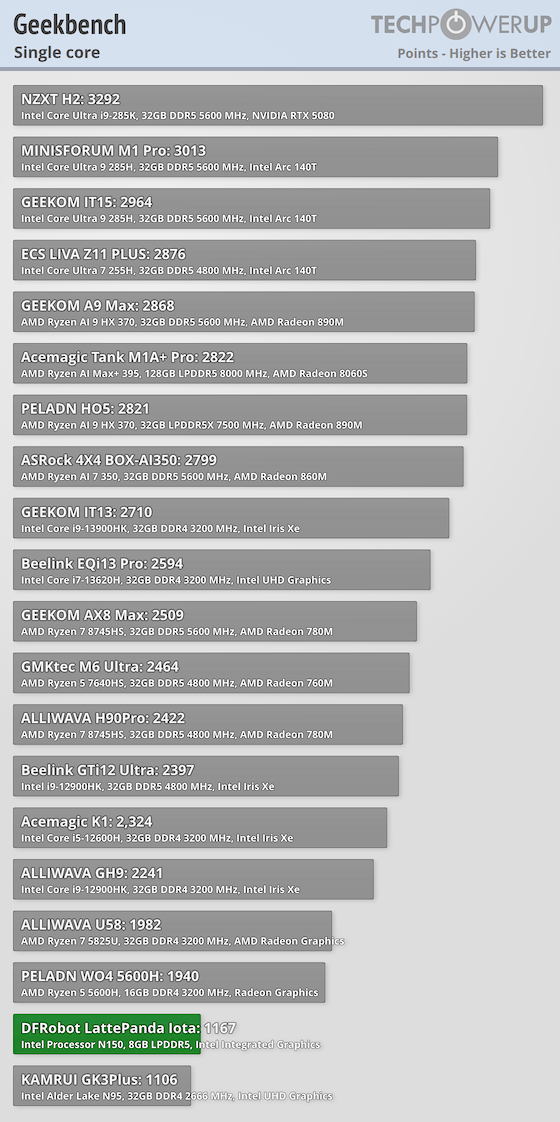
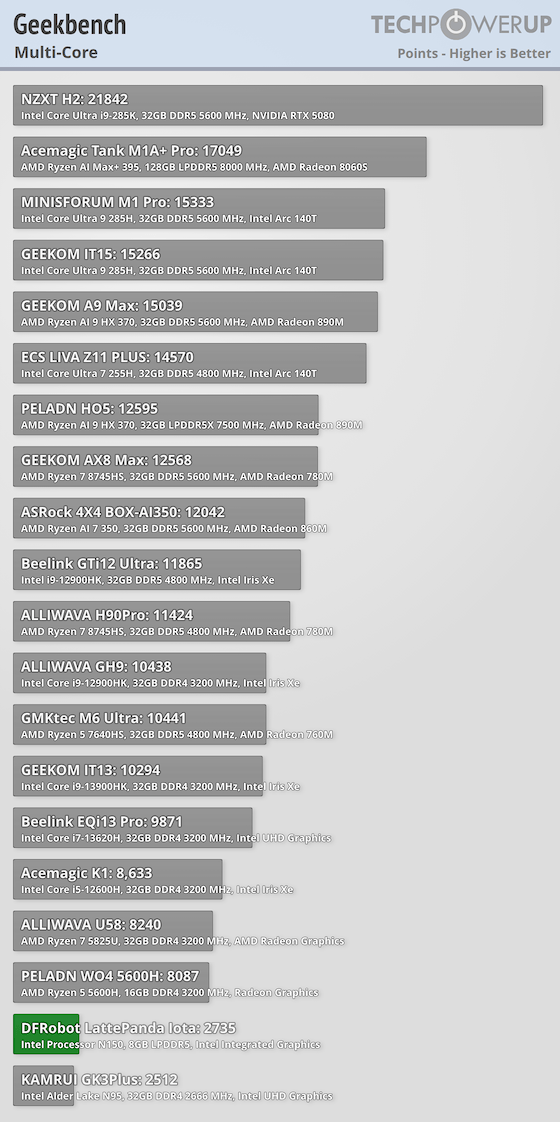
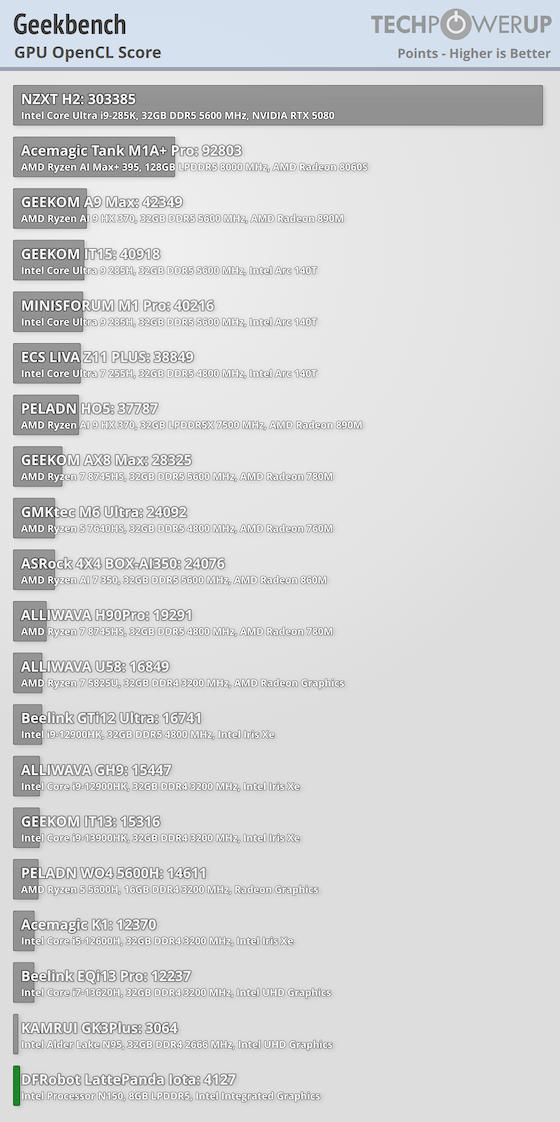
Geekbench shows 1,167 single-core and 2,735 multicore, alongside a 4,127 OpenCL GPU score. Single-core performance keeps basic tasks moving without noticeable slowdown, while the multicore and GPU results show the limits of the N150 and its integrated graphics.
Nov 16th, 2026 07:02 CST
change timezone
Latest GPU Drivers
New Forum Posts
- GPU Temperatures Rise Very Quickly in FurMark – Is This Normal? (17)
- Can you guess Which game it is? (327)
- no OpenGL showing support when... (11)
- Without Jensen, PC gaming will be (2)
- The Official Thermal Interface Material thread (2302)
- no "PhysX" workable (15)
- Asus Maximus hero z890 latest Bios 3410 (0)
- What can the FX 8320 do today? Here is the answer. (63)
- Advice for my PC upgrade (6)
- Stalker 2 is looking great. (261)
Popular Reviews
- ASUS ROG Strix B850-I Gaming Wi-Fi7 W Review
- Corsair HX1000i Shift Crystal Review
- AMD Zen 6 Technical Deep Dive
- Upcoming Hardware Launches 2027 (Updated Nov 2026)
- Montech King 95 3D PRO Review
- NZXT C1200 Platinum Review
- Phantom Blade Zero Performance Benchmark Review - 35 GPUs Tested
- AMD Ryzen 7 9800X3D Review - The Best Gaming Processor
- NZXT H7 RGB+ Review
- NZXT H5 Review
TPU on YouTube
Controversial News Posts
- NVIDIA Co-Founder and CEO Jensen Huang Officially Resigns (431)
- Open Letter Asking NVIDIA to Reinstate Jensen Huang Passes 115,000 Signatures (184)
- OpenAI CEO Argues Home PCs Waste the World's Limited DRAM Supply (152)
- NVIDIA Launches Investigation Into Jensen Huang's Relationship With Suspected Chinese Spy (136)
- Intel "Raptor Lake Next" 16-Core and 20-Core CPUs Surface (130)
- Legendary Game Studio BioWare Shuts Down Following EA Layoffs (104)
- Dell CEO Says the Memory Shortage Will Get Worse in 2027 (95)
- NVIDIA GeForce RTX 50-Series Scheduled for up to $500 Price Hike This Week (89)