 43
G.SKILL Trident Z5 NEO RGB DDR5-6000 32 GB CL26 Review - AMD EXPO
Value & Conclusion »Frametime Analysis
We present a more in-depth analysis than just average FPS to show how the frame rate changes over time, which helps highlight FPS drops. Minimum FPS at both the 95th and 99th percentile are reported in these charts, too. A second chart, a histogram, shows shape and spread for the frametime data—how tightly grouped the measurements are. The "IQR" result is called "Interquartile Range," which is an outlier-resistant statistical value that tells us the range in the middle of the frametime distribution.Location: Baldur's Gate City
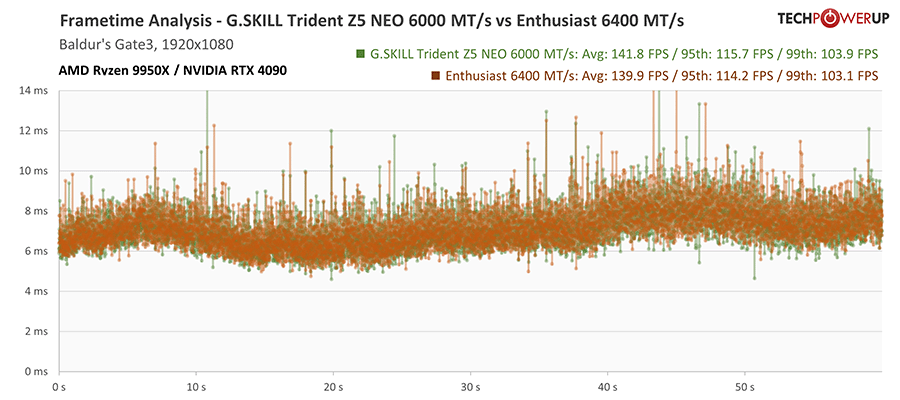
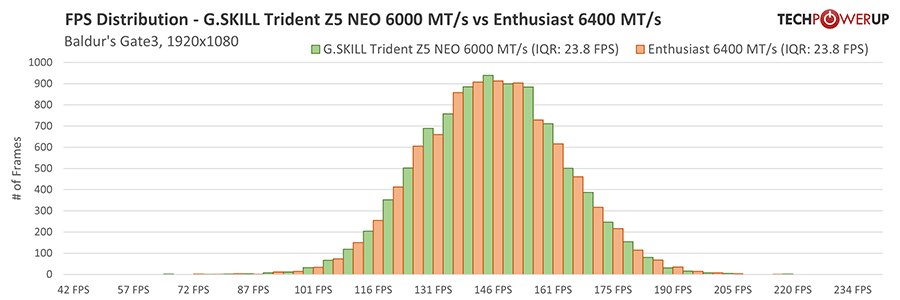
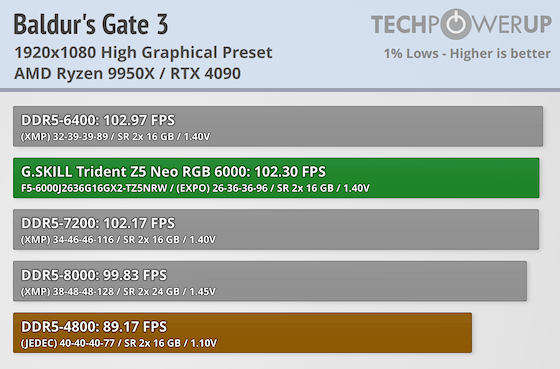
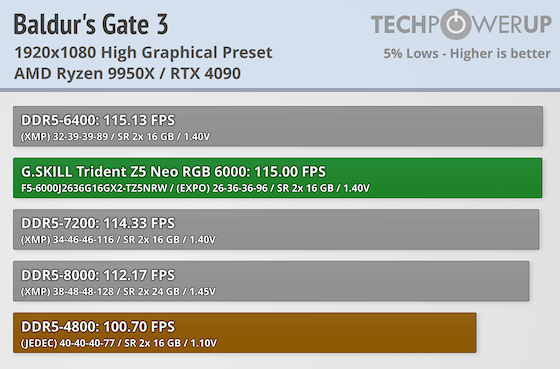
Checking out Baldur's Gate 3, this is a game that favors both high frequency and is sensitive to latency. Once again the G.SKILL Trident Z5 NEO RGB 6000 MT/s is still right next to 6400 MT/s due to both of them having equal latency, but 6400 MT/s has slightly more bandwidth.
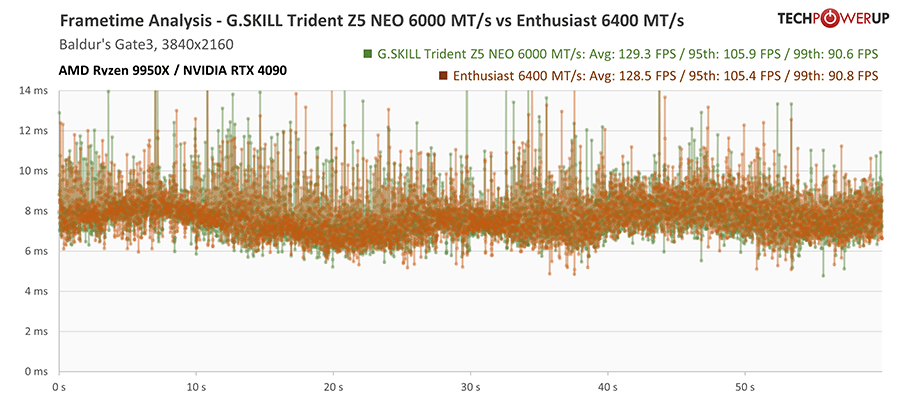
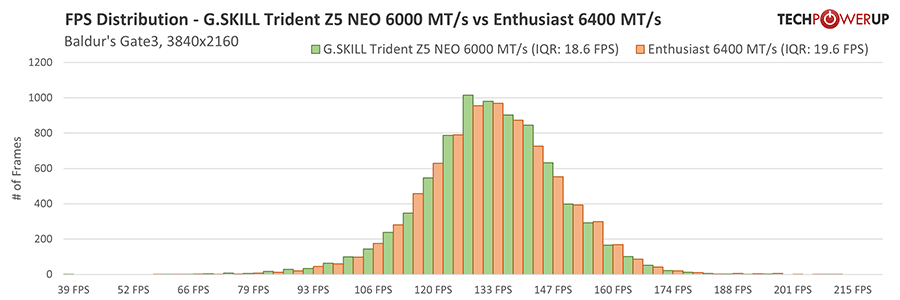
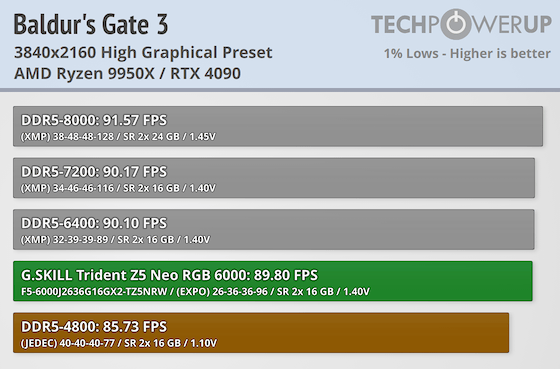
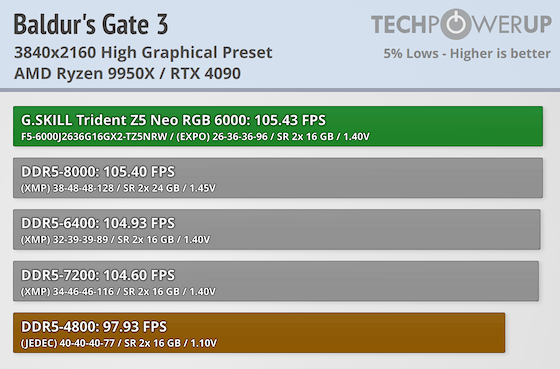
By increasing the resolution, the overall frame rate goes down, and the gap starts to close in on margin of error. Baldur's Gate 3 still has some headroom with the RTX 4090 depending on one which speed of memory is used.
Nov 17th, 2026 16:30 CST
change timezone
Latest GPU Drivers
New Forum Posts
- Help with fixing Overclock (5)
- ProArt X870E-CREATOR WIFI - Bifurcation~Complication (13)
- Last game you purchased? (1403)
- Without Jensen, PC gaming will be (33)
- [Poll] 12V-2x6 Connector Protection: What Are You Using? (WireView / Ampinel / Equalizer / Other / Nothing) (27)
- What is the latest game you finished or 100% (204)
- 9070 GRE 3.9ghz validation reached. (15)
- USB 3.0 90 Degree Adapter (2)
- Latest method for DTS/DDL for Logitech Z906 (0)
- What are you playing? (26232)
Popular Reviews
- Acemagic Retro X3 Review
- Corsair HX1000i Shift Crystal Review
- AMD Zen 6 Technical Deep Dive
- Upcoming Hardware Launches 2027 (Updated Nov 2026)
- ASUS ROG Strix B850-I Gaming Wi-Fi7 W Review
- Phantom Blade Zero Performance Benchmark Review - 35 GPUs Tested
- AMD Ryzen 7 9800X3D Review - The Best Gaming Processor
- Chieftec Iceberg PRO 360 DARK Review
- Montech King 95 3D PRO Review
- NZXT C1200 Platinum Review
TPU on YouTube
Controversial News Posts
- NVIDIA Co-Founder and CEO Jensen Huang Officially Resigns (457)
- Open Letter Asking NVIDIA to Reinstate Jensen Huang Passes 115,000 Signatures (184)
- OpenAI CEO Argues Home PCs Waste the World's Limited DRAM Supply (152)
- NVIDIA Launches Investigation Into Jensen Huang's Relationship With Suspected Chinese Spy (136)
- Report: Jensen Huang Eyes NVIDIA Comeback (135)
- Intel "Raptor Lake Next" 16-Core and 20-Core CPUs Surface (130)
- Legendary Game Studio BioWare Shuts Down Following EA Layoffs (104)
- Dell CEO Says the Memory Shortage Will Get Worse in 2027 (95)