 13
13
INNOCN PU15-PRE 4K OLED Touchscreen Monitor Review - A Portable Hero
Value & Conclusion »Response Time
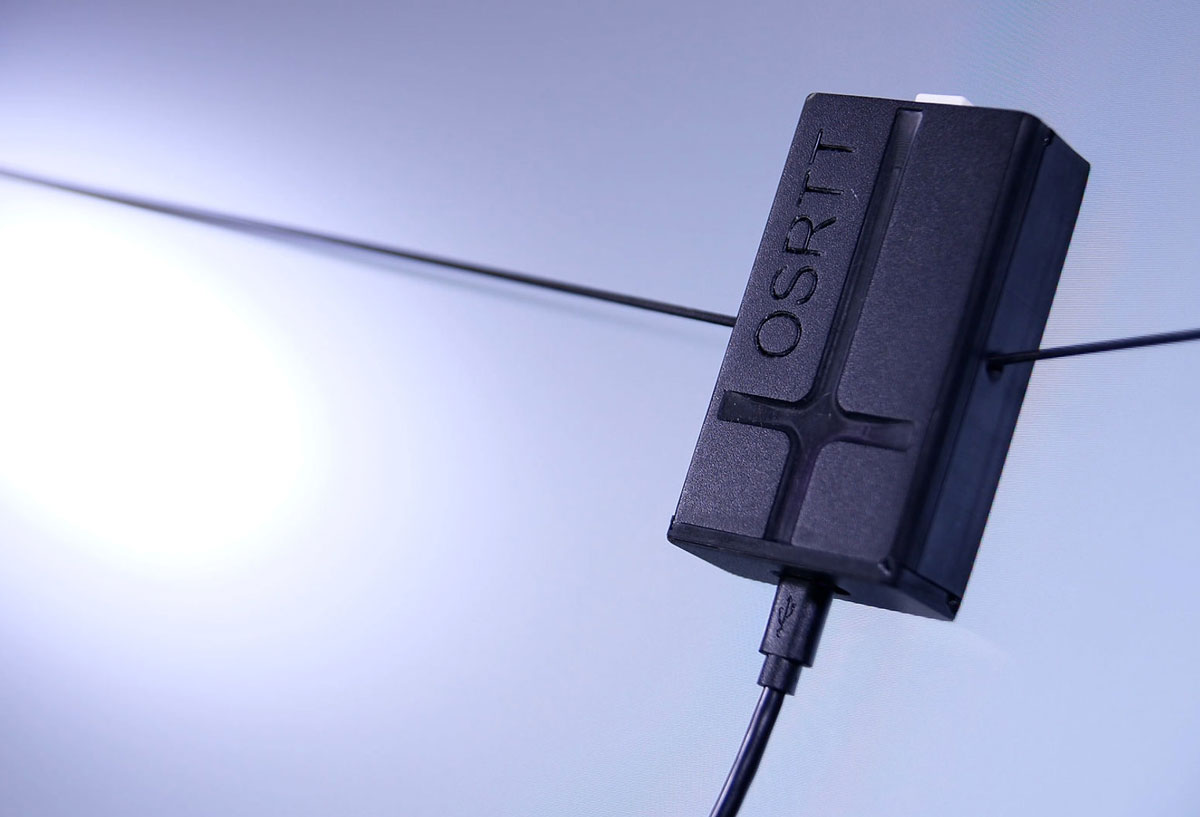
I tested the response time with the Open Source Response Time Tool (OSRTT), developed by Andrew McDonald of TechTeamGB. It's a nifty tool that, when combined with the OSRTT Launcher app, measures panel response times and presents them through detailed graphs and easy-to-read heatmaps. You can find everything you might want to know about the OSRTT in its technical documentation and on the official website, where you can order your own unit, too. The OSRTT gives us three interesting heatmaps to observe.
Perceived Response Time tells us how much time the panel took to transition from one color to another. This measurement is expressed in milliseconds and includes overshoot. In other words, if the panel exceeded the target value, the perceived response time also includes the time it took for the transition to recover from overshoot and stabilize on the target value. I'm running my tests with recommended settings, so with a fixed RGB 5 tolerance level and with gamma-corrected RGB values.
RGB Overshoot tells us how much a certain transition missed the target value. For example, if the panel was transitioning from RGB 51 to RGB 204, and it initially landed on RGB 212, the overshoot RGB value is 8. Overshoot can be both positive and negative, and it commonly occurs at extreme overdrive settings when pixels are driven by high voltage. In practice, overshoot manifests as an afterimage or a halo around a moving object, and it can be easily spotted even when doing something as basic as scrolling through a webpage.
Visual Response Rating is the most abstract heatmap generated by the OSRTT Launcher; in essence, it's an ever-evolving scoring system. To quote OSRTT's technical documentation, it is a finite score rather than a direct measurement. The calculation is pretty simple, it's: "100 – (Initial Response Time + Perceived Response Time)". Since both metrics are using the same tolerance level, if a display doesn't overshoot, both times will be identical. This essentially rewards displays that are fast with a small amount of overshoot over displays that aren't as fast even if they don't overshoot at all – while still overall preferring ultra-fast, accurate monitors.
Here's how the INNOCN PU15-PRE fares in the pixel response time test.
As you can see, the pixel transitions aren't quite as fast as you'd expect from a high-end OLED panel. INNOCN claims a 1 ms response time in their technical spec sheet, but they're probably quoting the initial response time, which is an outdated way of measuring pixel response times, and less relevant than the perceived response time. The OSRTT also picked up quite a bit of overshoot. The monitor offers no overdrive technology. If you're looking for the more common G2G response time, that would be the average perceived time value (15.8 ms).
In practice, the gaming potential of the PU15-PRE cannot be discarded based on its pixel response time alone. I played quite a bit of Rocket League while testing the monitor and didn't find its ghosting and overshoot at all pronounced or distracting.
Input Lag

To measure the input lag of a monitor, I'm using the NVIDIA LDAT v2, which I've covered extensively in my NVIDIA Reflex review.
The LDAT (Latency Display Analysis Tool) is a small device that is strapped onto a monitor, measures brightness changes, and provides us with end-to-end system latency data—the so-called mouse-to-photon latency. Using it for reliable and repeatable monitor input lag testing was made possible by NVIDIA's inclusion of the flash indicator feature in some Reflex-supported games. The flash indicator is essentially a white box, displayed at the left edge of the screen at the moment when a mouse click "arrives" on the screen. I simply place the LDAT sensor on the part of the screen where the flash indicator will appear and click the mouse button on the sensor itself. The sensor will then detect the sudden change in brightness and calculate how much time it took between the mouse button click and the flash appearing on the screen – that's the aforementioned end-to-end system latency. While this method doesn't let me isolate the input lag of the monitor as the only measured value (the high-speed camera method didn't do that either), if the rest of my system remains unchanged, then the tested monitors can be compared to each other.
One other excellent characteristic of the LDAT method is the Auto Fire feature of the LDAT software. The Auto Fire feature allows me to select a number of "shots" (test iterations), as well as the "shot delay" (a delay between mouse clicks). All I have to do is run the desired game, align the LDAT sensor to the flash indicator area, and press the "mouse" button on the LDAT. The sensor and the accompanying software take care of everything else. Less than a minute later, I have my test results—the minimum, average, and maximum measured end-to-end system latency and the standard deviation.
| Monitor Input Lag Test System | |
|---|---|
| CPU | Intel Core i9-9900K |
| GPU | Palit GeForce RTX 2080 Super GP |
| Motherboard | ASUS ROG Maximus XI Formula |
| RAM | ADATA Spectrix D60G DDR4 32 GB |
| SSD | Kioxia Exceria 500 GB NVMe |
In the end, we get the so-called button-to-pixel lag - the time that passes from the moment you do an action with your mouse until the said action is first registered on the screen. Anything below 16 ms (that equals one frame of lag at 60 Hz) can be considered gaming-grade, and such a monitor is suitable even for the most demanding gamers and esports professionals. If the input lag falls between 16-32 ms (between 1-2 frames of lag at 60 Hz), the monitor is suitable for almost everyone but the most hardcore gamers, especially if they're playing first-person shooters on a professional level. Finally, if a monitor's input lag is higher than 32 ms (over 2 frames of lag at 60 Hz), even casual gamers should be able to notice it. Will they be bothered by it? Not necessarily, but I can't recommend a screen like that for serious gaming.
Here's how the INNOCN PU15-PRE holds up in terms of input lag.

After doing 100 iterations of the LDAT-powered input lag test, the INNOCN PU15-PRE shows an average input lag of 46.3 milliseconds, making it a poor choice for any kind of more demanding gaming. Experienced users will notice a high input lag even when moving the cursor around the screen in Windows. While it doesn't pose much of a problem when browsing the internet and using the PU15-PRE for work, a desirable gaming monitor this is not.
Jun 10th, 2024 19:22 EDT
change timezone
Latest GPU Drivers
New Forum Posts
- Hogwarts Legacy (1)
- Starfield discussion thread (1641)
- The Filthy, Rotten, Nasty, Helpdesk-Nightmare picture clubhouse (2643)
- Help! Black Screen When I Close Certain Games (R9 290) (52)
- Question about bios flash (8)
- 9900X3D - Will AMD solve the split CCD issue (198)
- Simple measurement of RADIATOR PERFORMANCE (58)
- Temp Limiter at 77C on my 3080 (2)
- my computer hit a wall and cant move data (47)
- Acer Nitro 5 Extreme Overheating - Tried Everything, Don't Know What To Do (2)
Popular Reviews
- Pulsar Xlite V3 Review
- Intel Lunar Lake Technical Deep Dive - So many Revolutions in One Chip
- Upcoming Hardware Launches 2024 (Updated May 2024)
- NZXT H6 Flow RGB Review
- AQIRYS HYDRA 360 AIO Review
- AMD Ryzen 7 7800X3D Review - The Best Gaming CPU
- Thermal Grizzly KryoSheet Review - Tested on RX 7900 XTX with 475 W
- Ghost of Tsushima Performance Benchmark Review - 35 GPUs Tested
- Kioxia Exceria Plus G3 2 TB Review
- ASUS Radeon RX 7900 GRE TUF OC Review
Controversial News Posts
- AMD RDNA 5 a "Clean Sheet" Graphics Architecture, RDNA 4 Merely Corrects a Bug Over RDNA 3 (144)
- NVIDIA RTX 5090 "Blackwell" Founders Edition to Implement the "RTX 4090 Ti" Cinderblock Design (118)
- AMD Zen 5 Storms into Gaming Desktops with Ryzen 9000 "Granite Ridge" Processors (100)
- Biden Administration to Revive Trump-Era Tariffs on China-made GPUs and Motherboards (95)
- ASRock Innovates First AMD Radeon RX 7000 Graphics Card with 12V-2x6 Power Connector (94)
- AMD Ryzen 9000 Zen 5 Single Thread Performance at 5.80 GHz Found 19% Over Zen 4 (92)
- AMD Ryzen 9000 Zen 5 "Granite Ridge" Desktop Processors Launch Late-July (83)
- AMD to Discontinue Windows 10 Support for its Ryzen 9000 "Strix Point" Mobile Processors (82)