 22
Kingston Fury Beast DDR5-6000 32 GB CL40 Review
Intel 13900K Frametime Analysis: Baldur's Gate 3 »Frametime Analysis
We present a more in-depth analysis than just average FPS to show how the framerate changes over time, which helps highlight FPS drops. Minimum FPS at both the 95th and 99th percentile are reported in these charts, too. A second chart, a histogram, shows shape and spread for the frametime data—how tightly grouped the measurements are. The "IQR" result is called "Interquartile Range," which is an outlier-resistant statistical value that tells us the range in the middle of the frametime distribution.In the following charts, we are comparing two retail memory kits. By doing so, the game benchmarks reveal where the limits lie for a top of the line AMD or Intel computer in 2025. For both memory kits, the respective EXPO/XMP profiles are loaded, and all sub-timings are based on those individual profiles. These are not adjusted further.
Tests are conducted with the following components:
CPU: Intel Core i9-13900K (Locked P-cores @ 5.5 GHz, E-cores @ 4.3 GHz)
GPU: PNY GeForce RTX 4090 XLR8 VERTO
Memory (1): Kingston Fury Beast DDR5-6000 32 GB KF560C40BB-1 (40-40-40-80-145) (XMP)
Memory (2): DDR5-7200 32 GB (34-46-46-116) (XMP)
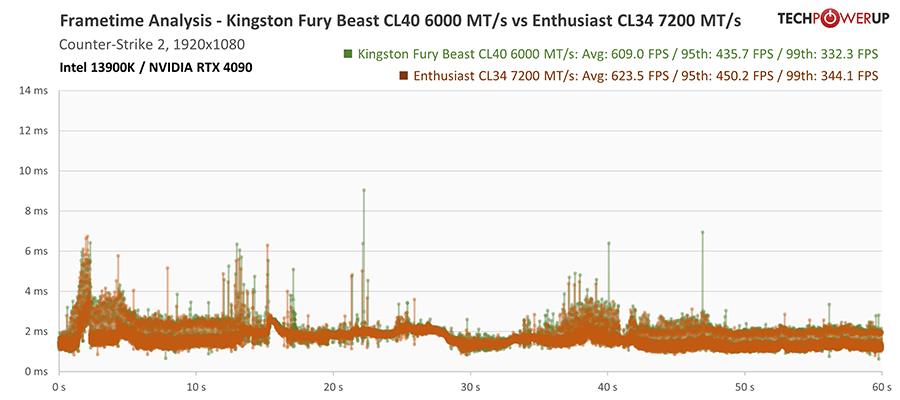
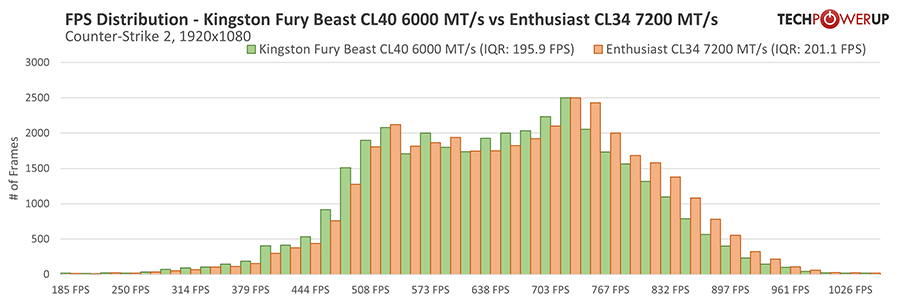
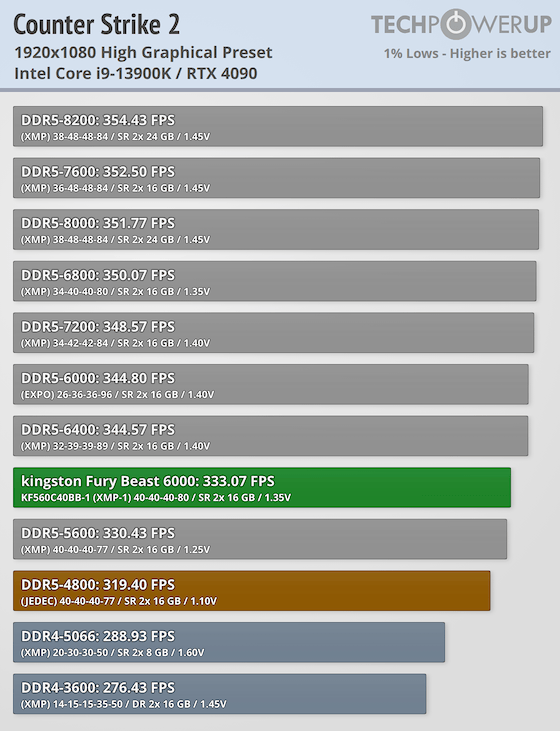
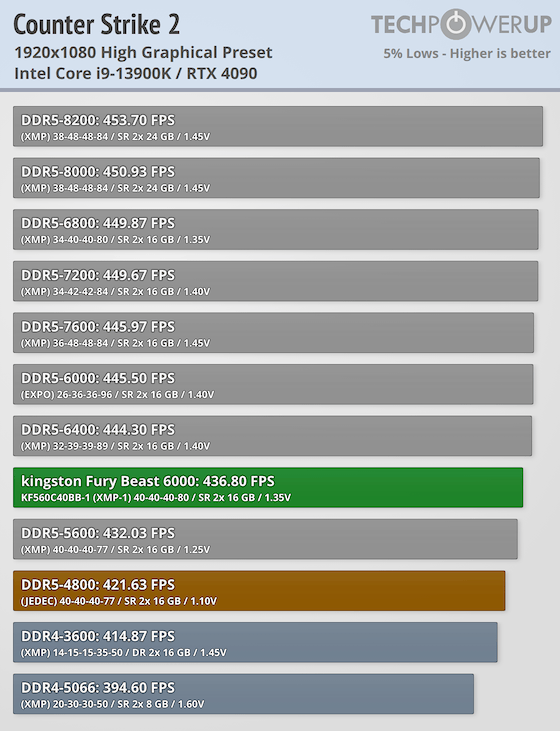
Counter-Strike 2 thrives on higher memory bandwidth, especially on Intel's Socket 1700 platform, and remains largely unaffected by latency when it comes to average frame rates. That said, latency still matters, particularly at the 95th and 99th percentiles where lower latency delivers smoother, more consistent performance. In some cases, a memory kit with a slightly lower frequency, but tighter timings can be a higher performer, proving that timing efficiency can sometimes trump raw speed. However, here the Kingston Fury Beast CL40 memory is near the bottom of the charts, mostly due to higher primary timings.
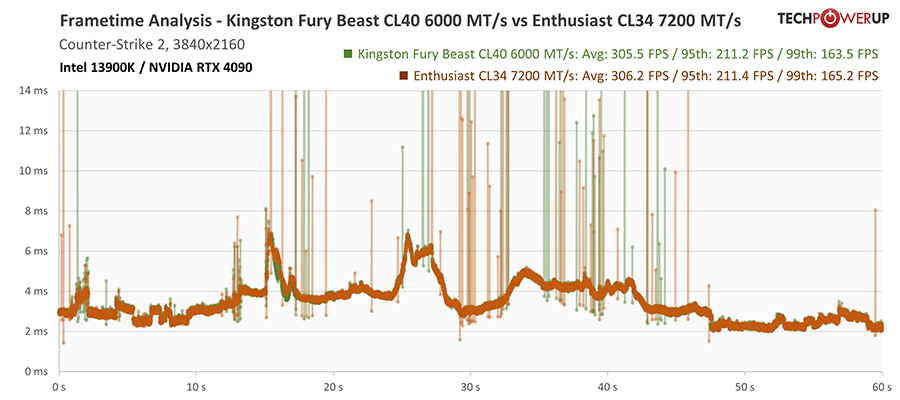
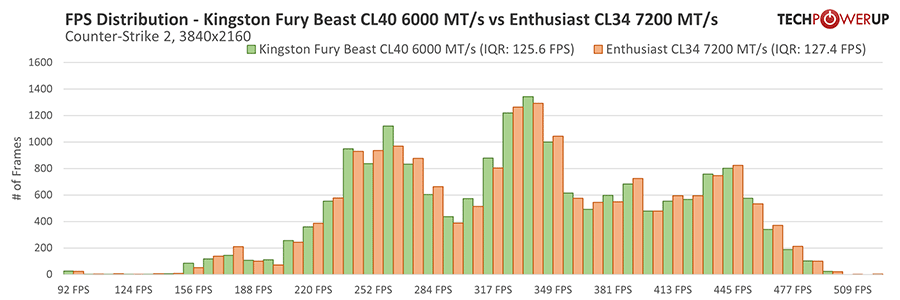
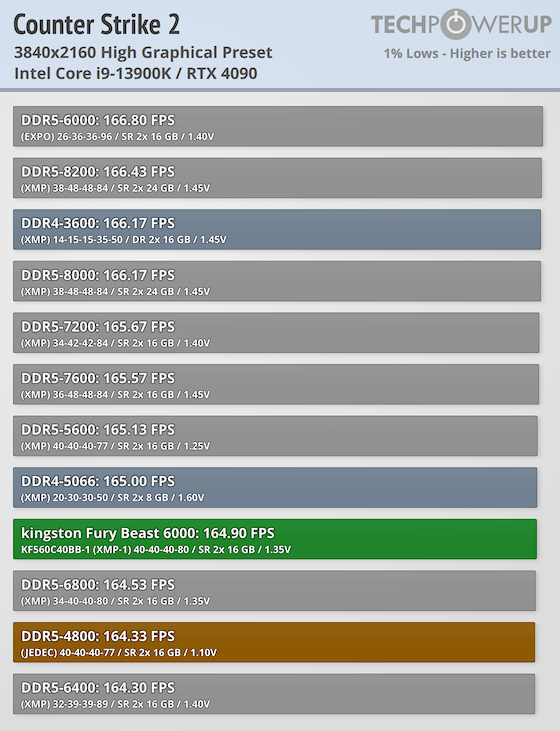
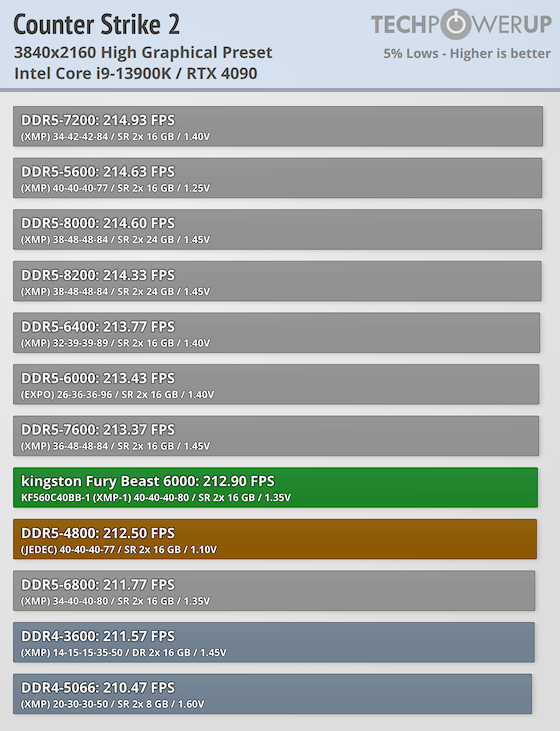
Lastly, at 4K, we start to become GPU-bound, putting all the memory kits within margin of error.
Nov 20th, 2026 17:35 PST
change timezone
Latest GPU Drivers
New Forum Posts
- SATA drive 1.4 GBps with Intel X25-E on Windows 98! (36)
- DTS DCH Driver for Realtek HDA [DTS:X APO4 + DTS Interactive] (2816)
- Honestly, do you care about GTA VI? (214)
- Without Jensen, PC gaming will be (51)
- WarpCoreBench scores! (86)
- What's your latest tech Freebie? (80)
- Nvidia GPU undervolting via MVolt+? (0)
- How to prevent OLED burn damage due to PC freezes or power outtages? (49)
- RX 9000 series GPU Owners Club (2249)
- Logitech Headsets Modded Driver — Unlock Dolby in G HUB (23)
Popular Reviews
- Microsoft Surface Laptop Ultra Review - The Next-gen Arm Laptop
- Ugreen NASync DXP4800 GT Review
- Corsair RM1200e (Second Generation) Review
- Pulsar Office Tour & First Look at P1 Dual-Sensor Mouse
- Upcoming Hardware Launches 2027 (Updated Nov 2026)
- Acemagic Retro X3 Review
- Biwin Black Opal NV7400 2 TB Review
- AMD Ryzen 7 9800X3D Review - The Best Gaming Processor
- AMD Zen 6 Technical Deep Dive
- Chieftec Iceberg PRO 360 DARK Review
TPU on YouTube
Controversial News Posts
- NVIDIA Co-Founder and CEO Jensen Huang Officially Resigns (491)
- Report: Jensen Huang Eyes NVIDIA Comeback (256)
- Open Letter Asking NVIDIA to Reinstate Jensen Huang Passes 115,000 Signatures (184)
- OpenAI CEO Argues Home PCs Waste the World's Limited DRAM Supply (152)
- NVIDIA Launches Investigation Into Jensen Huang's Relationship With Suspected Chinese Spy (136)
- Intel "Raptor Lake Next" 16-Core and 20-Core CPUs Surface (130)
- Legendary Game Studio BioWare Shuts Down Following EA Layoffs (104)
- NVIDIA GeForce RTX 50-Series Scheduled for up to $500 Price Hike This Week (89)