 32
MSI Claw 8 EX AI+ CG3EM Review - Panther Lake FTW
Daily Use Impressions »Power Scaling (Shadow of the Tomb Raider, 720p, Highest preset, DX12, TAA)
We wanted to find out how gaming performance varies under different power limits. By setting specific limits, we measured the console's performance and plotted the results on a chart. This data is also compared to several competing alternatives to provide a comprehensive view of how each device balances power consumption and performance.The second chart shows the total power consumption of each handheld used in our power scaling test. The power data was sourced from the inbuilt performance overlay (SteamOS) and HWiNFO (Windows).
Note that all devices use LCD panels.
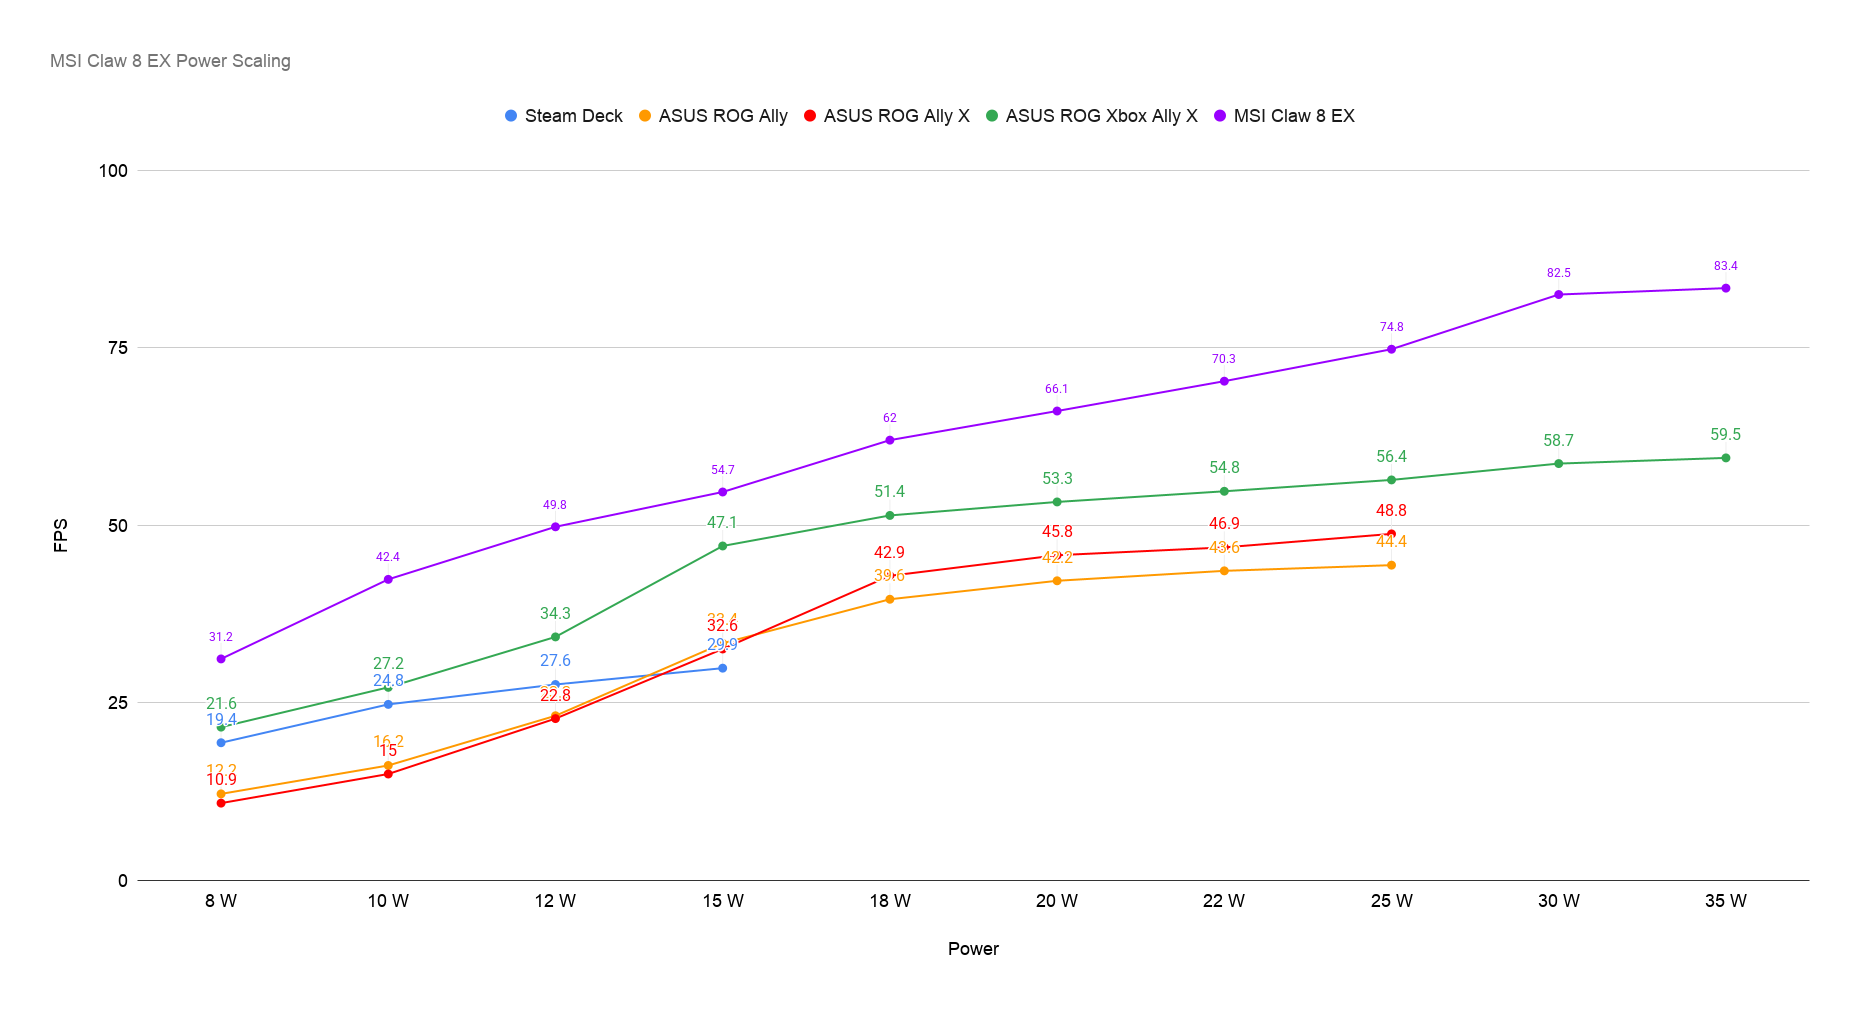
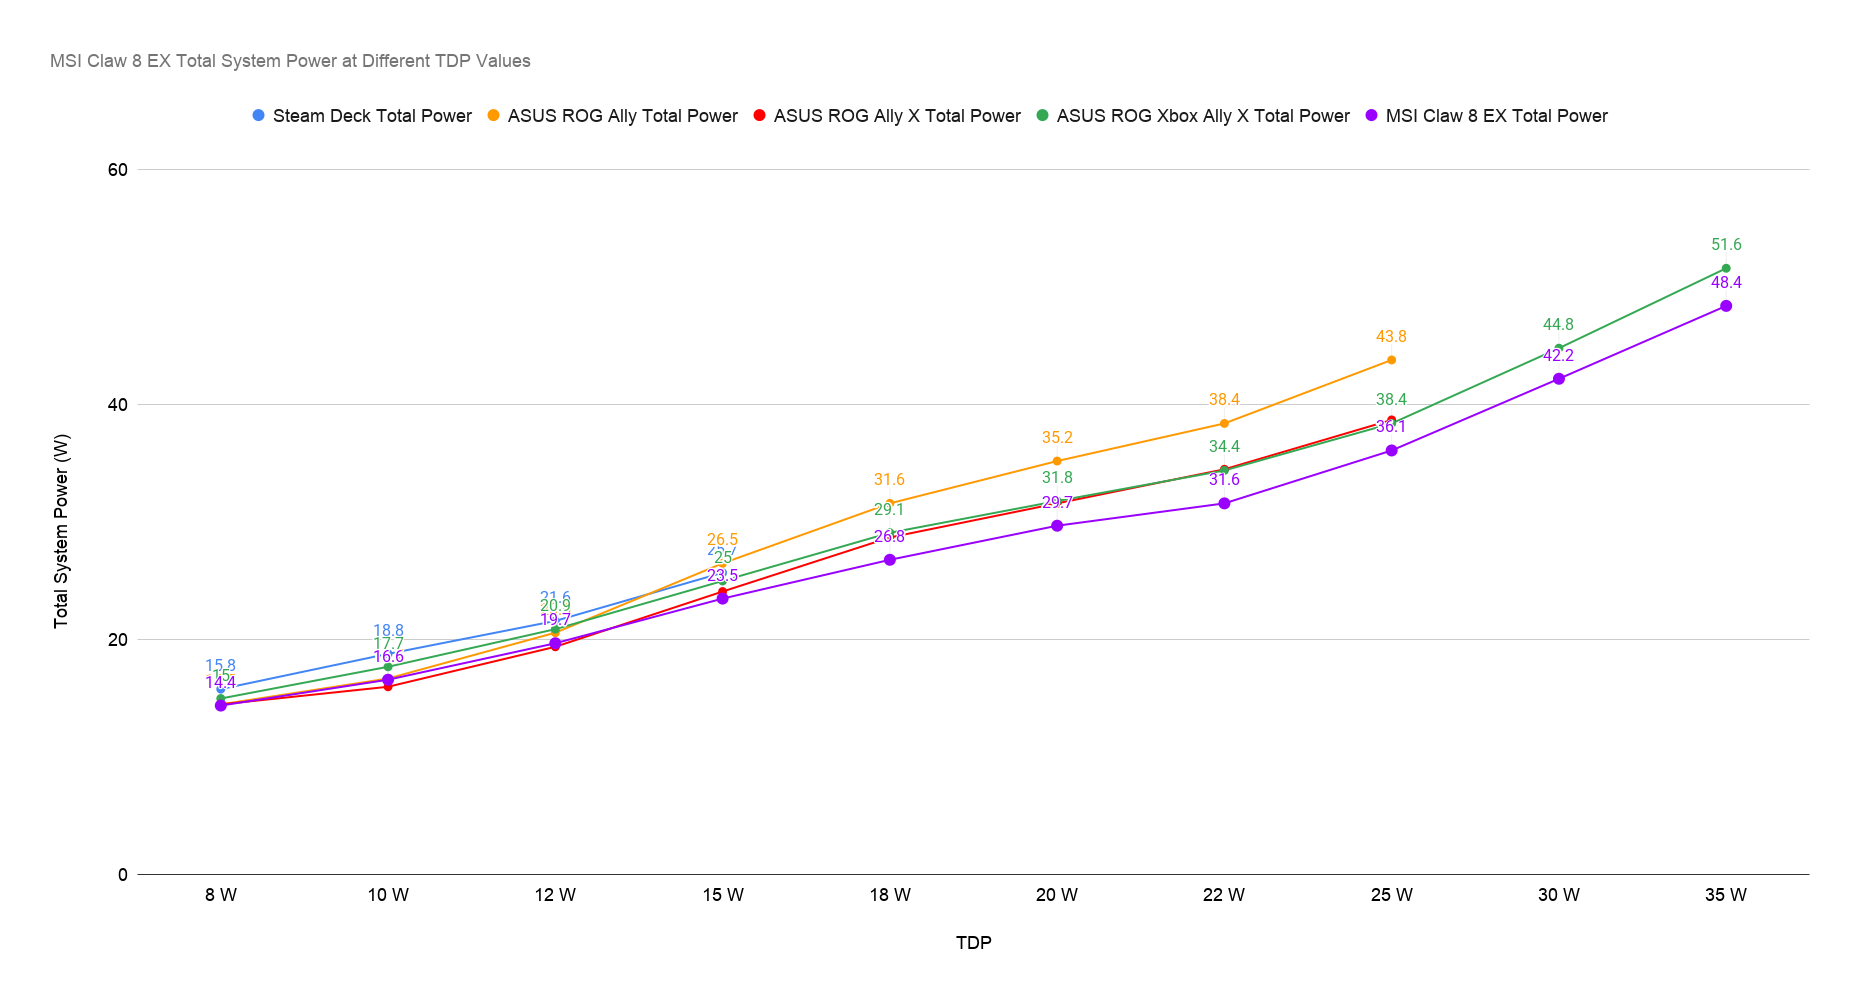
The graphs show that the G3 Extreme achieved a resounding victory over every other chip at every power level while also using less total power at every TDP setting, another impressive showing. The power level at which the G3 Extreme comes closest to the Z2 Extreme is 15 W, where it's only 15% faster than AMD's APU.
We also like the fact that the G3 Extreme has quite steady performance scaling across its entire TDP range, slowing down only at 35 W. In other words, you can run the MSI Claw 8 EX at 30 W instead of 35 W for maximum performance because the gains from jumping from 30 W to 35 W are negligible, at least in the case of SoTR.
If you look closely at the first chart, you can also notice that the chip has three "sweet spots" across its TDP range: 10 W, 18 W, and 30 W, with it being faster at 18 W than the Z2 Extreme is at 35 W.
Nov 11th, 2026 17:19 CST
change timezone
New Forum Posts
- WarpCoreBench scores! (13)
- Warning for Windows 10 and 11 users running newer AMD GPU drivers (49)
- Bought MAX-P495 - Which model? (29)
- GeekMagic Ultra Smart WiFi Weather Station (3)
- DTS DCH Driver for Realtek HDA [DTS:X APO4 + DTS Interactive] (2809)
- Rare GPUs / Unreleased GPUs (2271)
- Samsung 870 EVO - Beware, certain batches prone to failure! (1486)
- Windows new update 26H2 - Throttlestop (10)
- When you could finally run Crysis maxed out? (42)
- TPU's F@H Team (20569)
Popular Reviews
- AMD Zen 6 Technical Deep Dive
- Upcoming Hardware Launches 2027 (Updated Nov 2026)
- Gigabyte Z890I Aorus Ultra Review
- XPG NIMBUS PLUS Review - Mid-range Chair With Strong Competitors
- INNOCN 45C1R Review - Two QHD Screens, Zero Bezels
- NZXT H7 RGB+ Review
- Phantom Blade Zero Performance Benchmark Review - 35 GPUs Tested
- Gears of War: E-Day Performance Benchmark Review - 35 GPUs Tested
- NZXT H5 Review
- be quiet! Light Mount TKL Keyboard Review
TPU on YouTube
Controversial News Posts
- OpenAI CEO Argues Home PCs Waste the World's Limited DRAM Supply (152)
- NVIDIA Launches Investigation Into Jensen Huang's Relationship With Suspected Chinese Spy (136)
- Intel "Raptor Lake Next" 16-Core and 20-Core CPUs Surface (130)
- Legendary Game Studio BioWare Shuts Down Following EA Layoffs (104)
- Dell CEO Says the Memory Shortage Will Get Worse in 2027 (95)
- NVIDIA GeForce RTX 50-Series Scheduled for up to $500 Price Hike This Week (89)
- Modder Fits RTX 5090 With Four 8-Pin Connectors, Halving Current per Wire (80)
- AMD Radeon Owners Can Now Run Nearly Every DLSS Feature Through Fan-Made Mod (80)