 13
Patriot Viper Elite 5 RGB DDR5-7000 32 GB CL38 Review
Intel 13900K Frametime Analysis: Baldur's Gate 3 »Frametime Analysis
We present a more in-depth analysis than just average FPS to show how the framerate changes over time, which helps highlight FPS drops. Minimum FPS at both the 95th and 99th percentile are reported in these charts, too. A second chart, a histogram, shows shape and spread for the frametime data—how tightly grouped the measurements are. The "IQR" result is called "Interquartile Range," which is an outlier-resistant statistical value that tells us the range in the middle of the frametime distribution.In the following charts, we are comparing two retail memory kits. By doing so, the game benchmarks reveal where the limits lie for a top of the line AMD or Intel computer in 2025. For both memory kits, the respective EXPO / XMP profiles are loaded, and all sub-timings are based on those individual profiles. These are not adjusted further.
Tests are conducted with the following components:
CPU: Intel Core i9-13900K (Locked P-core 5.5 GHz, E-cores 4.3 GHz)
GPU: PNY GeForce RTX 4090 XLR8 VERTO
Memory (1): Patriot Viper Elite 5 RGB DDR5-7000 PVER532G70C38KW (38-48-48-88) (XMP)
Memory (2): DDR5-7200 32 GB (34-46-46-116) (XMP)
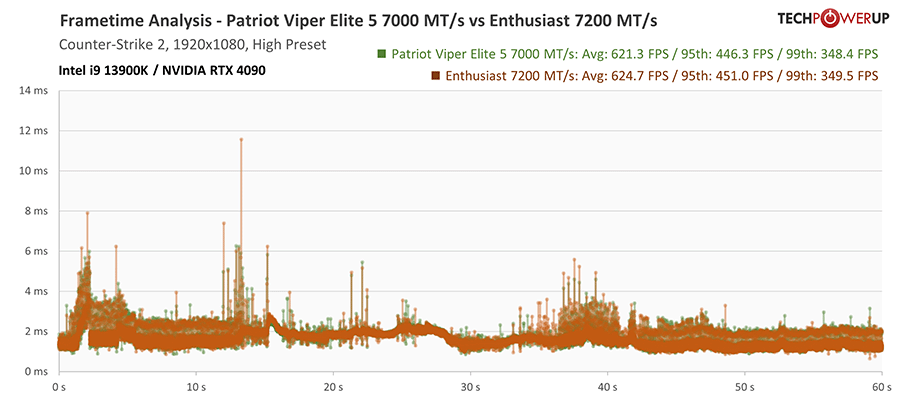
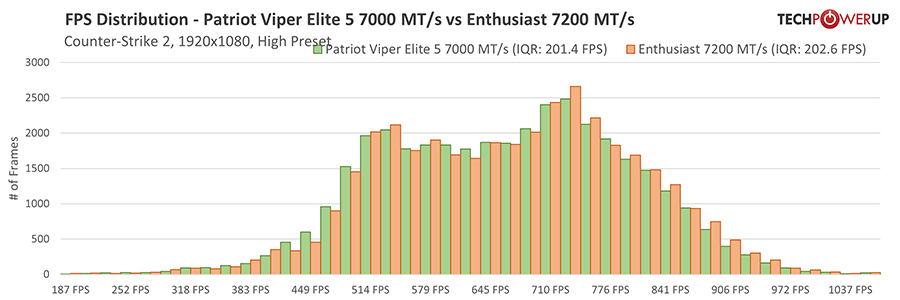
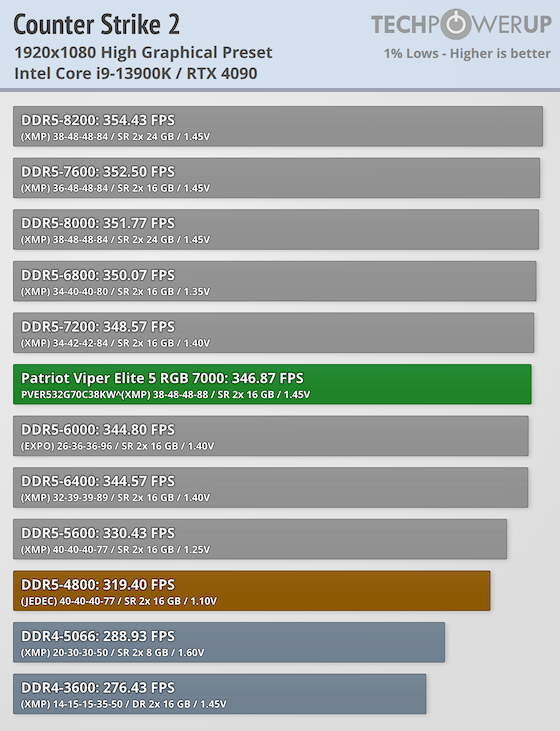
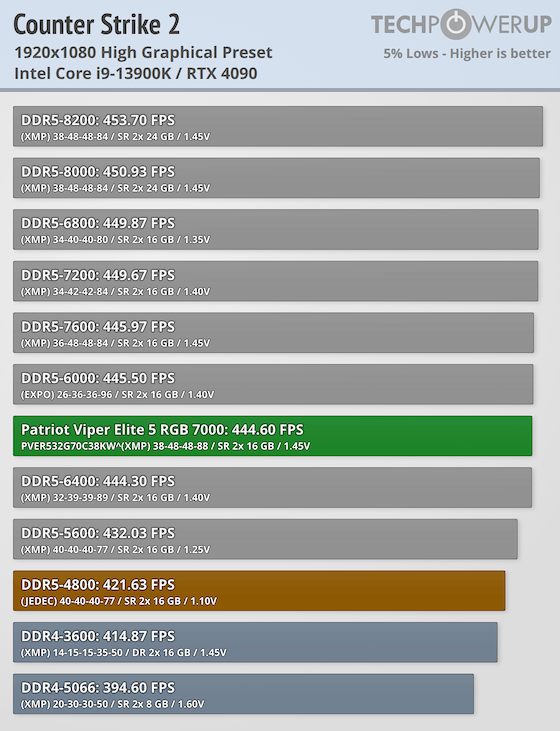
Counter-Strike 2 directly benefits from higher bandwidth on the Intel (Socket 1700) platform and is not greatly impacted by high latency for its average frame rates. However, there are exceptions to the norm. The 95th and 99th percentiles will still benefit from lower latency. If a memory kit has a lower frequency, but better timings, it can overtake even the fastest memory.
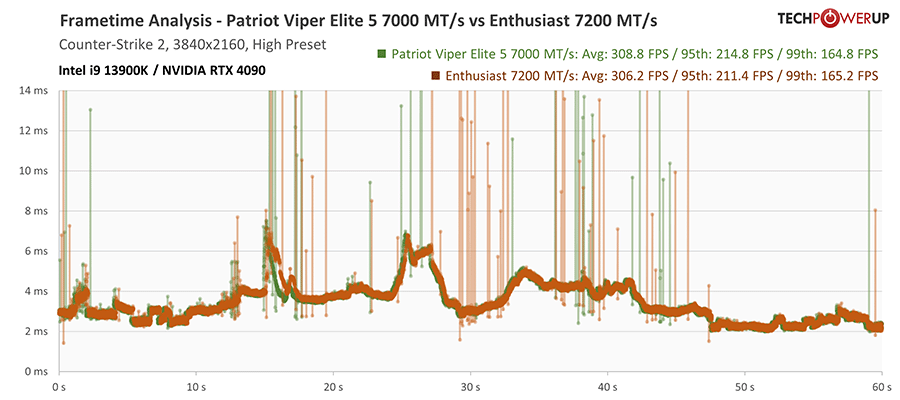
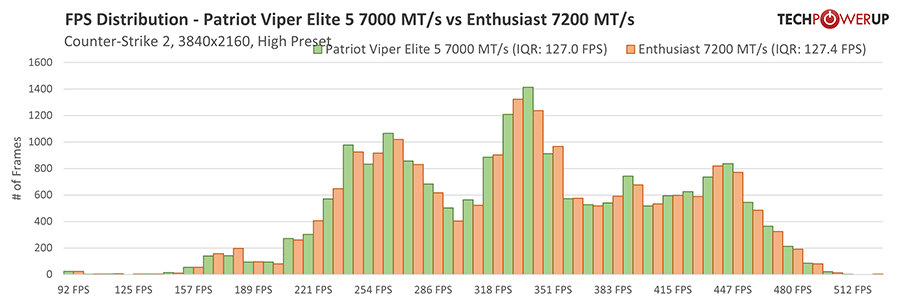
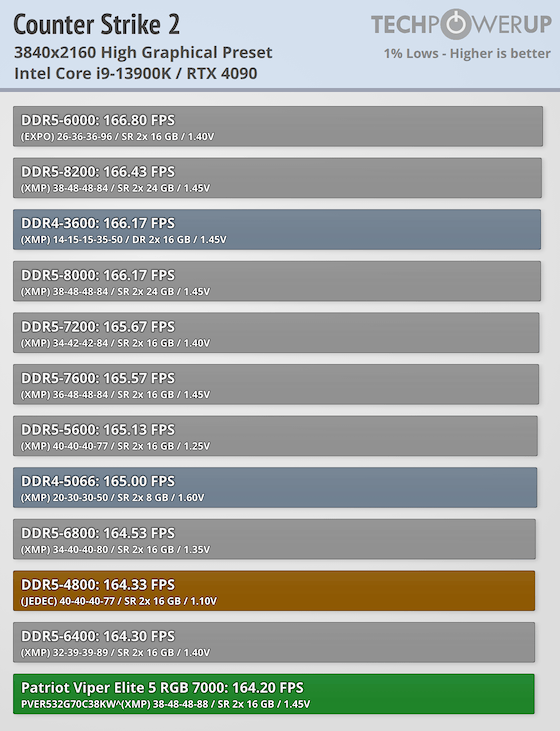
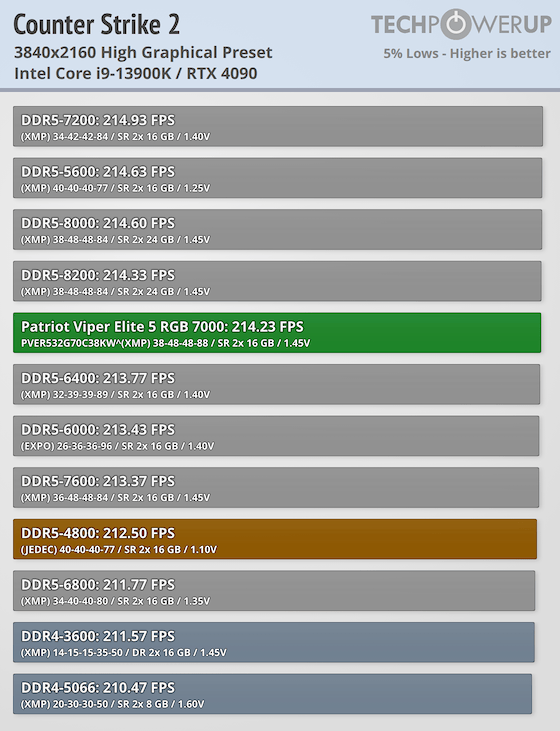
Lastly, at 4K, we start to become GPU-bound, putting all the memory kits within margin of error.
Nov 19th, 2026 16:54 CST
change timezone
Latest GPU Drivers
New Forum Posts
- Got the EOL 32GB TridentZ 6000 CL26 1.4V (13)
- TPU's Nostalgic Hardware Club (22169)
- Honestly, do you care about GTA VI? (167)
- Dell Workstation Owners Club (3517)
- Making a game in Godot engine (6)
- Introducing DST Bench : one of the most advanced disk benchmark and storage analyzer real-time software (6)
- Windows 11 General Discussion (7736)
- Current Sales, Bundles, Giveaways (10448)
- Last game you purchased? (1409)
- WarpCoreBench scores! (76)
Popular Reviews
- Acemagic Retro X3 Review
- Ugreen NASync DXP4800 GT Review
- Upcoming Hardware Launches 2027 (Updated Nov 2026)
- Pulsar Office Tour & First Look at P1 Dual-Sensor Mouse
- AMD Zen 6 Technical Deep Dive
- Biwin Black Opal NV7400 2 TB Review
- Sapphire Radeon RX 7700 XT Pure Review
- Sapphire Radeon RX 7700 XT Pulse Review
- AMD Ryzen 7 9800X3D Review - The Best Gaming Processor
- Chieftec Iceberg PRO 360 DARK Review
TPU on YouTube
Controversial News Posts
- NVIDIA Co-Founder and CEO Jensen Huang Officially Resigns (489)
- Report: Jensen Huang Eyes NVIDIA Comeback (223)
- Open Letter Asking NVIDIA to Reinstate Jensen Huang Passes 115,000 Signatures (184)
- OpenAI CEO Argues Home PCs Waste the World's Limited DRAM Supply (152)
- NVIDIA Launches Investigation Into Jensen Huang's Relationship With Suspected Chinese Spy (136)
- Intel "Raptor Lake Next" 16-Core and 20-Core CPUs Surface (130)
- Legendary Game Studio BioWare Shuts Down Following EA Layoffs (104)
- Dell CEO Says the Memory Shortage Will Get Worse in 2027 (95)