 30
Team Group GC Pro 2 TB Review
(30 Comments) »Introduction

Team Group is a well-known Taiwanese hardware manufacturer with a long history of catering to the needs of enthusiasts and gamers from all over the globe. Their lineup includes DRAM memory and solid-state drives, and Team Group also offer various memory cards and USB thumb drives.

With the GC Pro, Team Group is introducing their second PCI-Express 5.0 solid-state-drive based on the Innogrit IG5666 controller. The first drive was the "GE Pro", today's review covers the "GC Pro". At first glance, both drives look identical, using the same controller, NAND flash and PCB layout. Unlike the GE Pro, there is no 1 TB model, which makes sense of course, and the GC Pro includes the thin Graphene heat spreader foil that we've seen from Team Group before. Digging a little bit deeper, I found out that the GC Pro clocks its controller at 500 MHz, whereas the GE Pro runs it a bit higher, at 850 MHz. In terms of NAND flash, you're getting YMTC's 232-layer 3D TLC NAND, and the two DRAM cache chips are made by Micron.
The Team Group GC Pro is available in capacities of 2 TB ($200) and 4 TB ($380). The endurance is set to 1200 TBW and 2400 TBW respectively. Team Group includes a five-year warranty with the GC Pro SSD.
| Specifications: Team Group GC Pro 2 TB SSD | |
|---|---|
| Brand: | Team Group |
| Model: | TM8FFL002T0C129 |
| Capacity: | 2000 GB (1863 GB usable) 48 GB additional overprovisioning |
| Controller: | Innogrit IG5666 |
| Flash: | YMTC 232-Layer 3D TLC X3-9070 |
| DRAM: | 2x 1 GB Hynix DDR4-3200 H5AN8G6NDJR-XNC |
| Endurance: | 1200 TBW |
| Form Factor: | M.2 2280 |
| Interface: | PCIe Gen 5 x4, NVMe 2.0 |
| Device ID: | T-FORCE TM8FFL002T |
| Firmware: | 050g0554 |
| Warranty: | Five years |
| Price at Time of Review: | $200 / $100 per TB |
Packaging
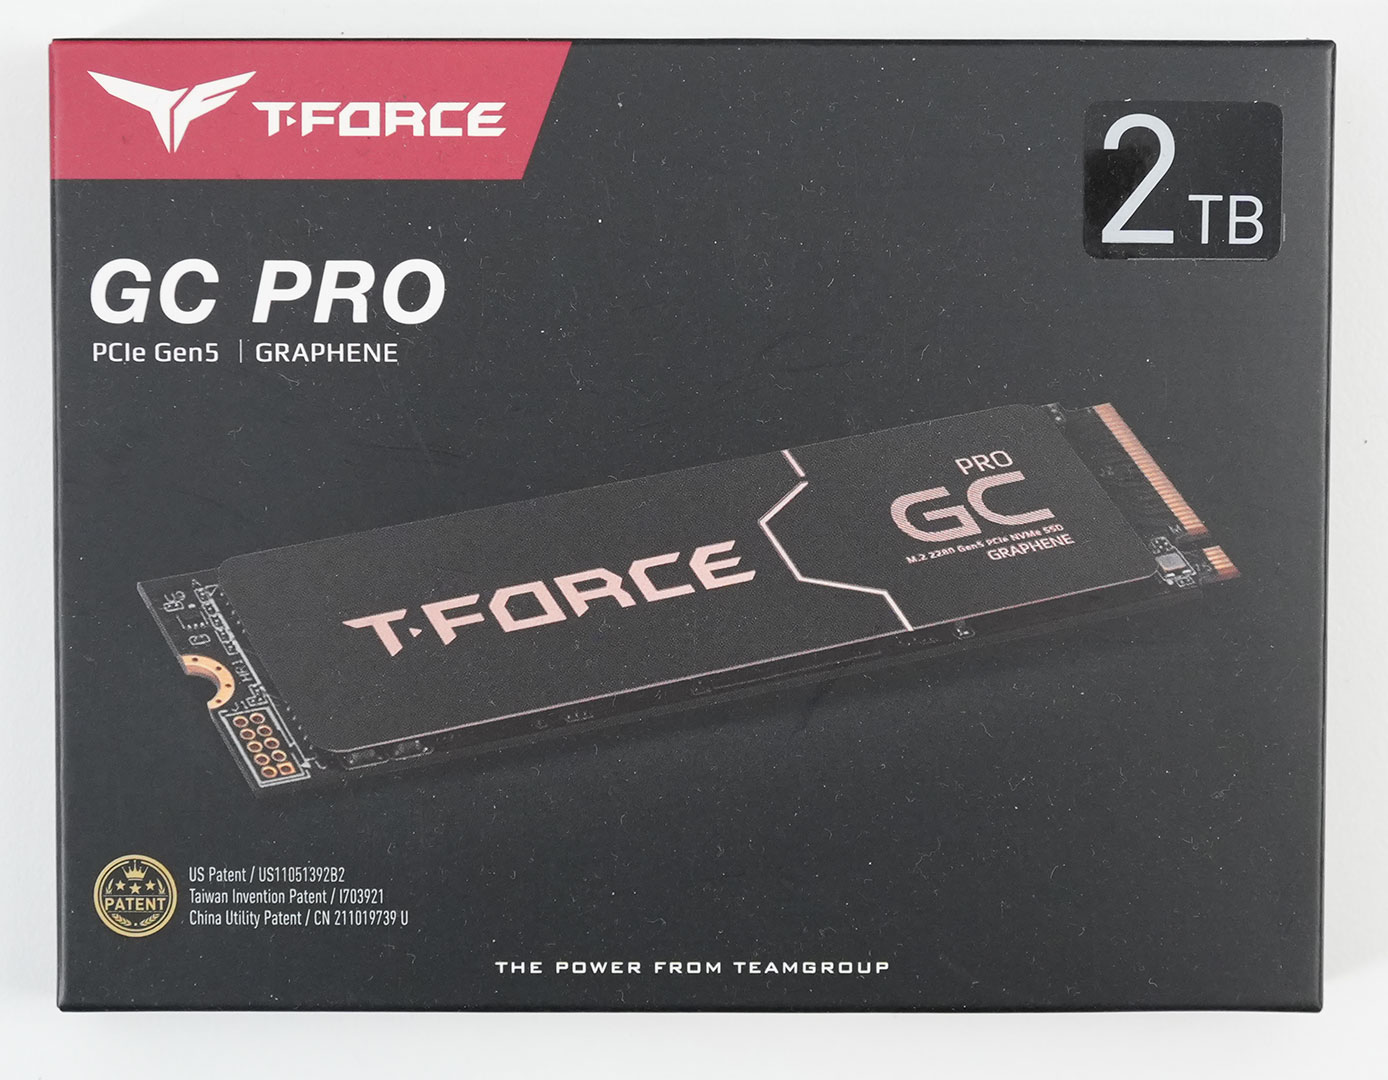
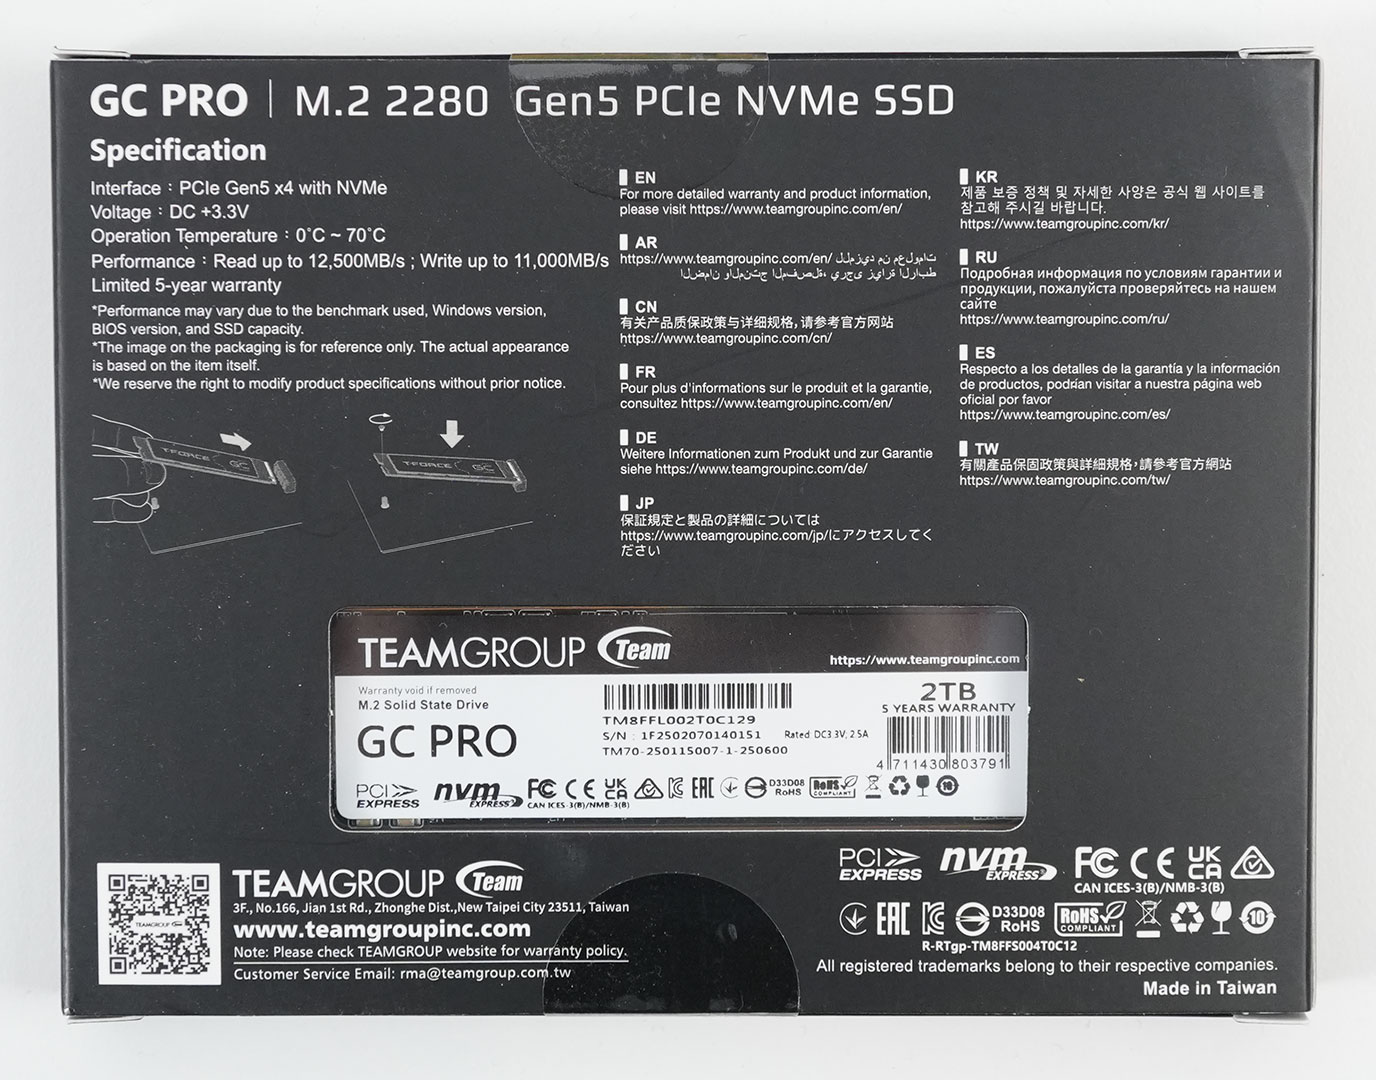
The Drive


The drive is designed for the M.2 2280 form factor, which makes it 22 mm wide and 80 mm long.
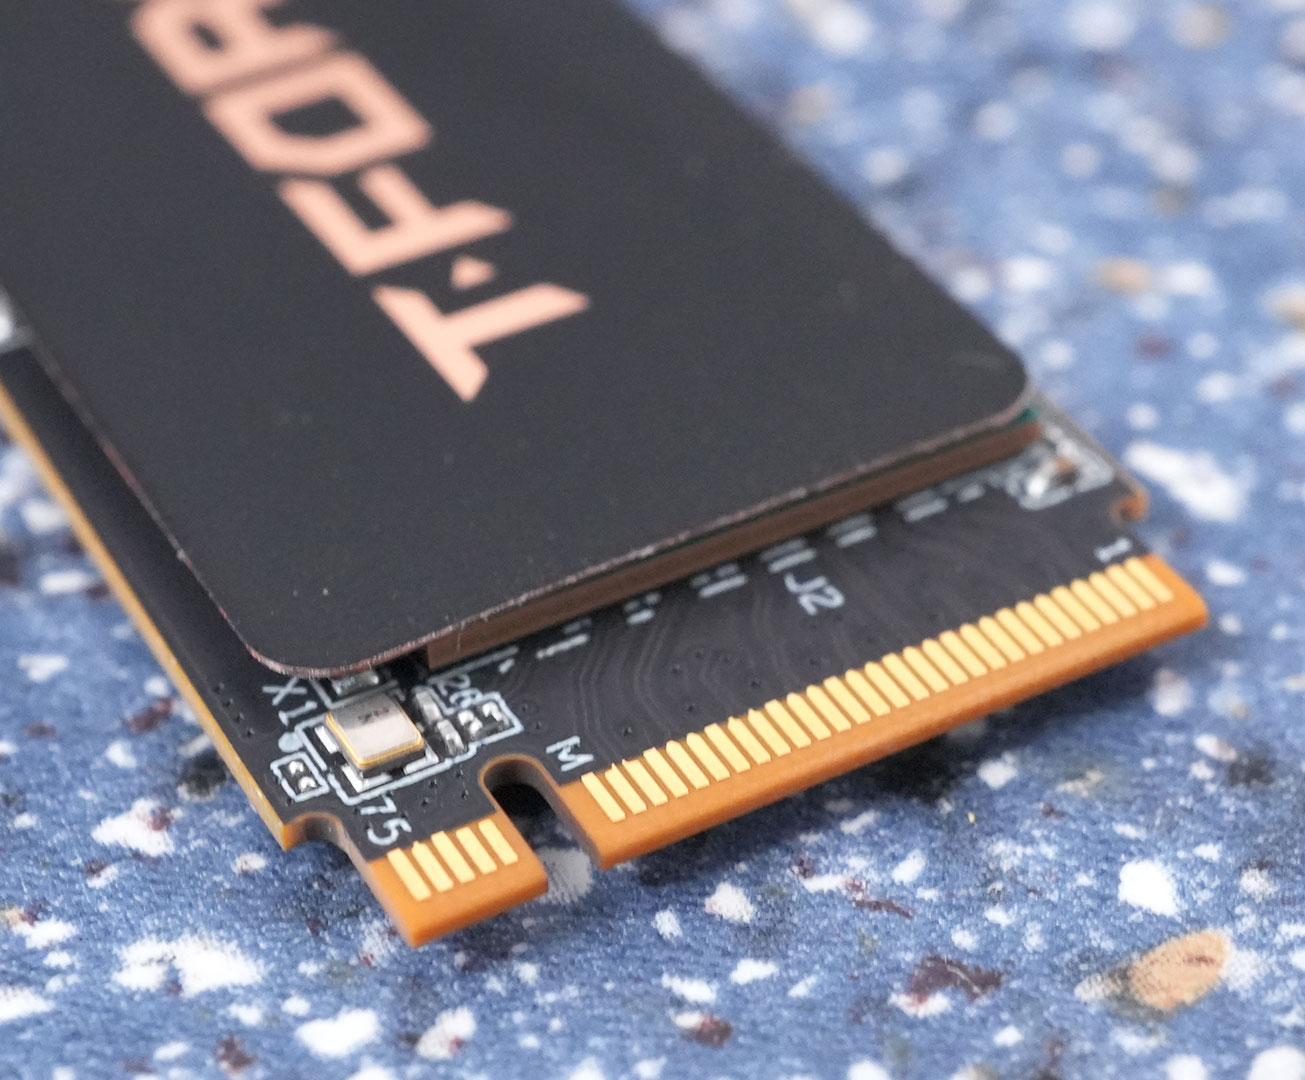
PCI-Express 5.0 x4 is used as the host interface to the rest of the system, which doubles the theoretical bandwidth compared to PCIe 4.0 x4.


On the PCB you'll find the controller and four flash chips, two DRAM cache chips are included, too.
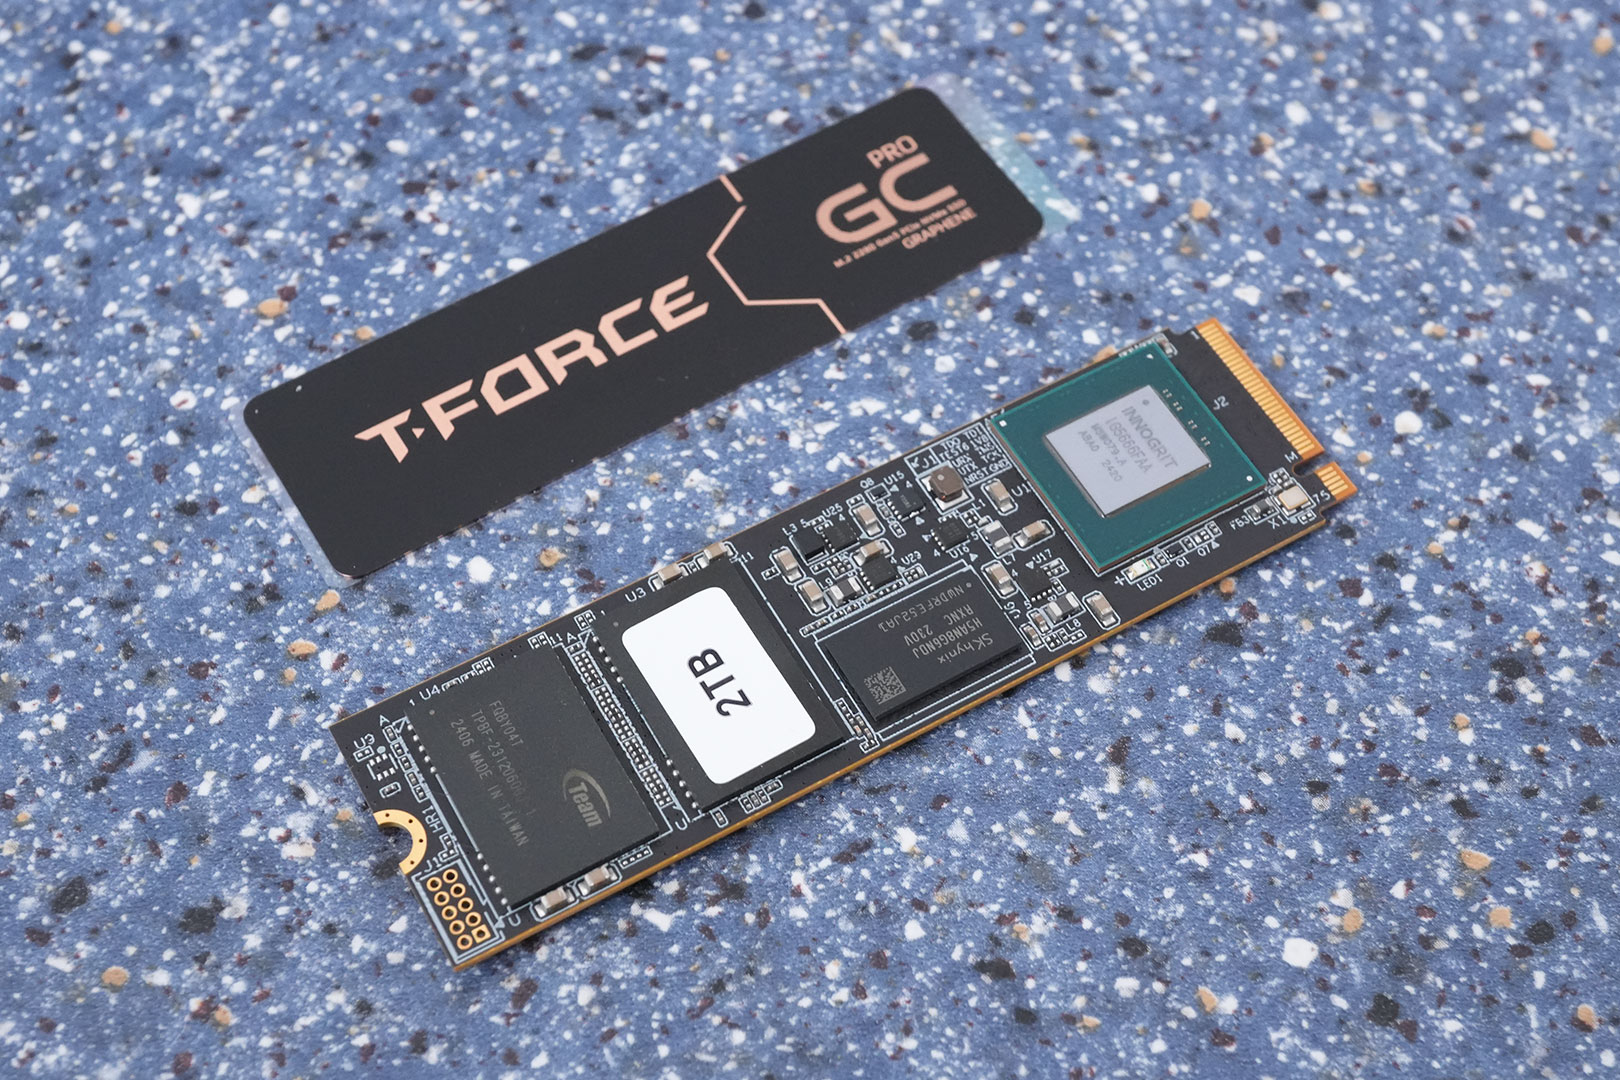
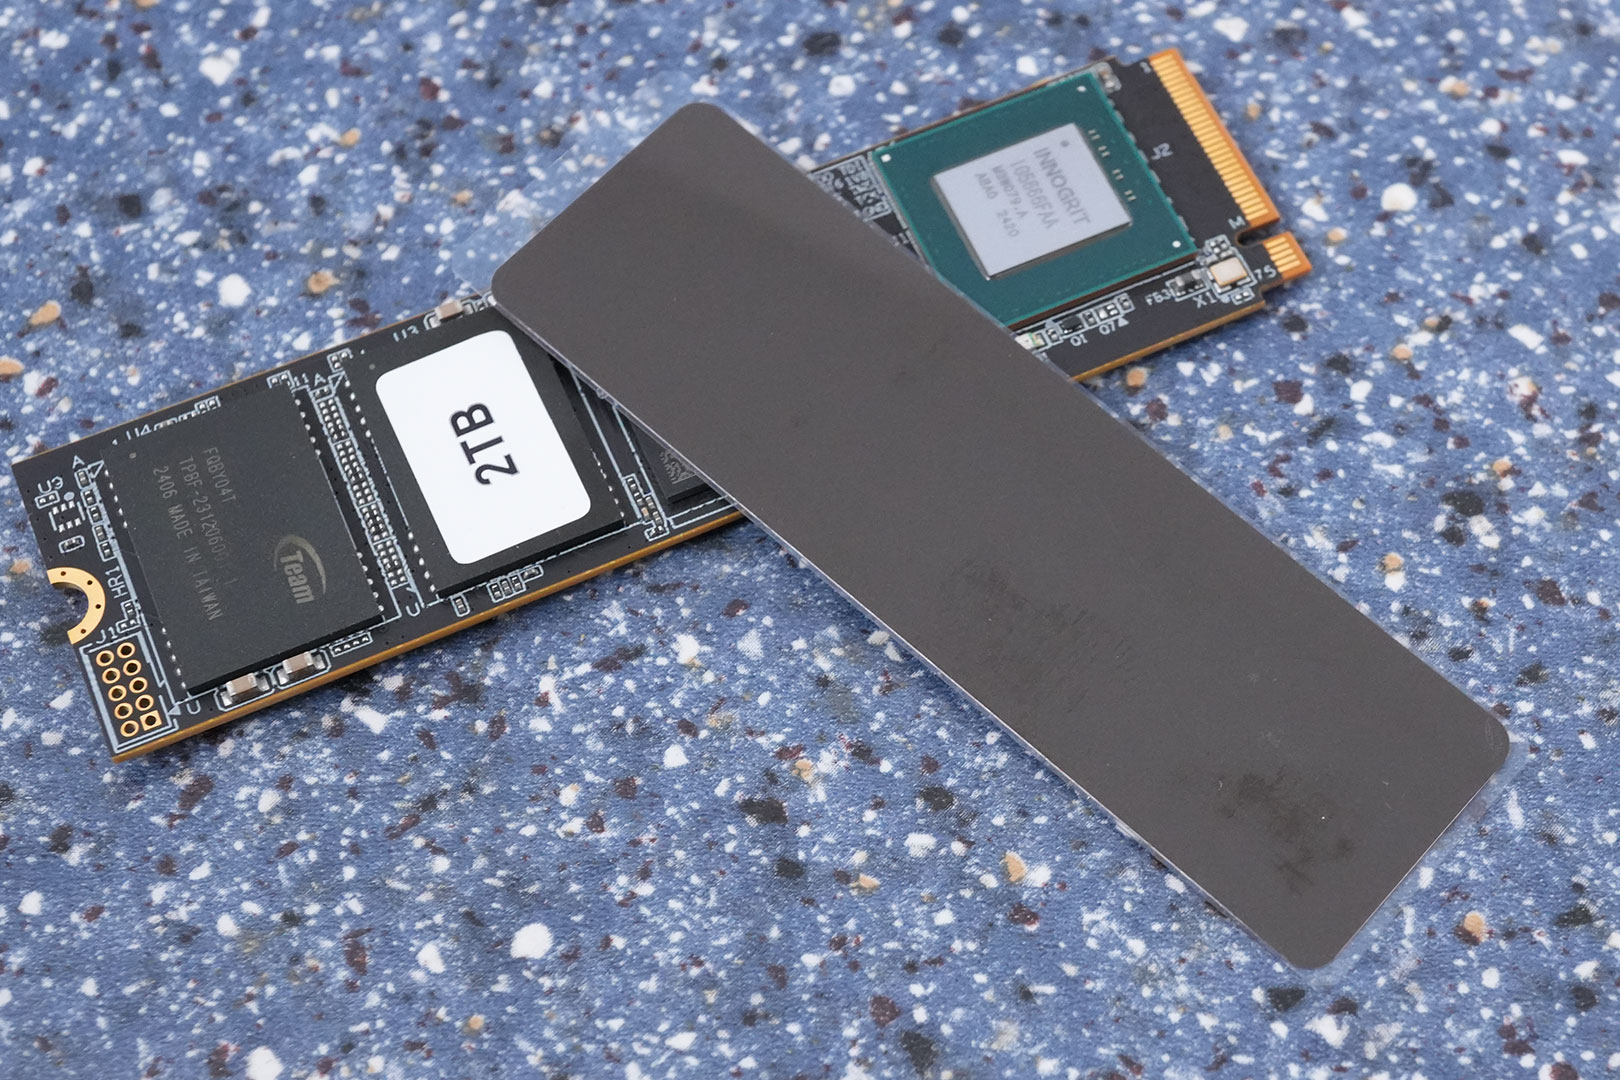

Inside the box, Team Group has included a thin heat spreader foil. It has a copper core, which helps move heat around, but its mass is low, so it can't absorb a lot of heat. Our thermal testing shows that this is much too weak and that you need serious cooling for the GC Pro.
Chip Component Analysis

The Innogrit IG5666 is the company's first client-focused PCI-Express Gen 5 controller. It comes with support for eight channels and is produced using a 12 nm process at TSMC Taiwan. Internally, the controller has eight Arm Cortex-R5 cores with NVMe 2.0 support.

The four flash chips are YMTC 232-layer 3D TLC NAND. Each chip has a capacity of 512 GB.

Two Hynix DDR4-3200 chips provide a total of 2 GB of fast DRAM storage for the controller to store the mapping tables.
Test Setup
| Test System SSD 2024 | |
|---|---|
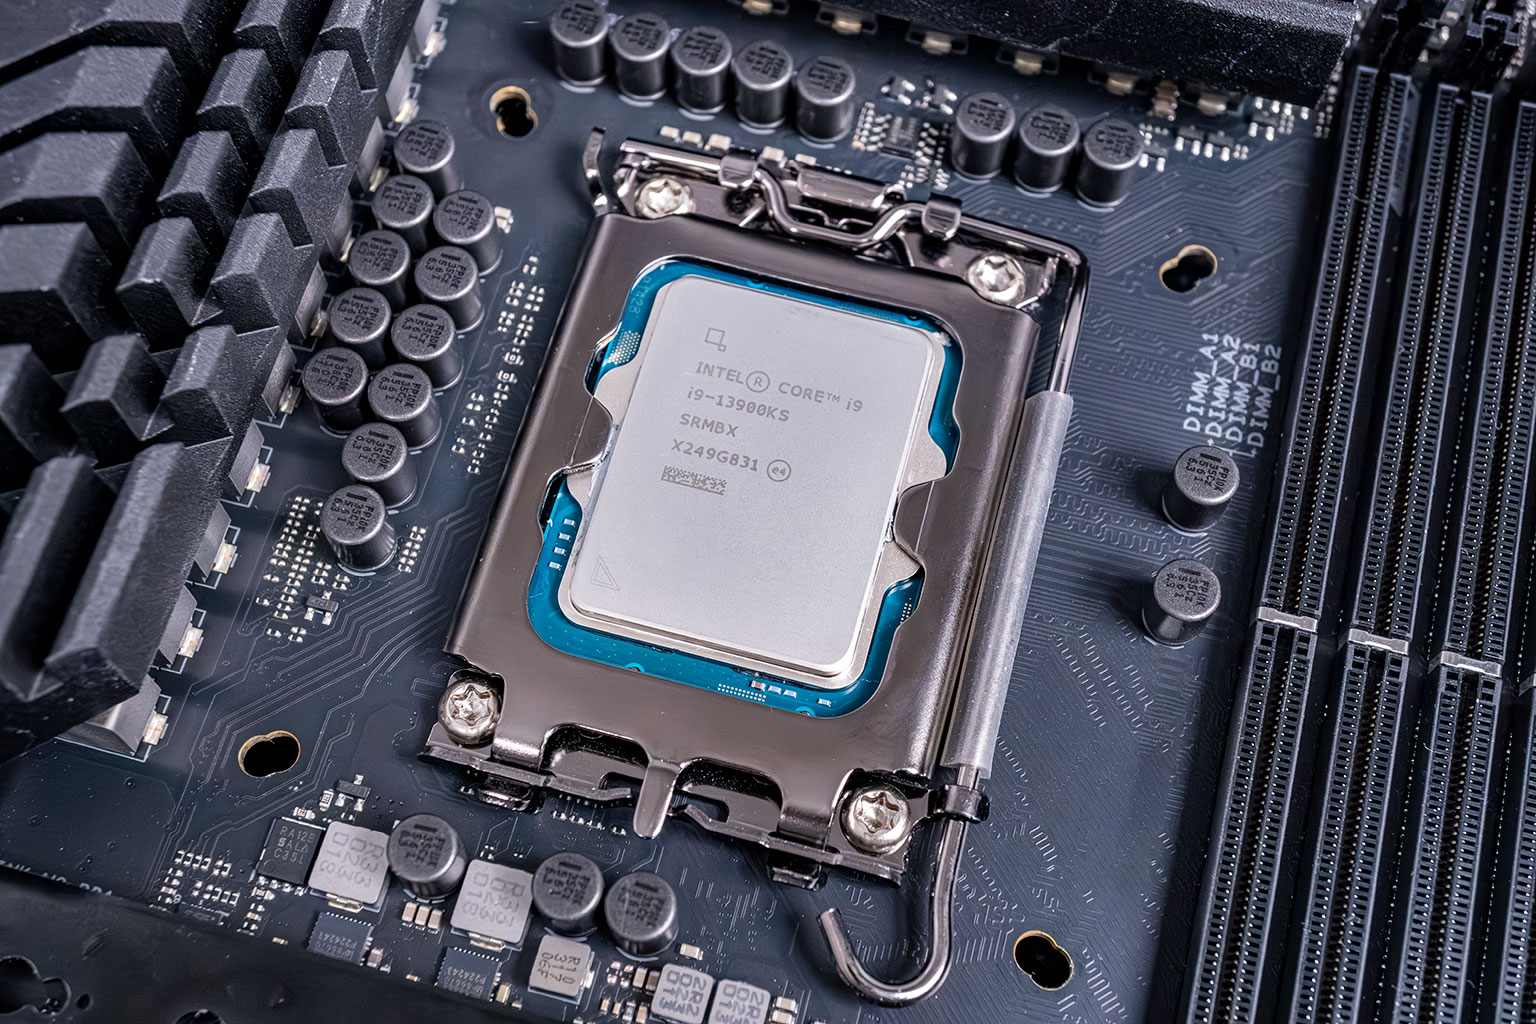
| Processor: | Intel Core i9-13900KS Raptor Lake 6.0 GHz, 8+16 cores / 32 threads |
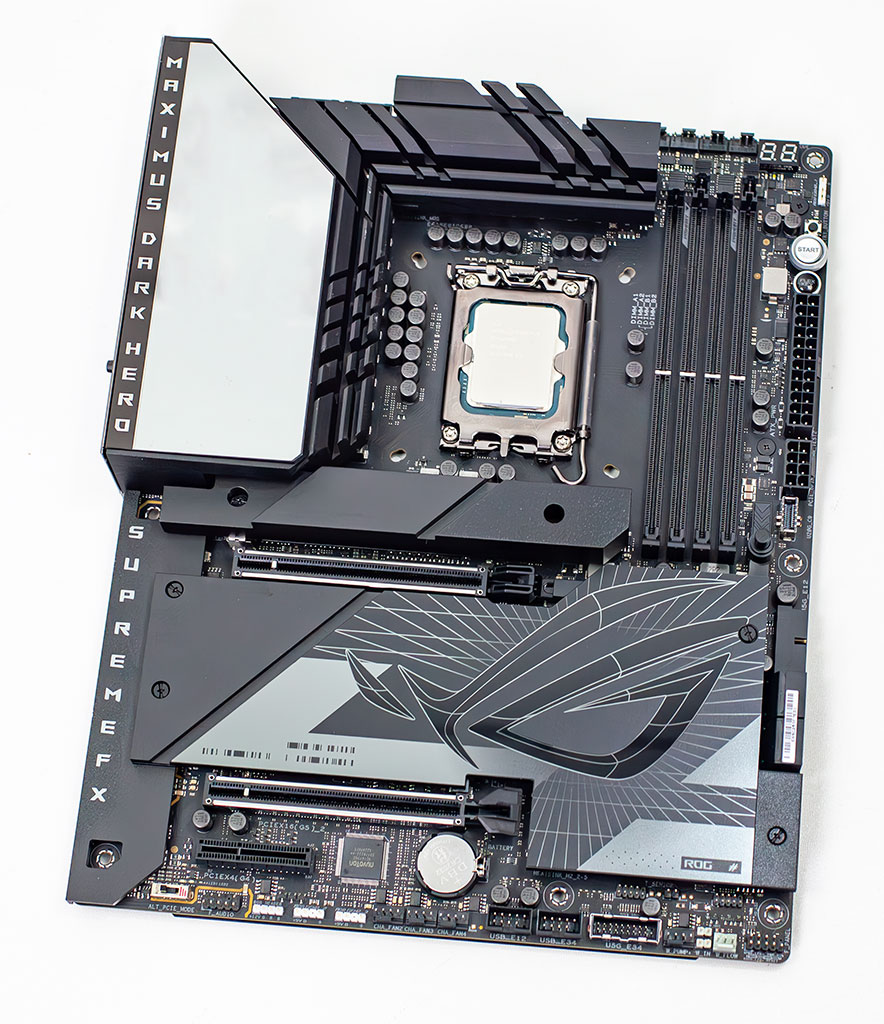
| Motherboard: | ASUS ROG Z790 Dark Hero BIOS 1102 |
| Memory: | 2x 16 GB DDR5-6000 |
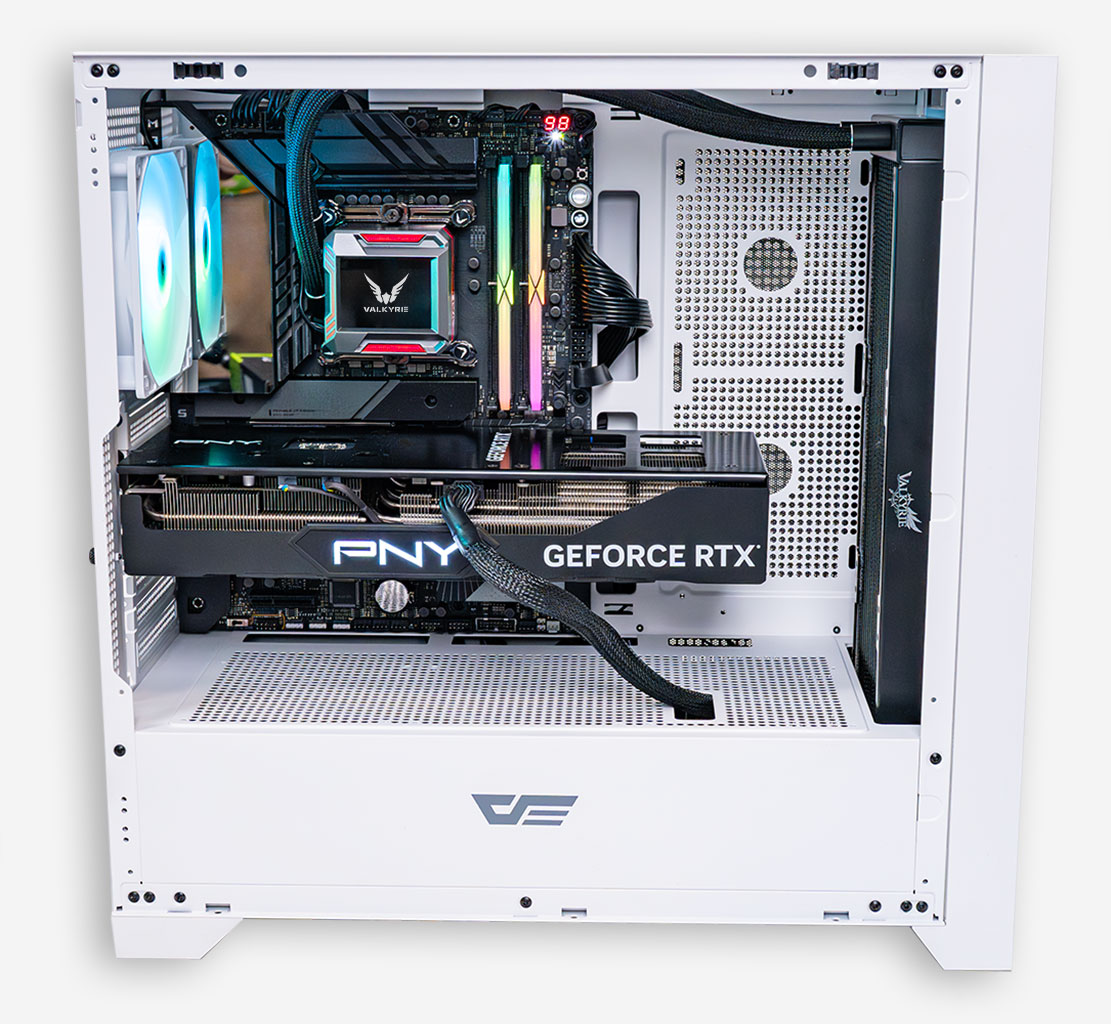
| Graphics: | PNY GeForce RTX 4080 Super Verto OC |
| Cooling: | Valkyrie Syn 360 mm AIO |
| Thermal Paste: | Arctic MX-6 |
| Power Supply: | Thermaltake Toughpower GF3 850 W ATX 3.0 / 16-pin 12VHPWR |
| Case: | darkFlash DRX70 White |
| Operating System: | Windows 11 Professional 64-bit 23H2 VBS enabled (Windows 11 default) |
| Drivers: | NVIDIA: 552.12 WHQL |

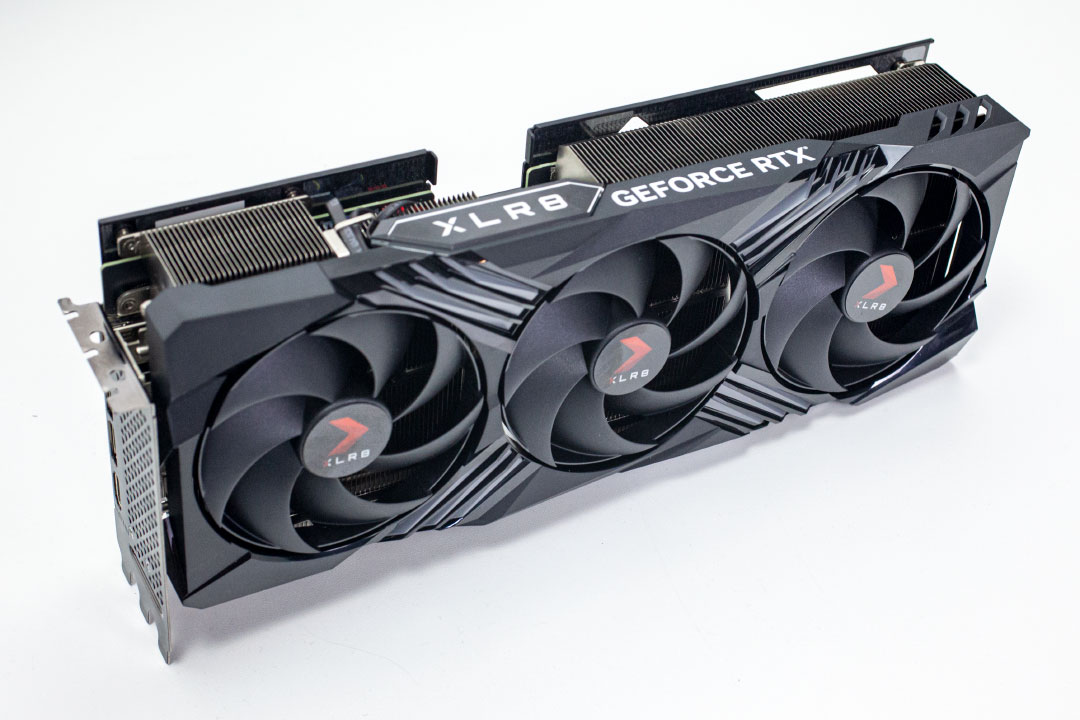
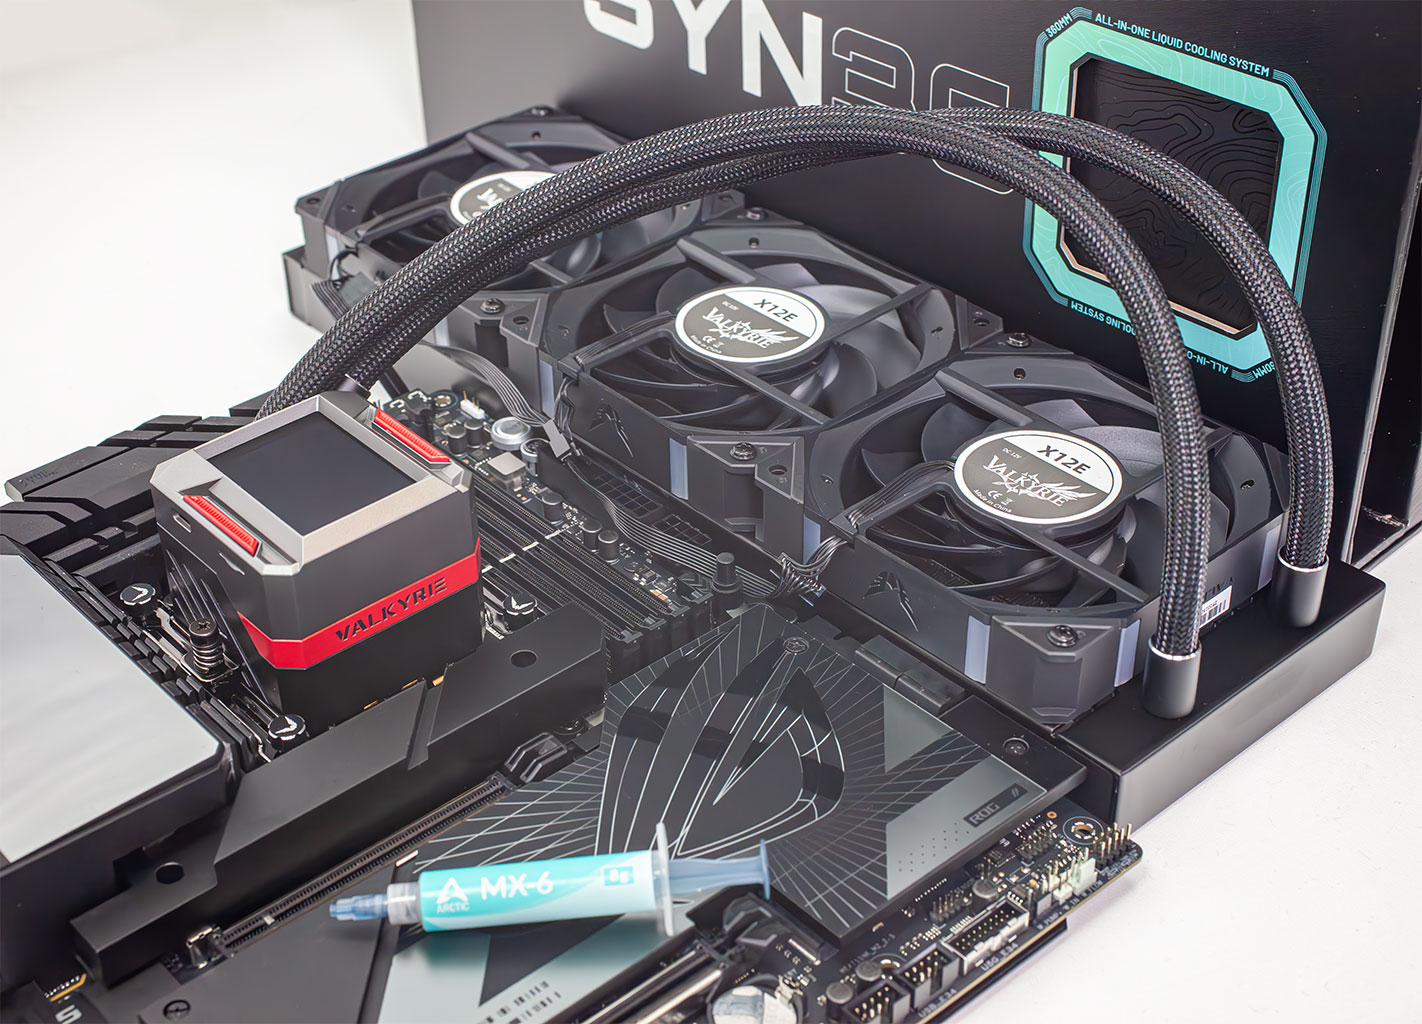
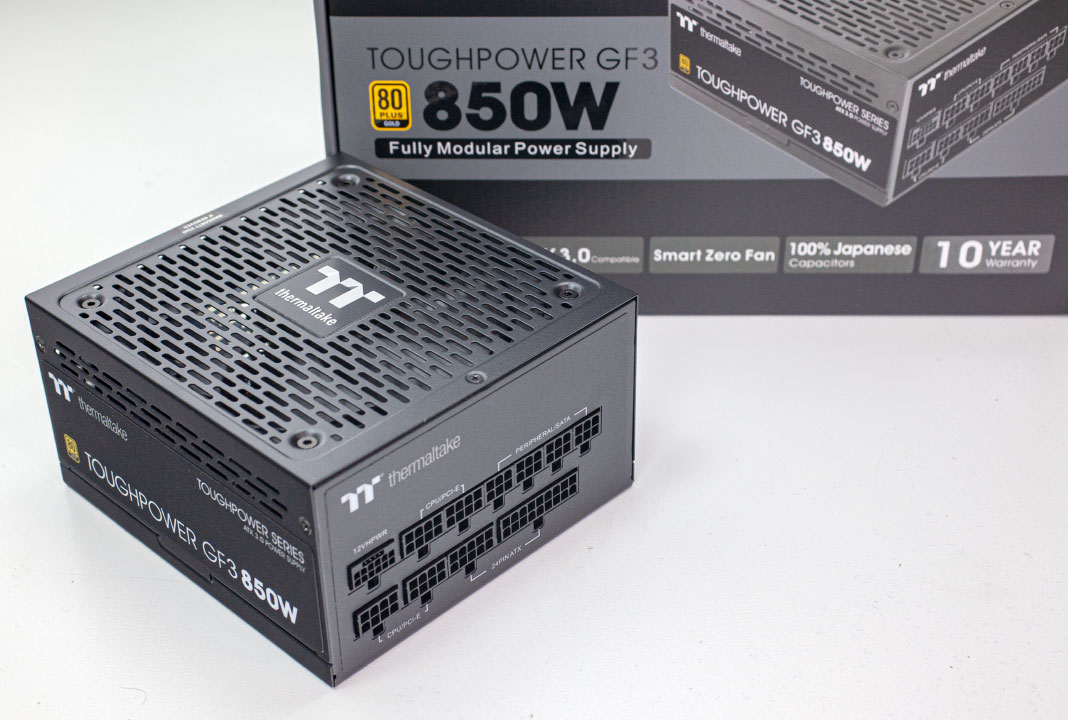
Synthetic Testing
- Tests are run with a 20-second-long warm-up time (result recording starts at second 21).
- Between each test, the drive is left idle for 60 seconds, to allow it to flush and reorganize its internal data.
- All write requests contain random, incompressible data.
- Disk cache is flushed between all tests.
- During these tests, M.2 drives are tested with additional active fan-cooling, to ensure thermal throttling can't happen
Real-life Testing
- After initial configuration and installation, a disk image is created; it is used to test every drive.
- Automated updates are disabled for the OS and all programs. This ensures that—for every review—each drive uses the same settings, without interference from previous testing.
- Our disk image consumes around 700 GB—partitions are resized to fill all available space on the drive.
- All drives are filled with random data to 85% of their capacity. This is intentional, to run the drive in realistic operating conditions—nobody uses a nearly-empty SSD in their system. It also puts additional stress on the pseudo-SLC cache subsystem, because there is less free NAND space to work with.
- Partitions are aligned properly.
- Disk cache is flushed between all tests.
- In order to minimize random variation, each real-life performance test is run several times, with reboots between tests to minimize the impact of disk cache.
- All application benchmarks run the actual application and do not replay any disk traces.
- Our real-life testing data includes performance numbers for a typical high-performance HDD, using results from a Western Digital WD Black 1 TB 7200 RPM 3.5" SATA. HDDs are significantly slower than SSDs, which is why we're not putting the result in the chart, as that would break the scaling, making the SSDs indistinguishable in comparison. Instead, we've added the HDD performance numbers in the title of each test entry.
- During these tests, M.2 drives are tested with additional active fan-cooling, to ensure thermal throttling can't happen
Our Patreon Silver Supporters can read articles in single-page format.
Nov 14th, 2026 04:21 CST
change timezone
Latest GPU Drivers
New Forum Posts
- I'll flash a ASUS ROG Strix RX480 O8G in Cause of Code 43, as a Newbie (2)
- Tell me about your favourite graphics card (39)
- Ryzen 7 8700G OC (7)
- What are you playing? (26217)
- Post your Cinebench R23 Score (3172)
- AI generated images... (225)
- 3D Printer Club (850)
- Browser Bechmark scores (132)
- MSI RTX 4090 SUPRIM X: FBPA5 training failure; seeking signed 20 GB VBIOS with 0x20 mask (0)
- Requesting original VBIOS for Gigabyte RX 5700 XT GAMING OC 8G Rev 2.0 (Micron) (1)
Popular Reviews
- AMD Zen 6 Technical Deep Dive
- Corsair HX1000i Shift Crystal Review
- NZXT C1200 Platinum Review
- ASUS ROG Strix B850-I Gaming Wi-Fi7 W Review
- Upcoming Hardware Launches 2027 (Updated Nov 2026)
- Montech King 95 3D PRO Review
- NZXT H7 RGB+ Review
- NZXT H5 Review
- Phantom Blade Zero Performance Benchmark Review - 35 GPUs Tested
- XPG NIMBUS PLUS Review - Mid-range Chair With Strong Competitors
TPU on YouTube
Controversial News Posts
- NVIDIA Co-Founder and CEO Jensen Huang Officially Resigns (383)
- OpenAI CEO Argues Home PCs Waste the World's Limited DRAM Supply (152)
- NVIDIA Launches Investigation Into Jensen Huang's Relationship With Suspected Chinese Spy (136)
- Intel "Raptor Lake Next" 16-Core and 20-Core CPUs Surface (130)
- Legendary Game Studio BioWare Shuts Down Following EA Layoffs (104)
- Dell CEO Says the Memory Shortage Will Get Worse in 2027 (95)
- NVIDIA GeForce RTX 50-Series Scheduled for up to $500 Price Hike This Week (89)
- Modder Fits RTX 5090 With Four 8-Pin Connectors, Halving Current per Wire (80)