 5
Team Group T-Force XTREEM DDR5-6400 32 GB CL32 Review
Memory Average FPS »Relative Performance
1920 × 1080 Relative Performance
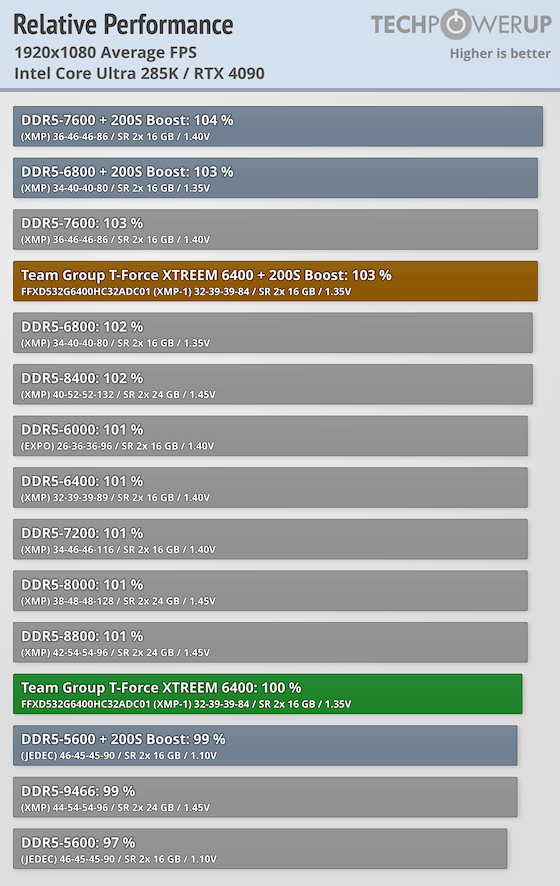
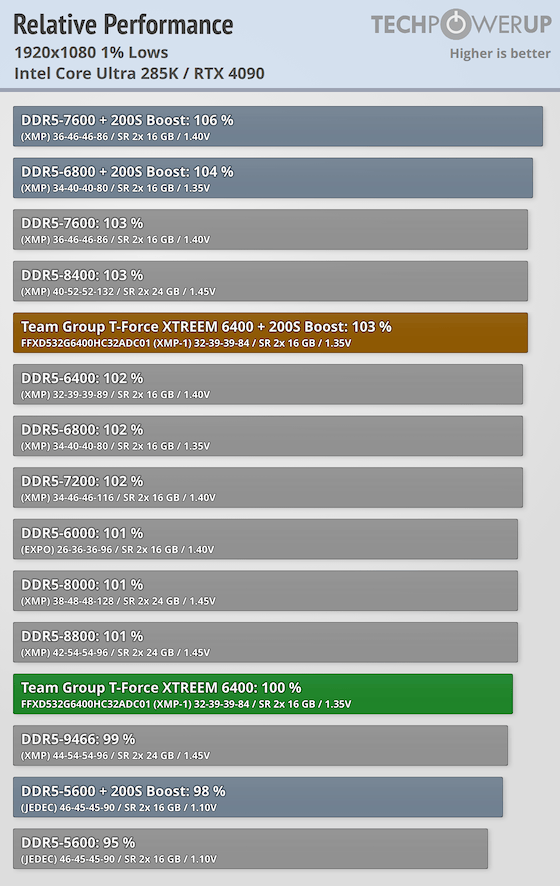
Looking at the Intel Core Ultra 285K at 1920 × 1080, we can see that the Team Group T-Force XTREEM 6400 at its stock XMP settings lands in the lower part of the stack, ahead of only DDR5-9466 and the two DDR5-5600 JEDEC configurations. This is expected and every kit from DDR5-6000 to DDR5-8800 is within 1–3% in both average FPS and 1% lows, including the other DDR5-6400 CL32 kit in the lineup. Enabling 200S Boost changes the picture considerably. 200S Boost raises the D2D and NGU ratio to 32x, and the XTREEM responds well, gaining 2.5% in average FPS and 3.2% in 1% lows to reach 103% in both charts. That puts it level with DDR5-7600 at XMP in both metrics and with DDR5-8400 in 1% lows, and only DDR5-7600 and DDR5-6800 running 200S Boost finish ahead of it. Overall memory performance doesn't scale much with frequency without using 200S Boost on this platform because of physical latency realities with the chiplet design Intel uses.
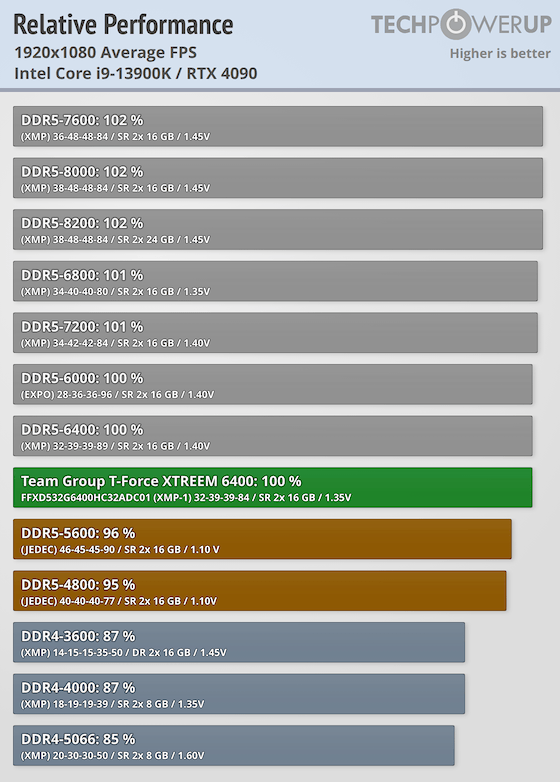
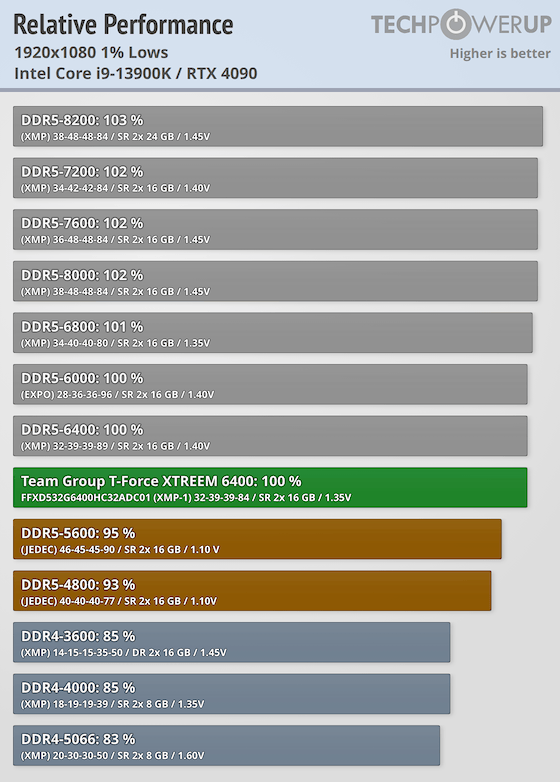
On the Intel Core i9-13900K, the T-Force XTREEM 6400 lands at 100% in a three-way tie with DDR5-6000 and the other DDR5-6400 kit, matching the latter at 1.35 V rather than 1.40 V. The headroom above them is small, with DDR5-6800 through DDR5-8200 adding just 1–2% in average FPS and 1–3% in 1% lows. The real separation happens further down the chart. DDR5-5600 and DDR5-4800 at JEDEC timings drop to 96% and 95% in average FPS and 95% and 93% in 1% lows, while the DDR4 kits fall to 85–87% in average FPS and 83–85% in 1% lows. Raptor Lake still rewards bandwidth, but past DDR5-6000 the returns flatten quickly, so the XTREEM gives up very little compared to a much higher speed 8200 MT/s kit.
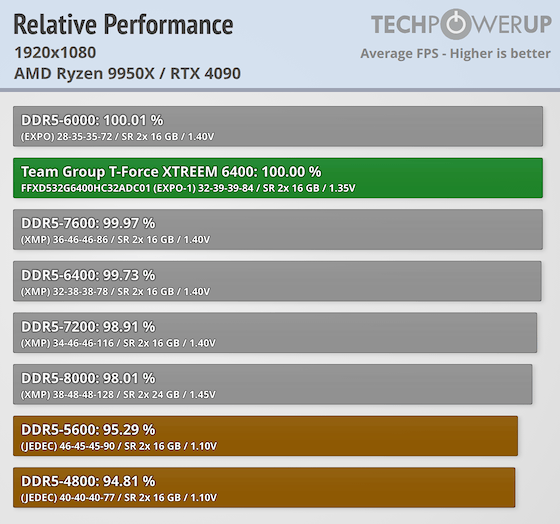
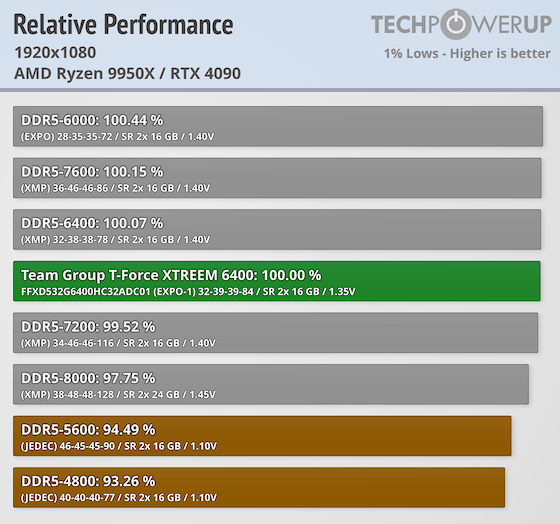
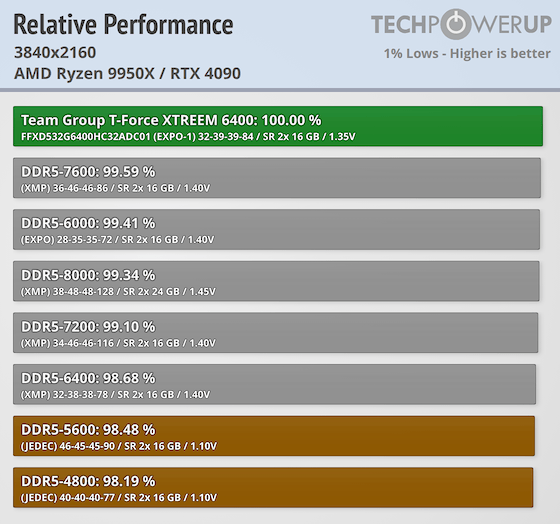
On the AMD Ryzen 9950X, tested on AGESA 1.3.0.1b with the kit running its EXPO profile, the T-Force XTREEM 6400 sits right at the top. In average FPS it is effectively tied for first, just 0.01% behind DDR5-6000 CL28 and ahead of DDR5-7600, the other DDR5-6400 kit, DDR5-7200, and DDR5-8000. In 1% lows, DDR5-6000, DDR5-7600, and the other DDR5-6400 kit edge ahead, but within margin of error. AM5 continues to favor the DDR5-6000 to DDR5-6400 sweet spot, as DDR5-7200 to DDR5-8000 both fall behind it even with more bandwidth available. With DDR5-8000 at 98.01% in average FPS and 97.75% in 1% lows, the 2:1 ratio doesn't do it any favors. The JEDEC configuration is at the bottom of the charts, with DDR5-5600 at 95.29% and 94.49% and DDR5-4800 at 94.81% and 93.26%, a falloff very similar to what the Intel platforms show. The combination of higher latency and lower bandwidth shows that around 6000 MT/s is where games become much less constrained by the memory.
3840 × 2160 Relative Performance
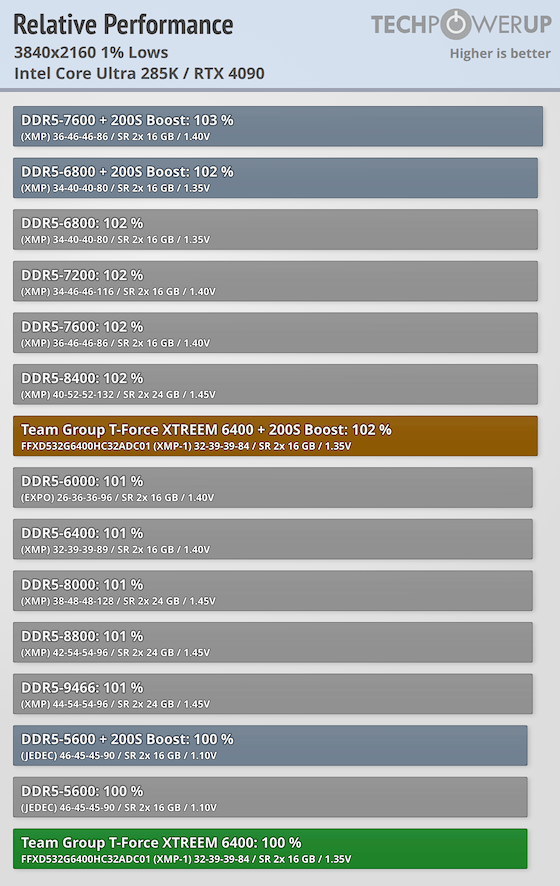
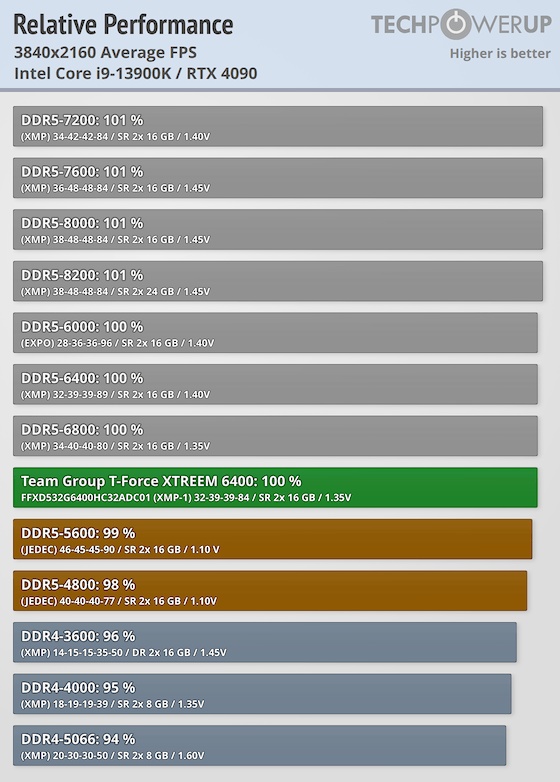
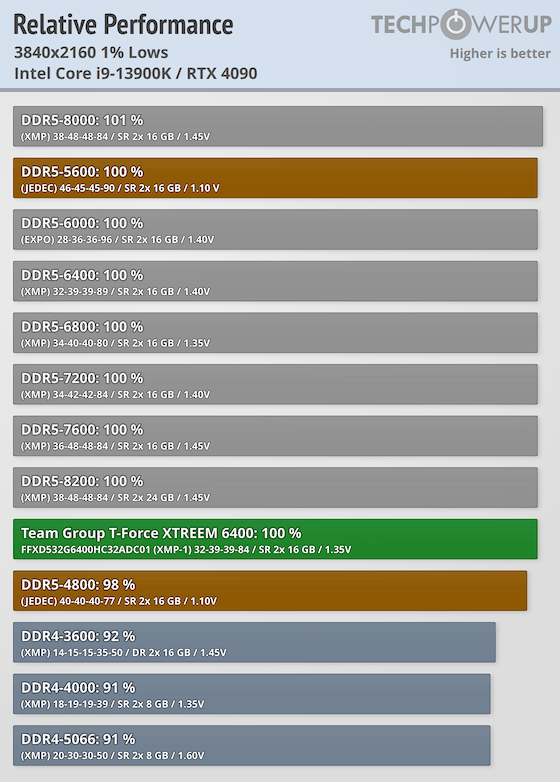
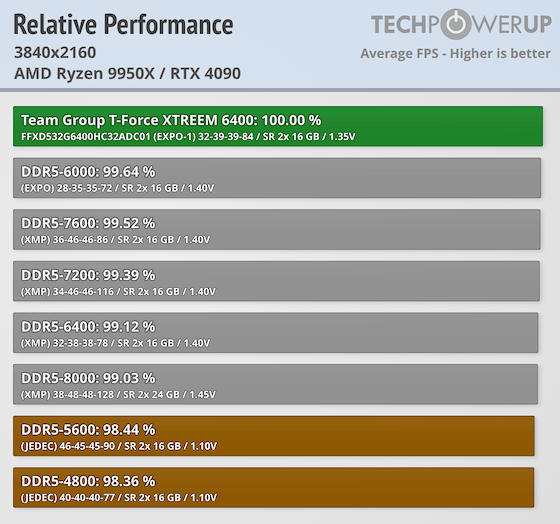
At 4K (3840 × 2160), the RTX 4090 becomes the limiting factor and the memory stack compresses on all three platforms. On the Core Ultra 285K, every configuration from DDR5-5600 to DDR5-7600 + 200S Boost lands between 99% and 102% in average FPS and between 100% and 103% in 1% lows, with the T-Force XTREEM 6400 at 100% stock and 101–102% with 200S Boost. The 9950X is tighter still: the entire stack, JEDEC DDR5-4800 included, falls within 2% of the XTREEM, which actually tops both charts, by less than half a percent. The i9-13900K is the one exception to the pattern. Its DDR5 kits compress to 98-101%, but DDR4 still trails at 94–96% in average FPS and 91–92% in 1% lows, showing that the older standard remains a bottleneck on this platform even when the graphics card is still the majority of the lower frame-rates. For anyone gaming at 4K, the XTREEM 6400 offers effectively the same experience as higher-rated kits.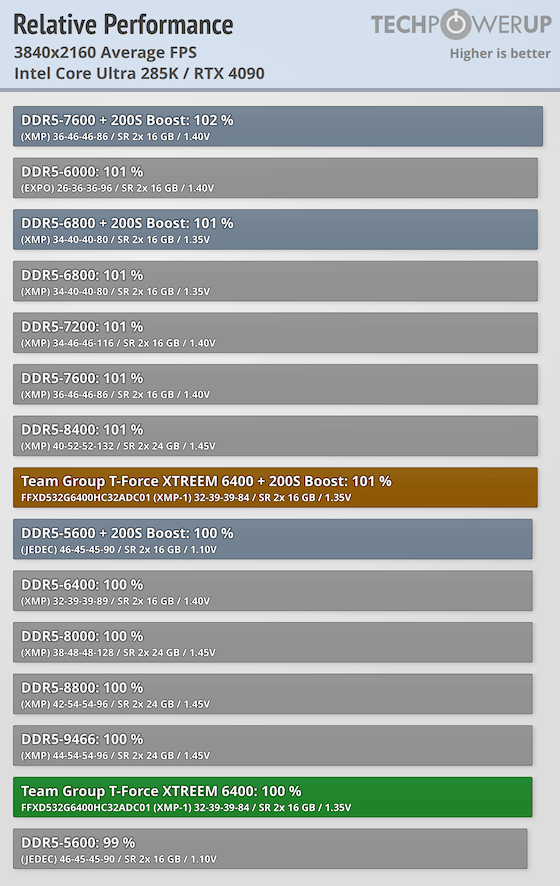
Nov 18th, 2026 13:24 PST
change timezone
Latest GPU Drivers
New Forum Posts
- Can i play GTA 6 now? (Joke) (5)
- Very unusual two gaming-pc scenarios. (11)
- Dell Workstation Owners Club (3513)
- Any other old-timers here planning to play WoW Forever? (151)
- Time to upgrade CPU and MOBO (33)
- The Filthy, Rotten, Nasty, Helpdesk-Nightmare picture clubhouse (2876)
- WarpCoreBench scores! (67)
- Honestly, do you care about GTA VI? (144)
- Acer Predator BiFrost Radeon RX 9070 OC (9)
- DTS DCH Driver for Realtek HDA [DTS:X APO4 + DTS Interactive] (2814)
Popular Reviews
- Acemagic Retro X3 Review
- Upcoming Hardware Launches 2027 (Updated Nov 2026)
- AMD Zen 6 Technical Deep Dive
- ASUS ROG Strix B850-I Gaming Wi-Fi7 W Review
- Corsair HX1000i Shift Crystal Review
- Biwin Black Opal NV7400 2 TB Review
- Chieftec Iceberg PRO 360 DARK Review
- AMD Ryzen 7 9800X3D Review - The Best Gaming Processor
- Phantom Blade Zero Performance Benchmark Review - 35 GPUs Tested
- Pulsar Office Tour & First Look at P1 Dual-Sensor Mouse
TPU on YouTube
Controversial News Posts
- NVIDIA Co-Founder and CEO Jensen Huang Officially Resigns (478)
- Report: Jensen Huang Eyes NVIDIA Comeback (187)
- Open Letter Asking NVIDIA to Reinstate Jensen Huang Passes 115,000 Signatures (184)
- OpenAI CEO Argues Home PCs Waste the World's Limited DRAM Supply (152)
- NVIDIA Launches Investigation Into Jensen Huang's Relationship With Suspected Chinese Spy (136)
- Intel "Raptor Lake Next" 16-Core and 20-Core CPUs Surface (130)
- Legendary Game Studio BioWare Shuts Down Following EA Layoffs (104)
- Dell CEO Says the Memory Shortage Will Get Worse in 2027 (95)