 23
ACEMAGIC Tank M1A Pro+ Review
Web & Office Productivity »General Performance
AIDA64 Cache & Memory
The AIDA64 memory benchmark measures how quickly data moves between system memory and the CPU's cache hierarchy. It provides insight into bandwidth (read/write/copy speeds) and latency, which directly affect responsiveness in everyday computing and the performance of integrated graphics that share system memory.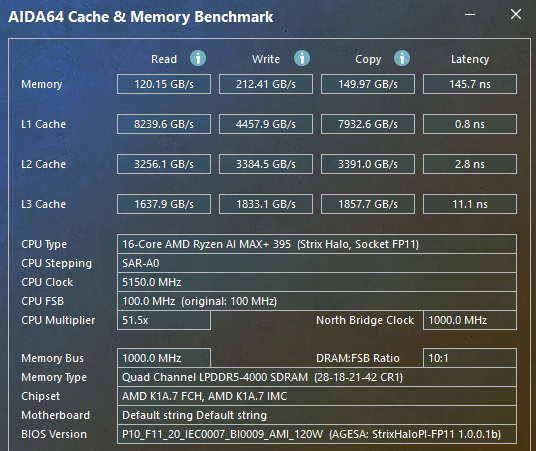
AIDA64 shows just how much memory bandwidth this platform has to work with, posting 120.15 GB/s read, 212.41 GB/s write, and 149.97 GB/s copy, though the 145.7 ns latency figure is much less impressive. That bandwidth is a big part of why the Tank M1A+ Pro performs so well in GPU-heavy workloads, since the Radeon 8060S depends directly on shared system memory instead of dedicated VRAM.
Cinebench
Cinebench is a CPU rendering benchmark based on Maxon's Cinema 4D engine. It evaluates both single-threaded and multithreaded workloads, giving a clear picture of how a processor handles everyday tasks as well as heavier rendering scenarios.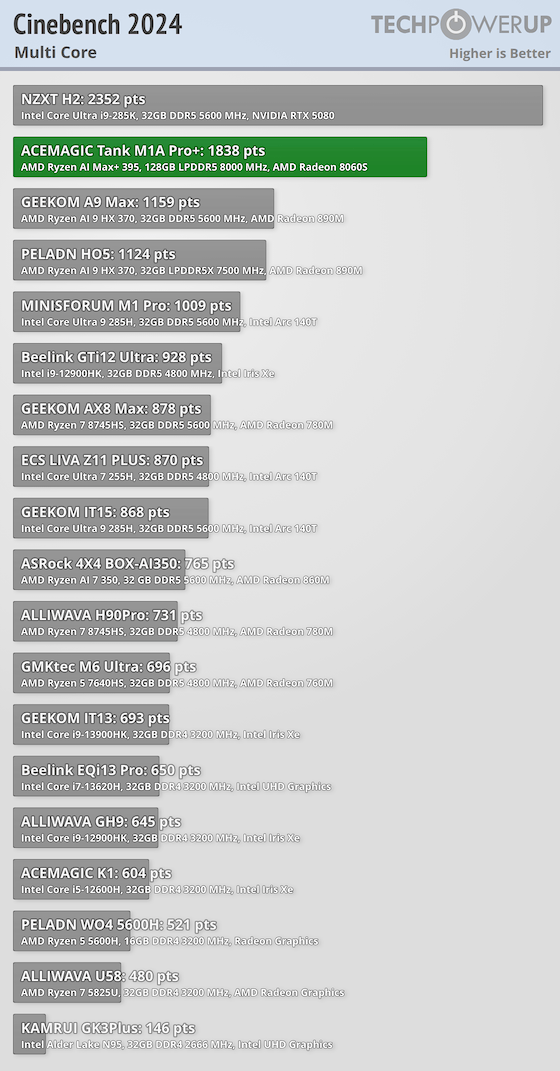
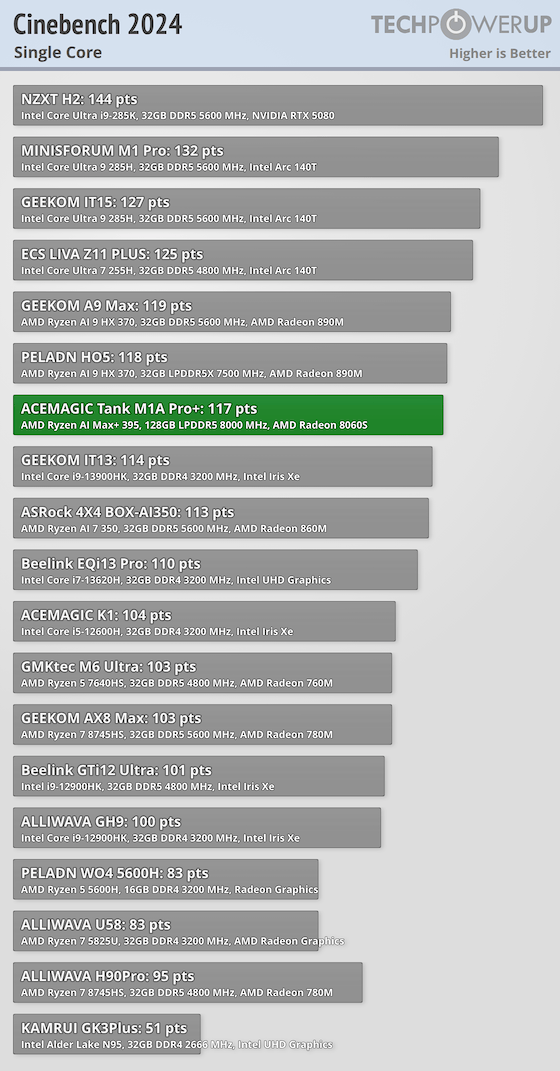
The Tank scores 1838 in multicore and 117 in single-core. The multicore result is huge, second only to the NZXT H2 at 2352, and far ahead of the next-best Mini-PCs such as the GEEKOM A9 Max at 1159 or PELADN HO5 at 1124. The single-core result is more modest, placing behind the best Intel mobile systems like the MINISFORUM M1 Pro at 132 and GEEKOM IT15 at 127, but still fully competitive with the leading AMD Mini-PCs.
Switching from Performance mode to Balanced mode shaves a little off the Cinebench 2024 result. The Tank drops from 1838 to 1769 in multicore, while single-core slips from 117 to 115, which fits with the idea that the dial is adjusting the system's power and boost behavior rather than changing anything dramatic about short-burst CPU performance. In Silent mode, the M1A Pro+ drops to 1410 in Cinebench 2024 multicore while single-core holds at 114, showing that the 70 W profile cuts sustained all-core performance much more than short burst speed.
7-Zip
7-Zip's built-in benchmark measures CPU performance when compressing and decompressing data. It's a good indicator of how a system handles file-heavy workloads such as packing archives, installing software, or building projects.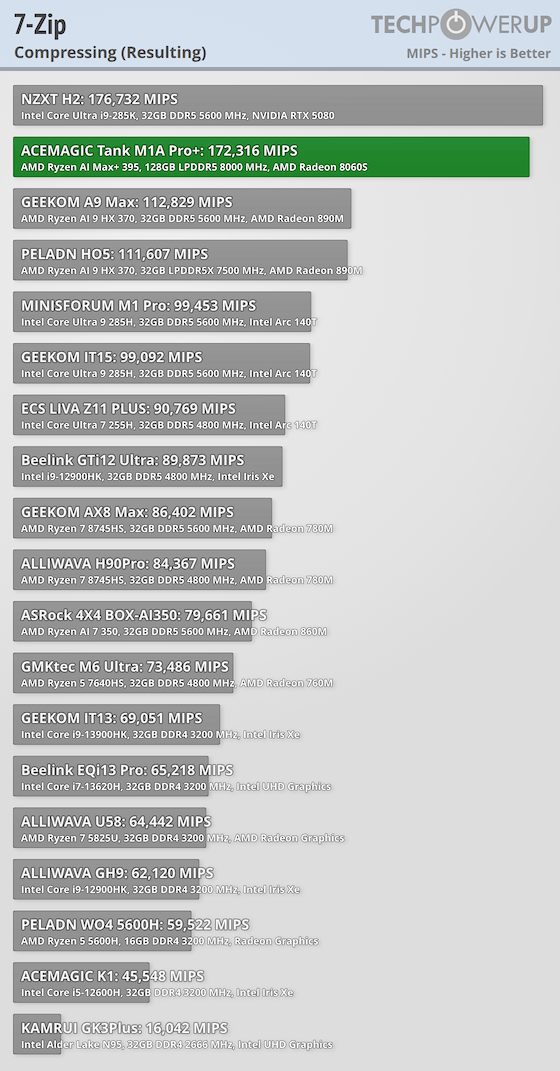
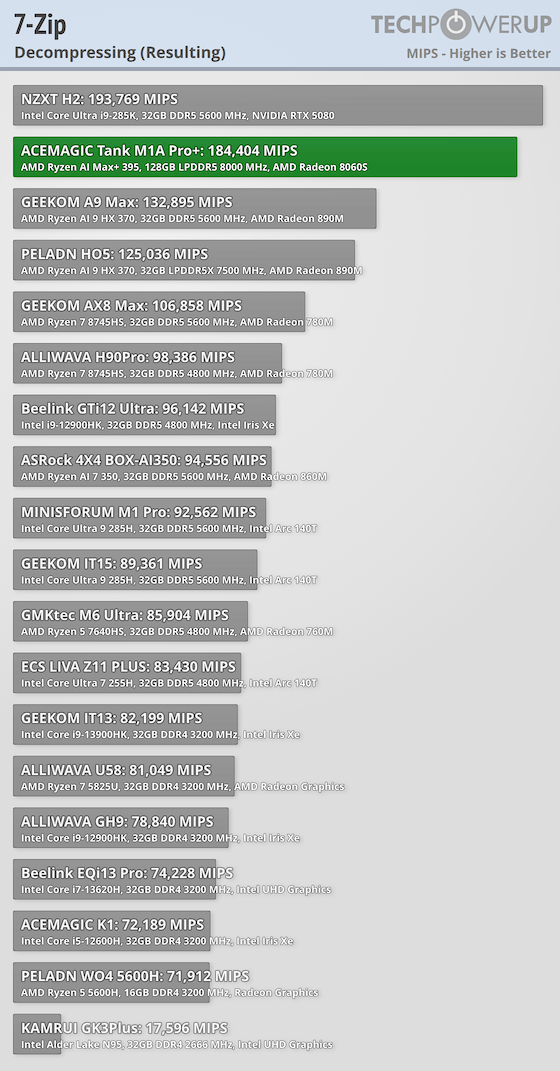
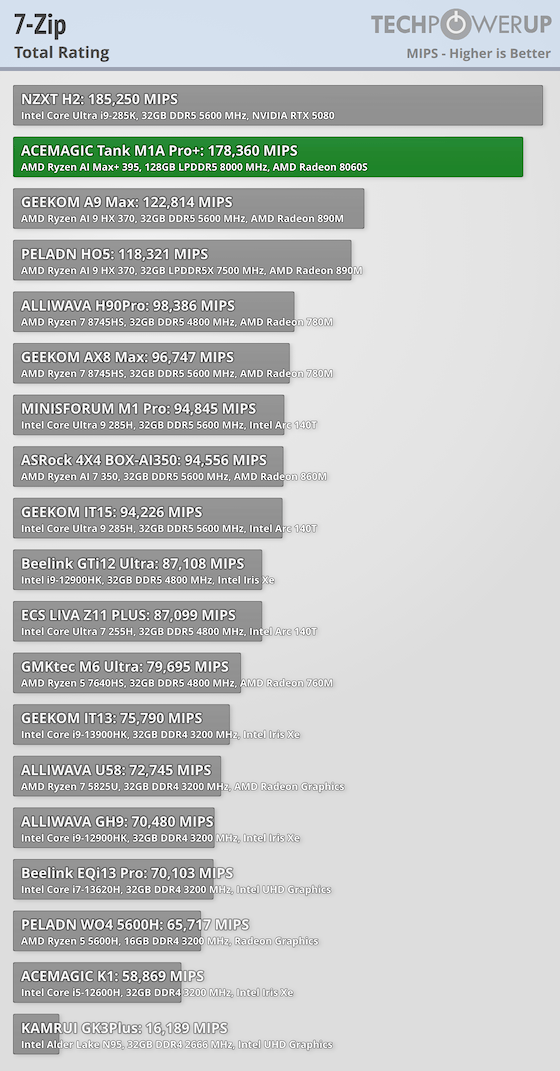
The Tank scores 172,316 in compressing, 184,404 in decompressing, and 178,360 in total rating. All three numbers place it second only to the NZXT H2.
PCMark 10
PCMark simulates common desktop activities across browsing, video conferencing, office apps, and media workflows. It provides a composite view of how a system will feel in day-to-day usage.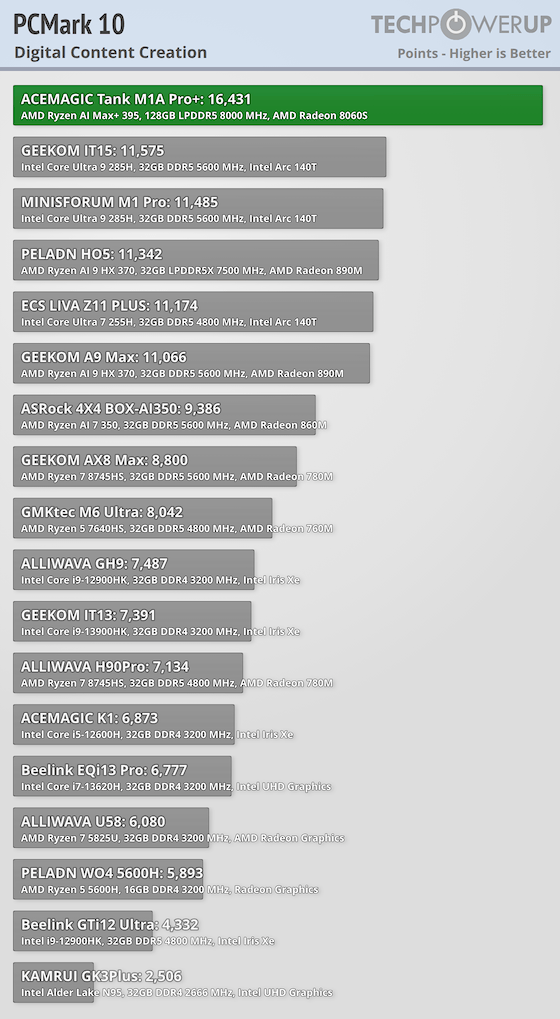
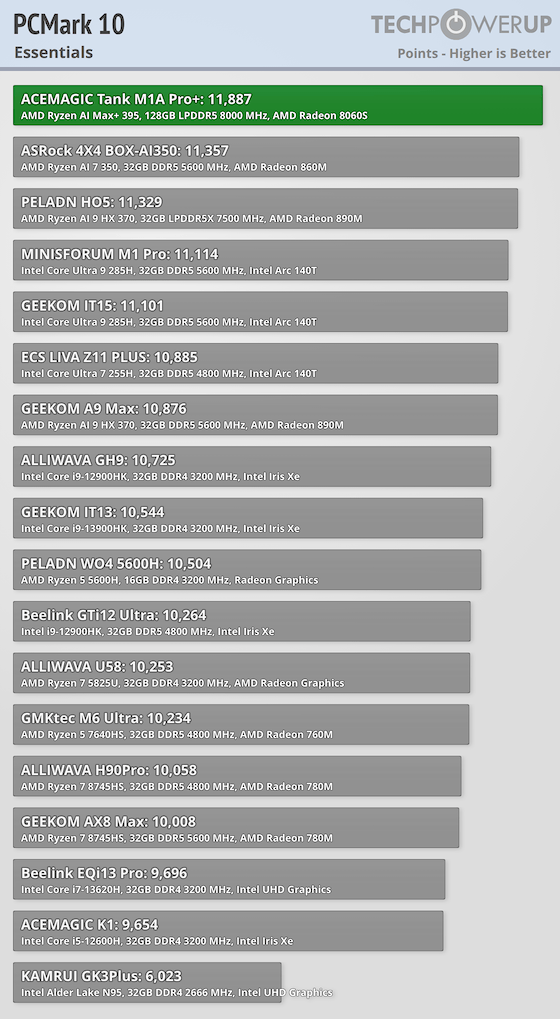
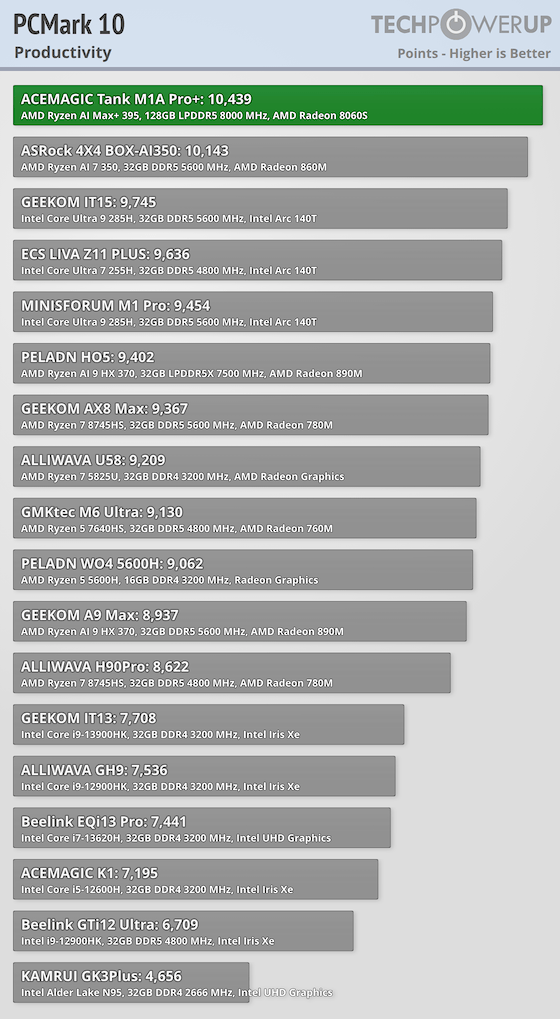
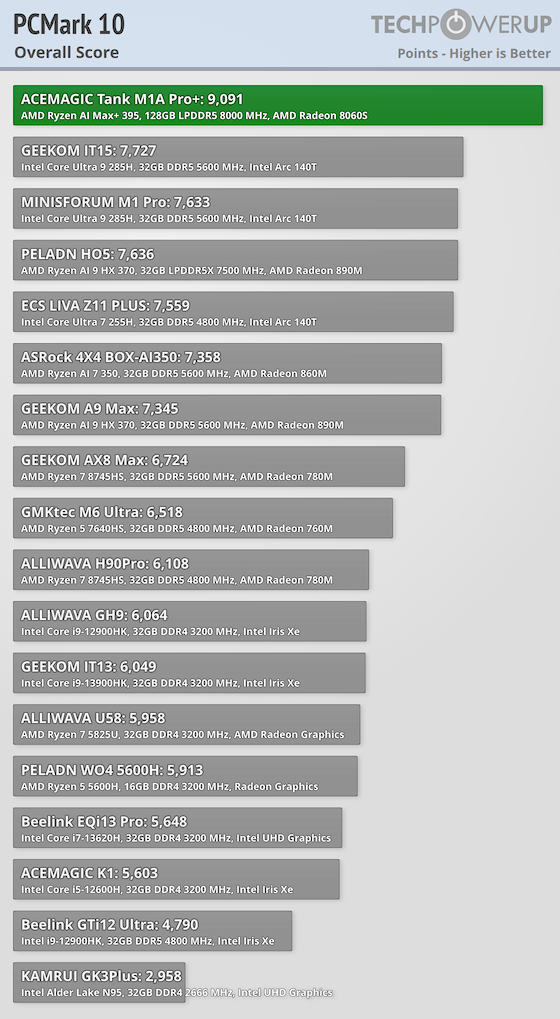
The Tank leads Essentials with 11,887, Productivity with 10,439, Digital Content Creation with 16,431, and the Overall score with 9,091. The margin is not small either, especially in Digital Content Creation, where it is far ahead of the next-best GEEKOM IT15 at 11,575.
Y-Cruncher
Y-Cruncher calculates digits of Pi with extreme precision, pushing both CPU and memory to their limits. It's useful for gauging raw compute ability and stability under heavy math workloads.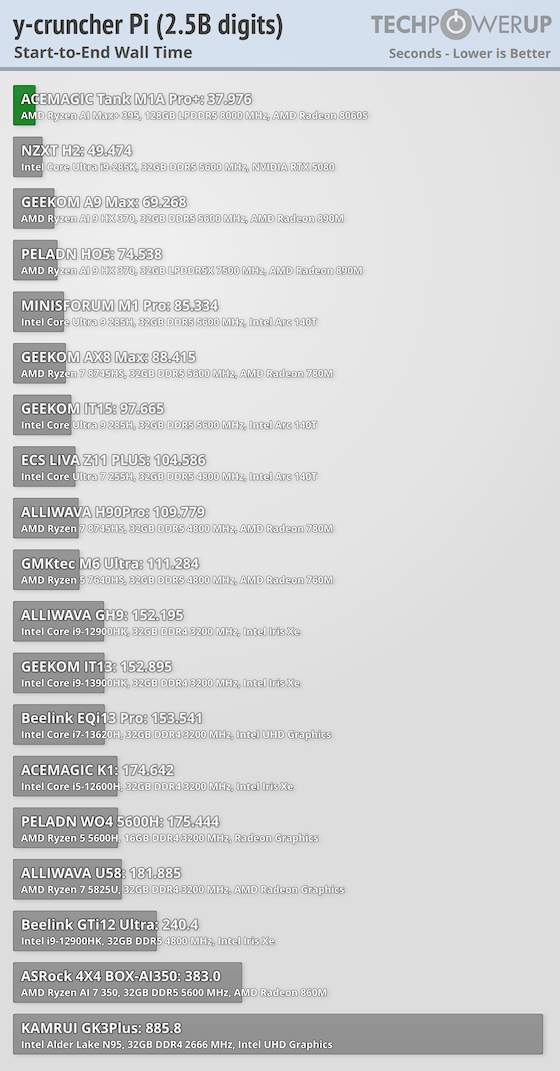
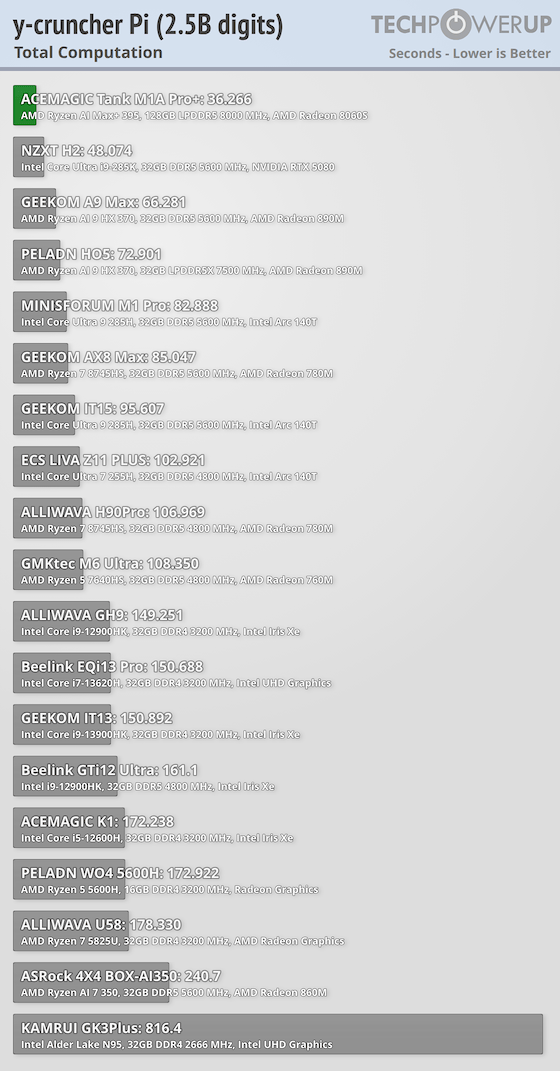
The Tank finishes the 2.5 billion digit Pi run in an impressive 36.266 seconds of computation time, with a 37.976-second wall time. That beats the NZXT H2 at 48.074 seconds, and the gap grows even larger against the rest of the Mini-PC field, such as the GEEKOM A9 Max at 66.281 seconds or MINISFORUM M1 Pro at 82.888 seconds. For raw compute, this is a very impressive result.
Switching from Performance mode to Balanced mode had a much larger effect in y-cruncher than it did in Cinebench and, as you will see, in Blender. The M1A Pro+'s computation time rises from 36.266 seconds to 41.094 seconds, while wall time increases from 37.976 seconds to 42.927 seconds, which is a noticeable drop in raw sustained compute throughput. That lines up with the idea that the front dial is reducing the power available under long, all-core workloads, where this system benefits most from the more aggressive Performance setting.
Silent mode has an even larger effect in y-cruncher than the drop from Performance to Balanced. Computation time rises to 46.614 seconds, while wall time increases to 48.381 seconds, which points to a much bigger reduction in sustained all-core compute throughput. That fits with how this front dial behaves elsewhere, as the 70 W setting pulls back much harder in long, CPU-heavy workloads where the system gets the most benefit from its higher power profiles.
Geekbench
Geekbench tests a wide variety of workloads, from encryption and machine learning to office productivity and photo editing. It also includes GPU acceleration, giving a broader view of system capability.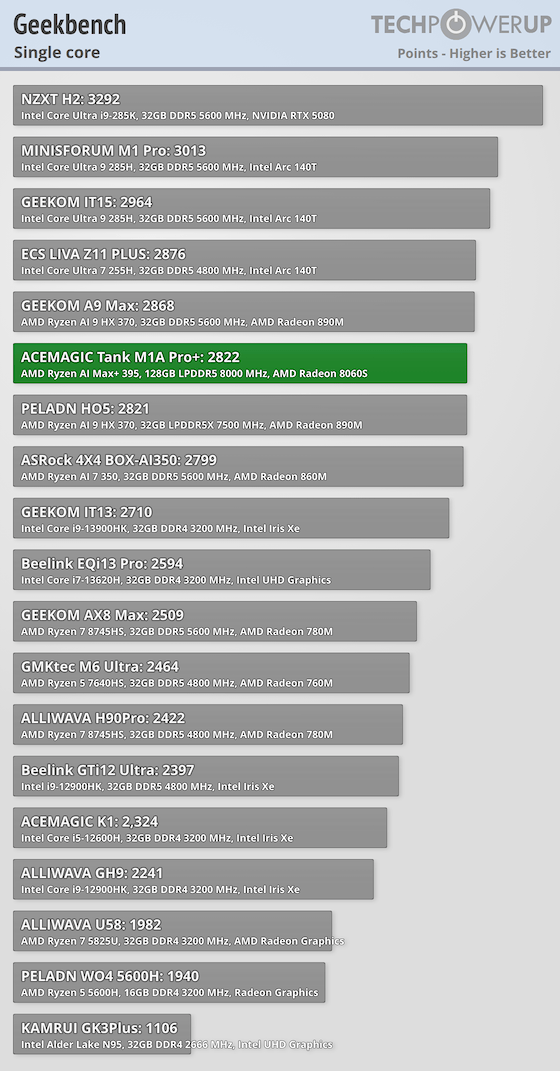
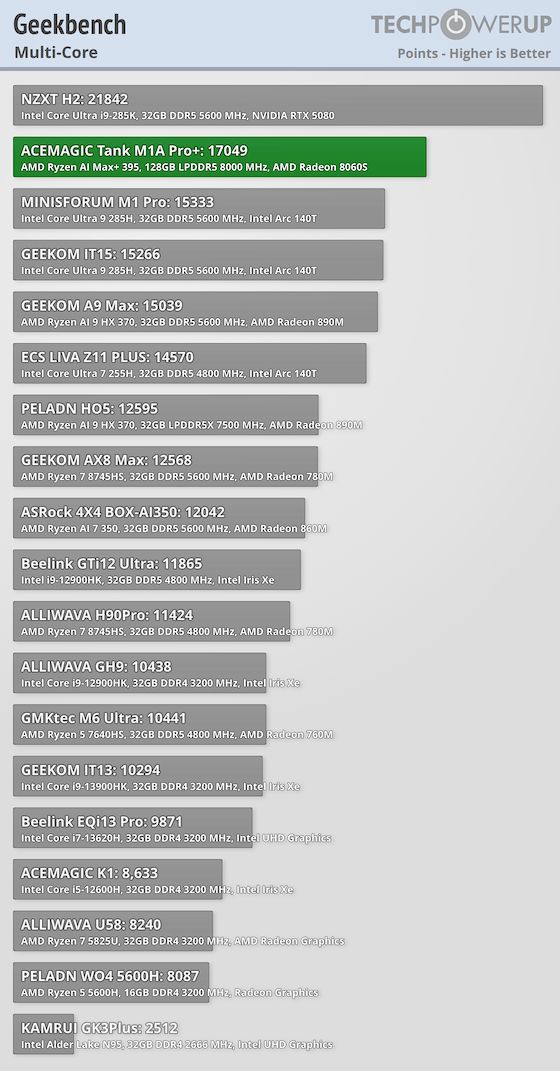
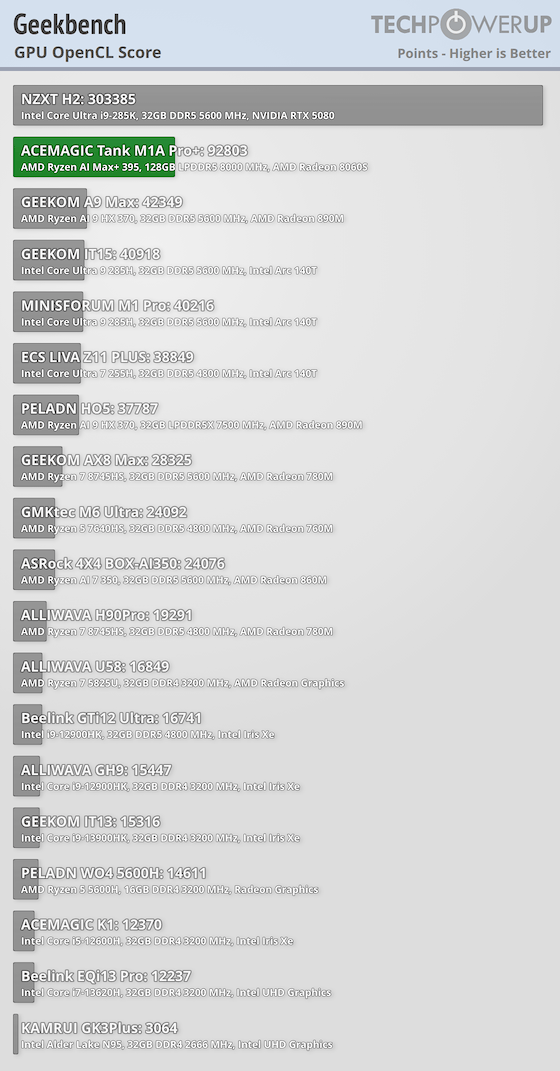
The Tank scores 2822 in single-core and 17,049 in multicore, which keeps it near the top of the chart and second only to the NZXT H2 at 21,842 on multicore. On the GPU side, the 92,803 OpenCL score is enormous for an iGPU, more than double the GEEKOM A9 Max at 42,349, GEEKOM IT15 at 40,918, and MINISFORUM M1 Pro at 40,216. That is one of the clearest indicators in the file that the 8060S is in a very different class from prior integrated solutions.
Nov 20th, 2026 14:33 PST
change timezone
Latest GPU Drivers
New Forum Posts
- Logitech Headsets Modded Driver — Unlock Dolby in G HUB (23)
- 1 - 5 person file storage server equivalent accasible from anywhere + general VM server. (1)
- WarpCoreBench scores! (81)
- How to prevent OLED burn damage due to PC freezes or power outtages? (48)
- RX 9000 series GPU Owners Club (2247)
- Honestly, do you care about GTA VI? (208)
- When you could finally run Crysis maxed out? (63)
- GTA VI (20)
- Anthrophics IPO (25)
- GeekMagic Ultra Smart WiFi Weather Station (8)
Popular Reviews
- AMD Zen 6 Technical Deep Dive
- Microsoft Surface Laptop Ultra Review - The Next-gen Arm Laptop
- Ugreen NASync DXP4800 GT Review
- Corsair RM1200e (Second Generation) Review
- Acemagic Retro X3 Review
- Upcoming Hardware Launches 2027 (Updated Nov 2026)
- Pulsar Office Tour & First Look at P1 Dual-Sensor Mouse
- Biwin Black Opal NV7400 2 TB Review
- AMD Ryzen 7 9800X3D Memory Performance Scaling
- AMD Ryzen 7 9800X3D Review - The Best Gaming Processor
TPU on YouTube
Controversial News Posts
- NVIDIA Co-Founder and CEO Jensen Huang Officially Resigns (490)
- Report: Jensen Huang Eyes NVIDIA Comeback (256)
- Open Letter Asking NVIDIA to Reinstate Jensen Huang Passes 115,000 Signatures (184)
- OpenAI CEO Argues Home PCs Waste the World's Limited DRAM Supply (152)
- NVIDIA Launches Investigation Into Jensen Huang's Relationship With Suspected Chinese Spy (136)
- Intel "Raptor Lake Next" 16-Core and 20-Core CPUs Surface (130)
- Legendary Game Studio BioWare Shuts Down Following EA Layoffs (104)
- Dell CEO Says the Memory Shortage Will Get Worse in 2027 (95)