 9
Arctic Freezer 36-S A-RGB Review
Value & Conclusion »Performance Summary and Performance per Dollar
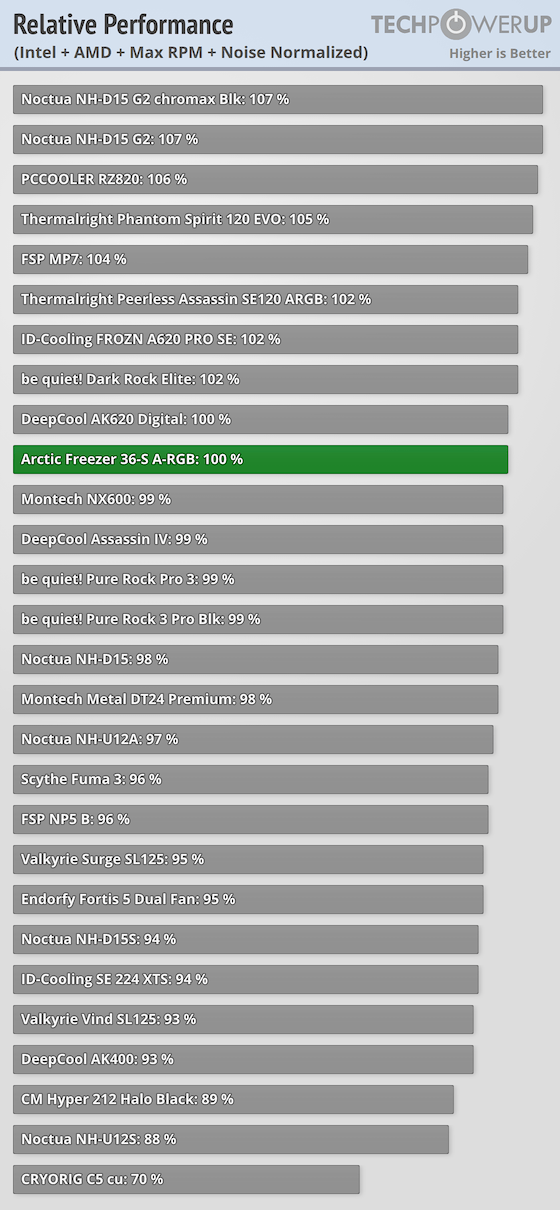
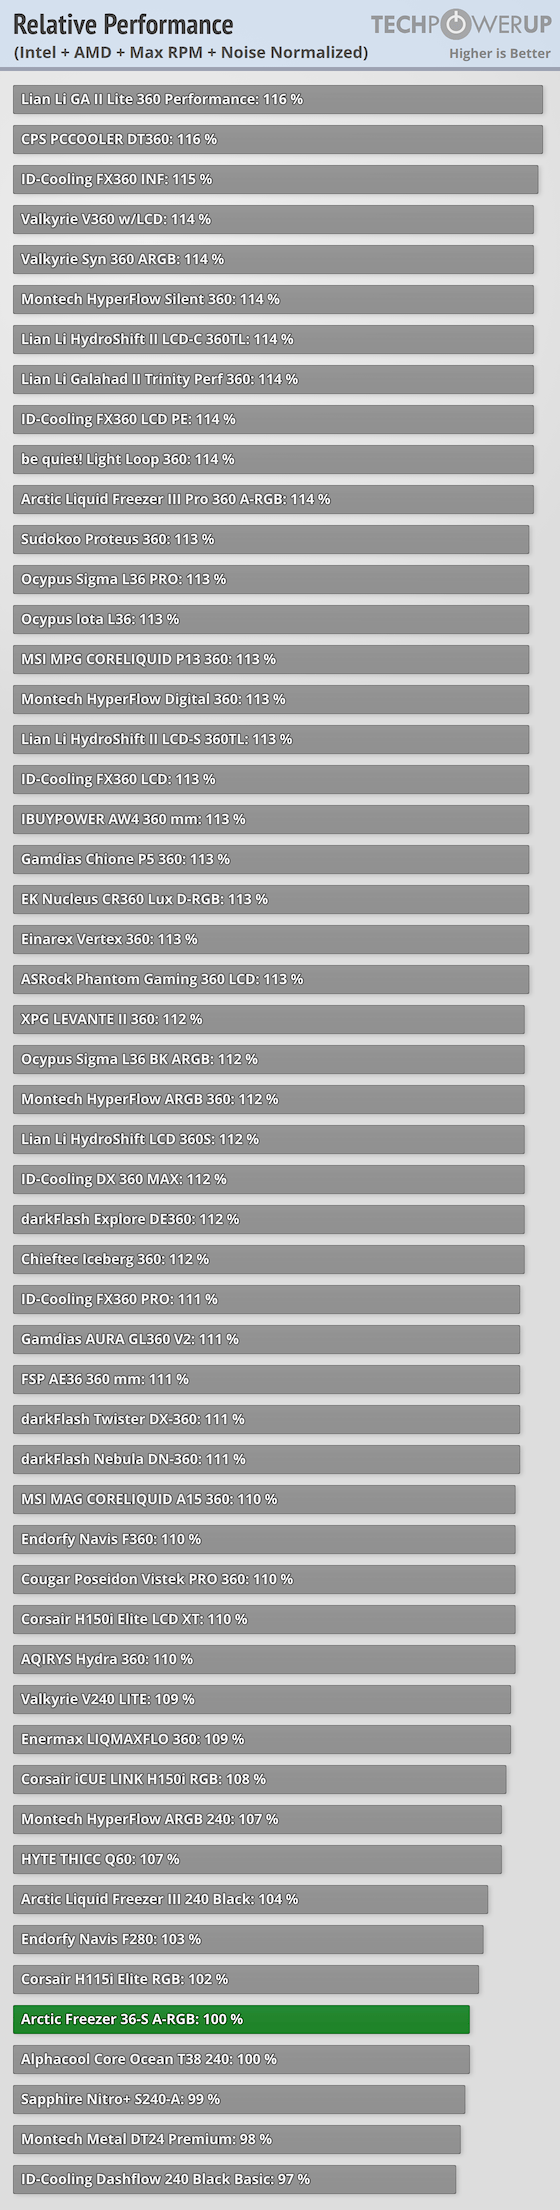
The Performance Summary and Performance per Dollar charts have also been revamped. They now include both the Intel and AMD results at both max RPM and 45 dBA noise normalized results for a quick comprehensive general purpose performance profile across all tests.Meanwhile, Performance per Dollar is the same conceptually, it takes into account not only the performance of each cooler, but also its pricing, to determine the overall bang for the buck.
AIR Only
For improved clarity we have separated the Performance Summary and Performance per Dollar charts into two new categories. The first set compares the air cooler being reviewed against all the air coolers that have been tested.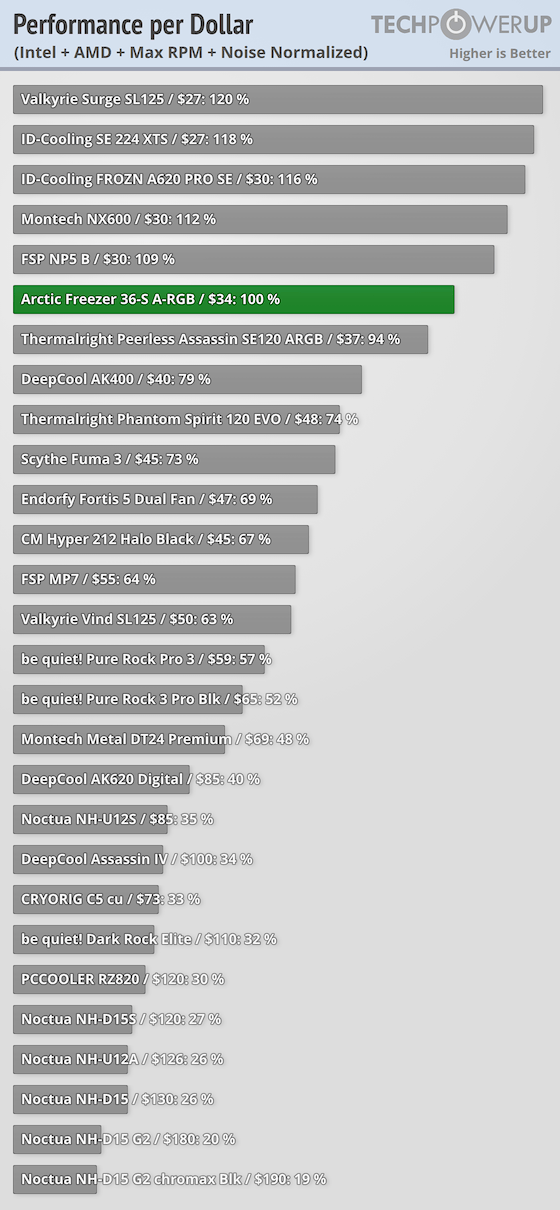
AIR vs AIO
As for the second set of charts we compared the reviewed air cooler against the various AIO coolers that have been tested thus far.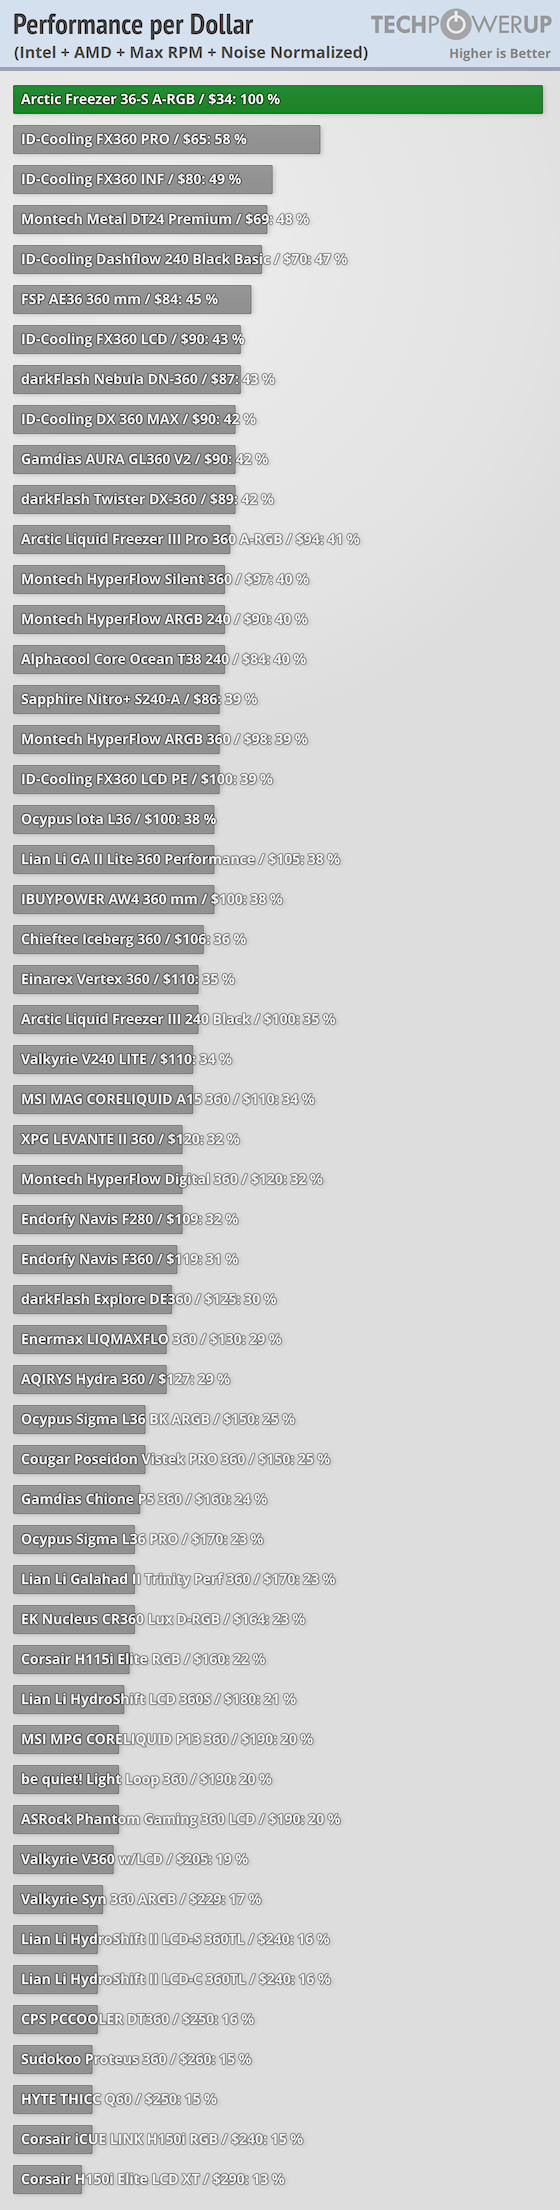
Nov 15th, 2026 19:30 CST
change timezone
Latest GPU Drivers
New Forum Posts
- It’s been fascinating times in Retro agian r36s isn’t even worth 50-65 dollars no more and newly listed Rm36 64gb 4in IPS models for only 34 dollars. (6)
- Power supply noise stops when I move the mouse (10)
- Can you guess Which game it is? (320)
- Your PC ATM (36431)
- What is the latest game you finished or 100% (203)
- HP Office Jet 7740 Pro - Supply system problem with replacement cartridge (4)
- What are you playing? (26224)
- WarpCoreBench scores! (55)
- Local LLM General Discussion (691)
- Folding Pie and Milestones!! (10205)
Popular Reviews
- ASUS ROG Strix B850-I Gaming Wi-Fi7 W Review
- Corsair HX1000i Shift Crystal Review
- AMD Zen 6 Technical Deep Dive
- Upcoming Hardware Launches 2027 (Updated Nov 2026)
- Montech King 95 3D PRO Review
- NZXT C1200 Platinum Review
- Phantom Blade Zero Performance Benchmark Review - 35 GPUs Tested
- AMD Ryzen 7 9800X3D Review - The Best Gaming Processor
- NZXT H7 RGB+ Review
- NZXT H5 Review
TPU on YouTube
Controversial News Posts
- NVIDIA Co-Founder and CEO Jensen Huang Officially Resigns (430)
- Open Letter Asking NVIDIA to Reinstate Jensen Huang Passes 115,000 Signatures (184)
- OpenAI CEO Argues Home PCs Waste the World's Limited DRAM Supply (152)
- NVIDIA Launches Investigation Into Jensen Huang's Relationship With Suspected Chinese Spy (136)
- Intel "Raptor Lake Next" 16-Core and 20-Core CPUs Surface (130)
- Legendary Game Studio BioWare Shuts Down Following EA Layoffs (104)
- Dell CEO Says the Memory Shortage Will Get Worse in 2027 (95)
- NVIDIA GeForce RTX 50-Series Scheduled for up to $500 Price Hike This Week (89)