 7
7
FSP Dagger Pro 650 W Review
Cross Load Tests »Test Setup

Primary Rails Load Regulation
The following charts show the voltage values of the main rails, recorded over a range from 60 W to the maximum specified load, and the deviation (in percent) for the same load range. Tight load regulation is an important PSU characteristic since it allows for constant voltage levels even with changes in load.


5VSB Regulation


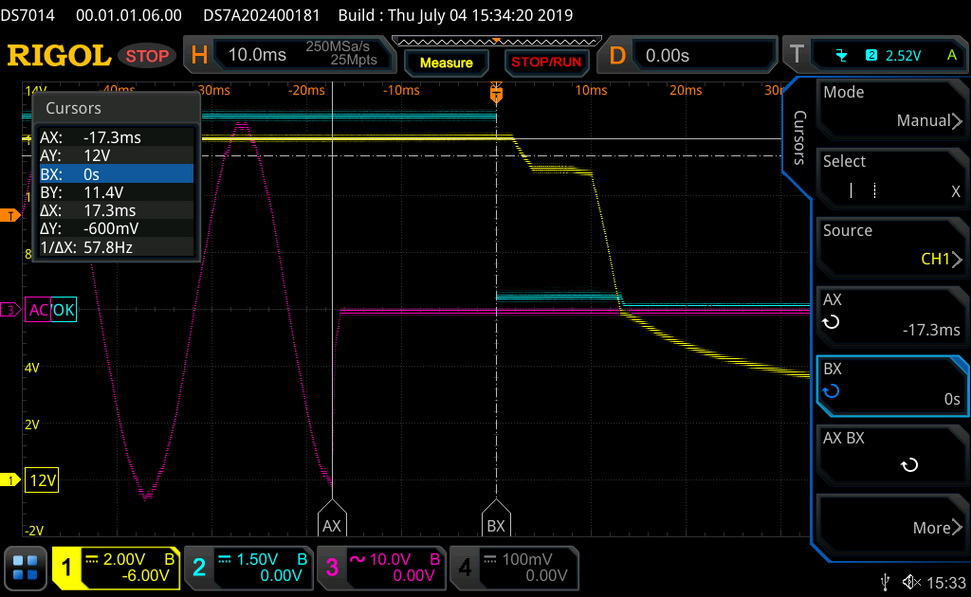
Hold-up Time
Hold-up time represents the amount of time, usually measured in milliseconds, a PSU can maintain output regulations as defined by the ATX specification without input power. Hold-up time is the amount of time the system can continue to run without shutting down or rebooting during a power interruption. In the following screenshots, the blue line is the mains signal and the green line is the "Power Good" signal, while the yellow line represents the +12V rail.


Inrush Current
Inrush current, or switch-on surge, refers to the maximum instantaneous input current drawn by an electrical device when it is first turned on. Large enough inrush current can cause the tripping of circuit breakers and fuses and may also damage switches, relays, and bridge rectifiers. As a result, the lower the inrush current of a PSU right as it is turned on, the better.
10-110% Load Testing
These tests reveal the SDA2-650's load regulation and efficiency levels under high ambient temperatures. They also show how the fan-speed profile behaves under tough operating conditions.| Load Regulation & Efficiency Testing Data - FSP SDA2-650 | ||||||||||
|---|---|---|---|---|---|---|---|---|---|---|
| Test | 12 V | 5 V | 3.3 V | 5VSB | Power (DC/AC) | Efficiency | Fan Speed | PSU Noise | Temp (In/Out) | PF/AC Volts |
| 10% Load | 3.582A | 1.989A | 1.996A | 0.985A | 64.935W | 84.044% | 1643 RPM | 24.8 dB(A) | 40.45°C | 0.877 |
| 12.095V | 5.031V | 3.306V | 5.080V | 77.263W | 43.58°C | 230.35V | ||||
| 20% Load | 8.149A | 2.984A | 2.996A | 1.185A | 129.462W | 89.285% | 1649 RPM | 24.8 dB(A) | 40.62°C | 0.950 |
| 12.094V | 5.029V | 3.305V | 5.063V | 144.998W | 44.34°C | 230.35V | ||||
| 30% Load | 13.114A | 3.482A | 3.481A | 1.387A | 194.568W | 91.078% | 1744 RPM | 27.1 dB(A) | 41.34°C | 0.972 |
| 12.091V | 5.027V | 3.304V | 5.048V | 213.629W | 45.66°C | 230.36V | ||||
| 40% Load | 18.087A | 3.983A | 3.997A | 1.590A | 259.812W | 91.577% | 2307 RPM | 35.1 dB(A) | 41.52°C | 0.982 |
| 12.086V | 5.024V | 3.303V | 5.032V | 283.708W | 46.49°C | 230.36V | ||||
| 50% Load | 22.729A | 4.981A | 5.000A | 1.795A | 325.102W | 91.580% | 2742 RPM | 40.9 dB(A) | 42.16°C | 0.988 |
| 12.081V | 5.021V | 3.300V | 5.016V | 354.993W | 47.66°C | 230.36V | ||||
| 60% Load | 27.315A | 5.983A | 6.007A | 2.001A | 389.620W | 91.040% | 3416 RPM | 47.1 dB(A) | 42.80°C | 0.991 |
| 12.074V | 5.016V | 3.297V | 4.999V | 427.966W | 48.79°C | 230.36V | ||||
| 70% Load | 31.972A | 6.988A | 7.012A | 2.209A | 454.949W | 90.723% | 3505 RPM | 48.6 dB(A) | 43.09°C | 0.993 |
| 12.068V | 5.010V | 3.294V | 4.981V | 501.470W | 49.71°C | 230.37V | ||||
| 80% Load | 36.637A | 7.995A | 8.022A | 2.418A | 520.249W | 90.271% | 3493 RPM | 48.6 dB(A) | 43.68°C | 0.994 |
| 12.060V | 5.004V | 3.291V | 4.963V | 576.319W | 50.92°C | 230.37V | ||||
| 90% Load | 41.691A | 8.503A | 8.511A | 2.423A | 585.177W | 89.836% | 3492 RPM | 48.6 dB(A) | 44.10°C | 0.996 |
| 12.057V | 5.000V | 3.289V | 4.953V | 651.387W | 51.80°C | 230.37V | ||||
| 100% Load | 46.708A | 9.010A | 9.037A | 2.531A | 649.910W | 89.248% | 3490 RPM | 48.5 dB(A) | 45.69°C | 0.997 |
| 12.047V | 4.996V | 3.287V | 4.939V | 728.204W | 54.02°C | 230.37V | ||||
| 110% Load | 52.139A | 9.018A | 9.039A | 2.537A | 714.727W | 88.606% | 3489 RPM | 48.5 dB(A) | 46.56°C | 0.997 |
| 12.035V | 4.993V | 3.286V | 4.929V | 806.636W | 55.42°C | 230.37V | ||||
| Crossload 1 | 0.153A | 14.002A | 14.000A | 0.000A | 117.317W | 83.143% | 3156 RPM | 44.5 dB(A) | 42.68°C | 0.948 |
| 12.092V | 4.987V | 3.260V | 5.082V | 141.103W | 48.35°C | 230.36V | ||||
| Crossload 2 | 54.018A | 1.004A | 1.000A | 1.000A | 664.212W | 89.805% | 3492 RPM | 48.6 dB(A) | 45.25°C | 0.997 |
| 12.049V | 5.018V | 3.305V | 5.006V | 739.614W | 53.74°C | 230.36V | ||||
Light Load Testing
In the following tests, we measure the SDA2-650's efficiency at loads significantly lower than 10 percent of its maximum capacity (the lowest load the 80 PLUS standard measures). This is important for when a PC is idle with its power-saving features turned on.| Efficiency at Low Loads - FSP SDA2-650 | |||||||||
|---|---|---|---|---|---|---|---|---|---|
| Test # | 12 V | 5 V | 3.3 V | 5 VSB | Power (DC/AC) | Efficiency | Fan Speed | PSU Noise | PF/AC Volts |
| 1 | 2.848A | 0.496A | 0.482A | 0.196A | 39.583W | 81.559% | 0 RPM | <6.0 dB(A) | 0.690 |
| 12.109V | 5.037V | 3.310V | 5.112V | 48.533W | 230.32V | ||||
| 2 | 4.106A | 0.993A | 0.995A | 0.392A | 59.985W | 84.682% | 1644 RPM | 24.8 dB(A) | 0.864 |
| 12.102V | 5.037V | 3.310V | 5.102V | 70.836W | 230.32V | ||||
| 3 | 5.298A | 1.491A | 1.480A | 0.589A | 79.479W | 86.925% | 1645 RPM | 24.8 dB(A) | 0.903 |
| 12.095V | 5.034V | 3.307V | 5.092V | 91.434W | 230.32V | ||||
| 4 | 6.555A | 1.989A | 1.994A | 0.787A | 99.875W | 88.296% | 1648 RPM | 24.8 dB(A) | 0.929 |
| 12.094V | 5.031V | 3.306V | 5.082V | 113.114W | 230.32V | ||||
Efficiency
Using the results that we gathered so far, we plotted a chart showing the SDA2-650's efficiency at low loads and loads ranging from 10 to 110 percent of its maximum-rated capacity.


Efficiency with light loads is high enough. With normal loads, the unit falls behind the competition, though. As you can see in the graph above, FSP's other platform, used in the EVGA 650 GM, performs much better.
5VSB Efficiency
| 5VSB Efficiency - FSP SDA2-650 | ||||
|---|---|---|---|---|
| Test # | 5VSB | Power (DC/AC) | Efficiency | PF/AC Volts |
| 1 | 0.100A | 0.512W | 59.953% | 0.044 |
| 5.122V | 0.854W | 230.33V | ||
| 2 | 0.250A | 1.280W | 69.414% | 0.091 |
| 5.117V | 1.844W | 230.33V | ||
| 3 | 0.550A | 2.809W | 71.952% | 0.173 |
| 5.106V | 3.904W | 230.33V | ||
| 4 | 1.000A | 5.091W | 71.473% | 0.257 |
| 5.090V | 7.123W | 230.33V | ||
| 5 | 1.500A | 7.613W | 72.810% | 0.309 |
| 5.074V | 10.456W | 230.33V | ||
| 6 | 2.500A | 12.602W | 72.404% | 0.366 |
| 5.040V | 17.405W | 230.41V | ||
The 5VSB regulator needs upgrades for improved efficiency. FSP has highly efficient 5VSB regulator circuits, which has me wonder why its engineers used this one.
Power Consumption in Idle and Standby
| Idle / Standby - FSP SDA2-650 | ||||||
|---|---|---|---|---|---|---|
| Mode | 12 V | 5 V | 3.3 V | 5VSB | Power (AC) | PF/AC Volts |
| Idle | 12.111V | 5.039V | 3.311V | 5.124V | 7.858W | 0.254 |
| 230.4V | ||||||
| Standby | 0.206W | 0.010 | ||||
| 230.4V | ||||||
Fan RPM, Delta Temperature and Output Noise
The following results were obtained at 37–47 °C ambient.

The following results were obtained at 30–32 °C ambient.


Apr 25th, 2024 04:57 EDT
change timezone
Latest GPU Drivers
New Forum Posts
- Meta Horizon OS (16)
- Core i5-6300U (14)
- (Anti) SFF fun house (351)
- Alphacool CORE 1 CPU block - bulging with danger of splitting? (4)
- The TPU UK Clubhouse (24786)
- Github comments used to push malware via Microsoft repo urls (3)
- Bizarre Throttlestop issue (5)
- GTX 1070 Ti - TDP Issues - Always Power Throttling (5)
- What phone you use as your daily driver? And, a discussion of them. (1471)
- What's your latest tech purchase? (20337)
Popular Reviews
- Fractal Design Terra Review
- Thermalright Phantom Spirit 120 EVO Review
- Corsair 2000D Airflow Review
- Minisforum EliteMini UM780 XTX (AMD Ryzen 7 7840HS) Review
- ASUS GeForce RTX 4090 STRIX OC Review
- NVIDIA GeForce RTX 4090 Founders Edition Review - Impressive Performance
- ASUS GeForce RTX 4090 Matrix Platinum Review - The RTX 4090 Ti
- MSI GeForce RTX 4090 Suprim X Review
- MSI GeForce RTX 4090 Gaming X Trio Review
- Gigabyte GeForce RTX 4090 Gaming OC Review
Controversial News Posts
- Sony PlayStation 5 Pro Specifications Confirmed, Console Arrives Before Holidays (116)
- NVIDIA Points Intel Raptor Lake CPU Users to Get Help from Intel Amid System Instability Issues (106)
- AMD "Strix Halo" Zen 5 Mobile Processor Pictured: Chiplet-based, Uses 256-bit LPDDR5X (101)
- US Government Wants Nuclear Plants to Offload AI Data Center Expansion (98)
- Windows 10 Security Updates to Cost $61 After 2025, $427 by 2028 (84)
- Developers of Outpost Infinity Siege Recommend Underclocking i9-13900K and i9-14900K for Stability on Machines with RTX 4090 (84)
- Windows 11 Now Officially Adware as Microsoft Embeds Ads in the Start Menu (80)
- TechPowerUp Hiring: Reviewers Wanted for Motherboards, Laptops, Gaming Handhelds and Prebuilt Desktops (78)