 3
3
G-Wolves Hati-S Plus 4K Review
Testing 4000 Hz Wireless »Sensor and Performance
The G-Wolves Hati-S Plus 4K is equipped with the PixArt PAW3399. According to specifications, the 3399 is capable of up to 20,000 CPI, as well as a maximum tracking speed of 650 IPS, which equals 16.51 m/s. Out of the box, four pre-defined CPI steps are available: 400, 800, 1600, and 3200.All testing was done on the latest firmware (2023-03-22). As such, results obtained on earlier firmware versions may differ from those presented hereafter.
CPI Accuracy
"CPI" (short for counts per inch) describes the number of counts registered by the mouse if it is moved exactly an inch. There are several factors (firmware, mounting height of the sensor not meeting specifications, mouse feet thickness, mousing surface, among others) which may contribute to nominal CPI not matching actual CPI. It is impossible to always achieve a perfect match, but ideally, nominal and actual CPI should differ as little as possible. In this test, I'm determining whether this is the case or not. However, please keep in mind that said variance will still differ from unit to unit, so your mileage may vary.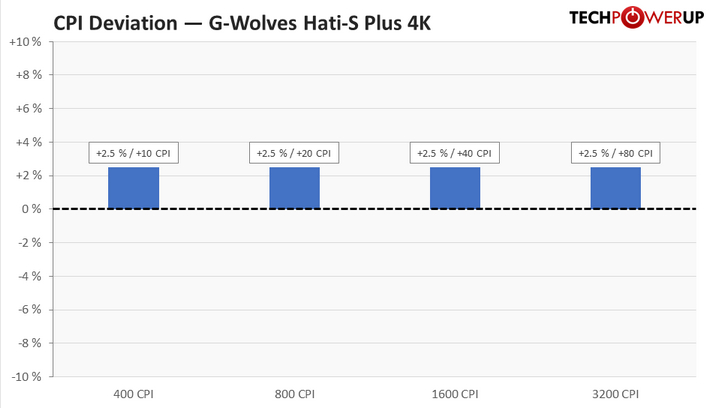
I've restricted my testing to the four most common CPI steps, which are 400, 800, 1600, and 3200. As you can see, deviation is consistently positive and low, which is a very good result. In order to account for the measured deviation, adjusted steps of 400, 800, 1550, and 3100 CPI have been used for testing.
Motion Delay
"Motion delay" encompasses all kinds of sensor lag. Any further sources of input delay will not be recorded in this test. The main thing I'll be looking for in this test is sensor smoothing, which describes an averaging of motion data across several capture frames in order to reduce jitter at higher CPI values, increasing motion delay along with it. The goal here is to have as little smoothing as possible. As there is no way to accurately measure motion delay absolutely, it can only be done by comparison with a control subject that has been determined to have the lowest possible motion delay. In this case, the control subject is a G403, whose PMW3366 has no visible smoothing across the entire CPI range. Note that the G403 is moved first and thus receives a slight head start.Wired testing
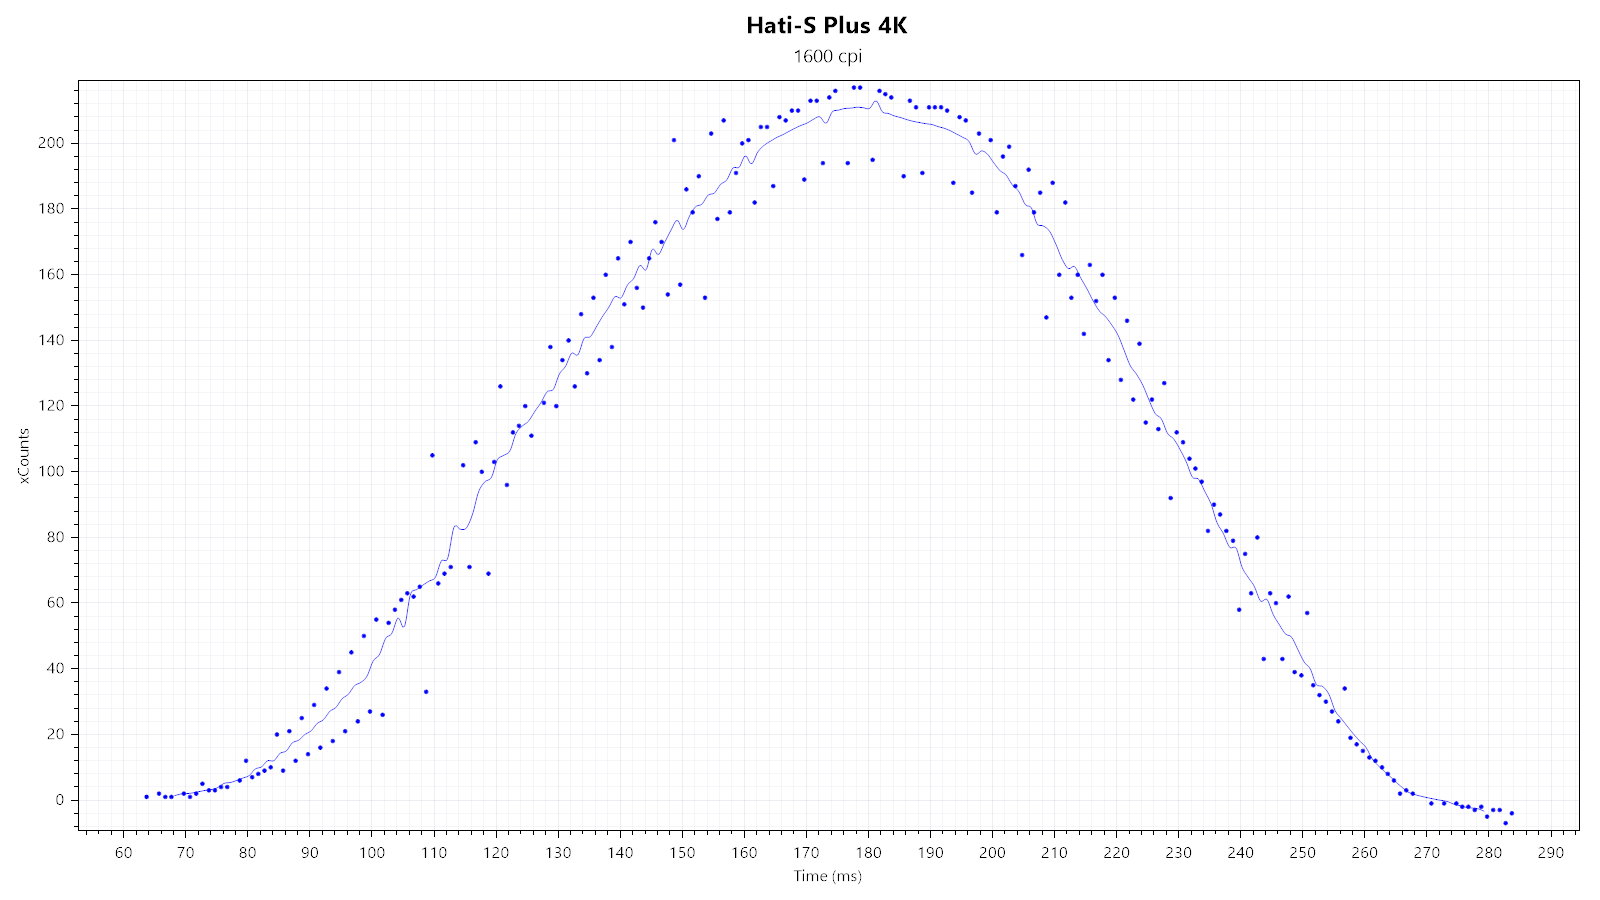

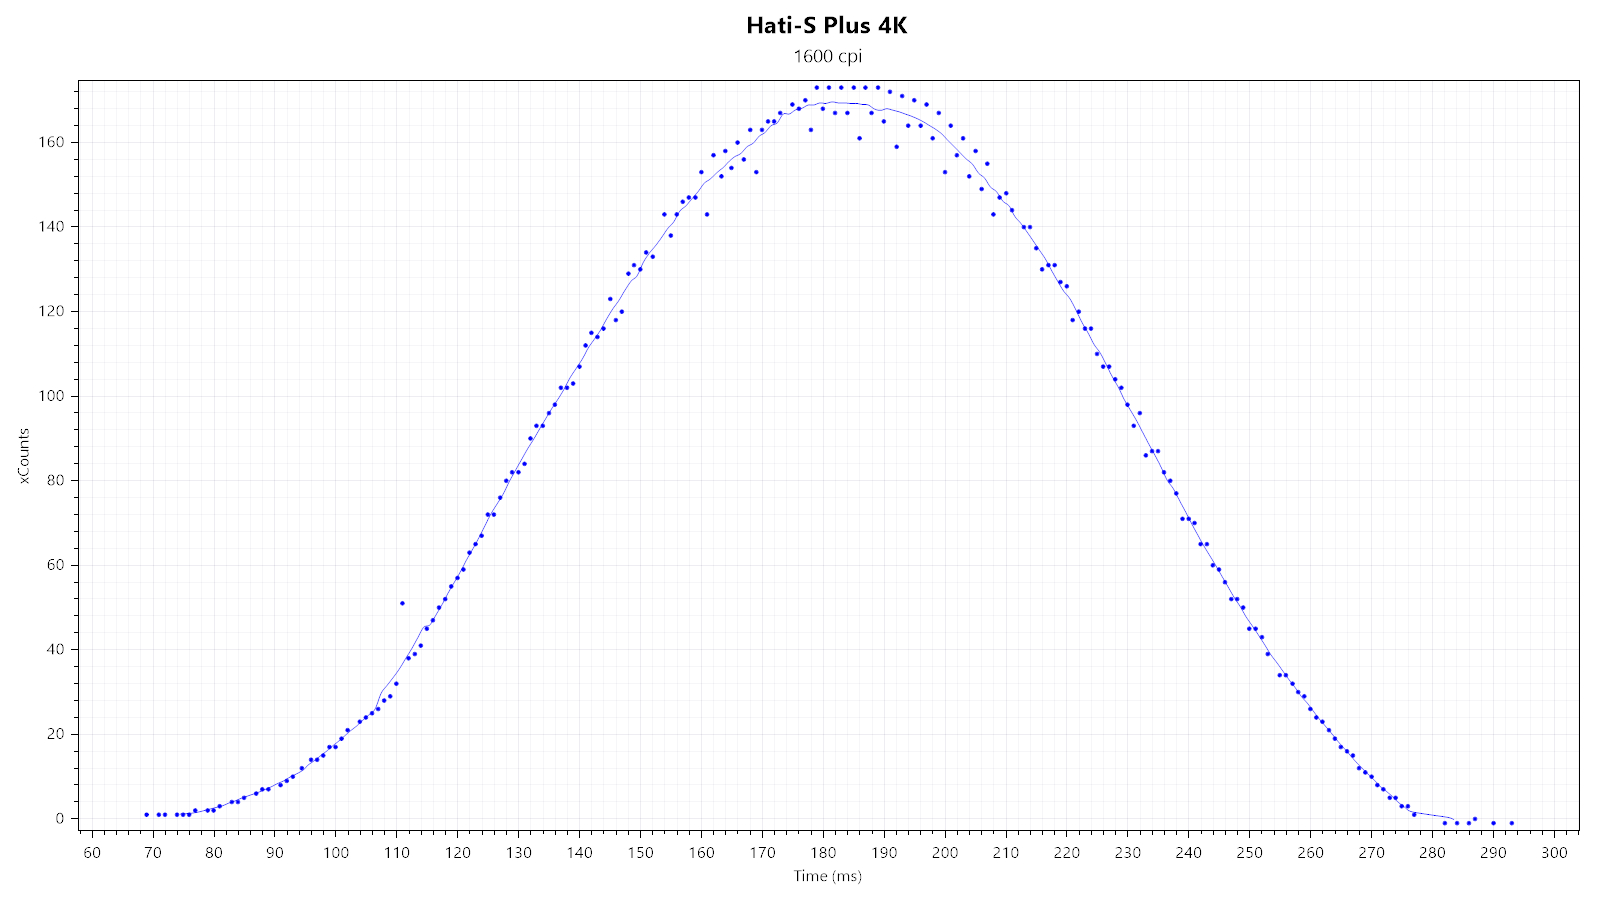
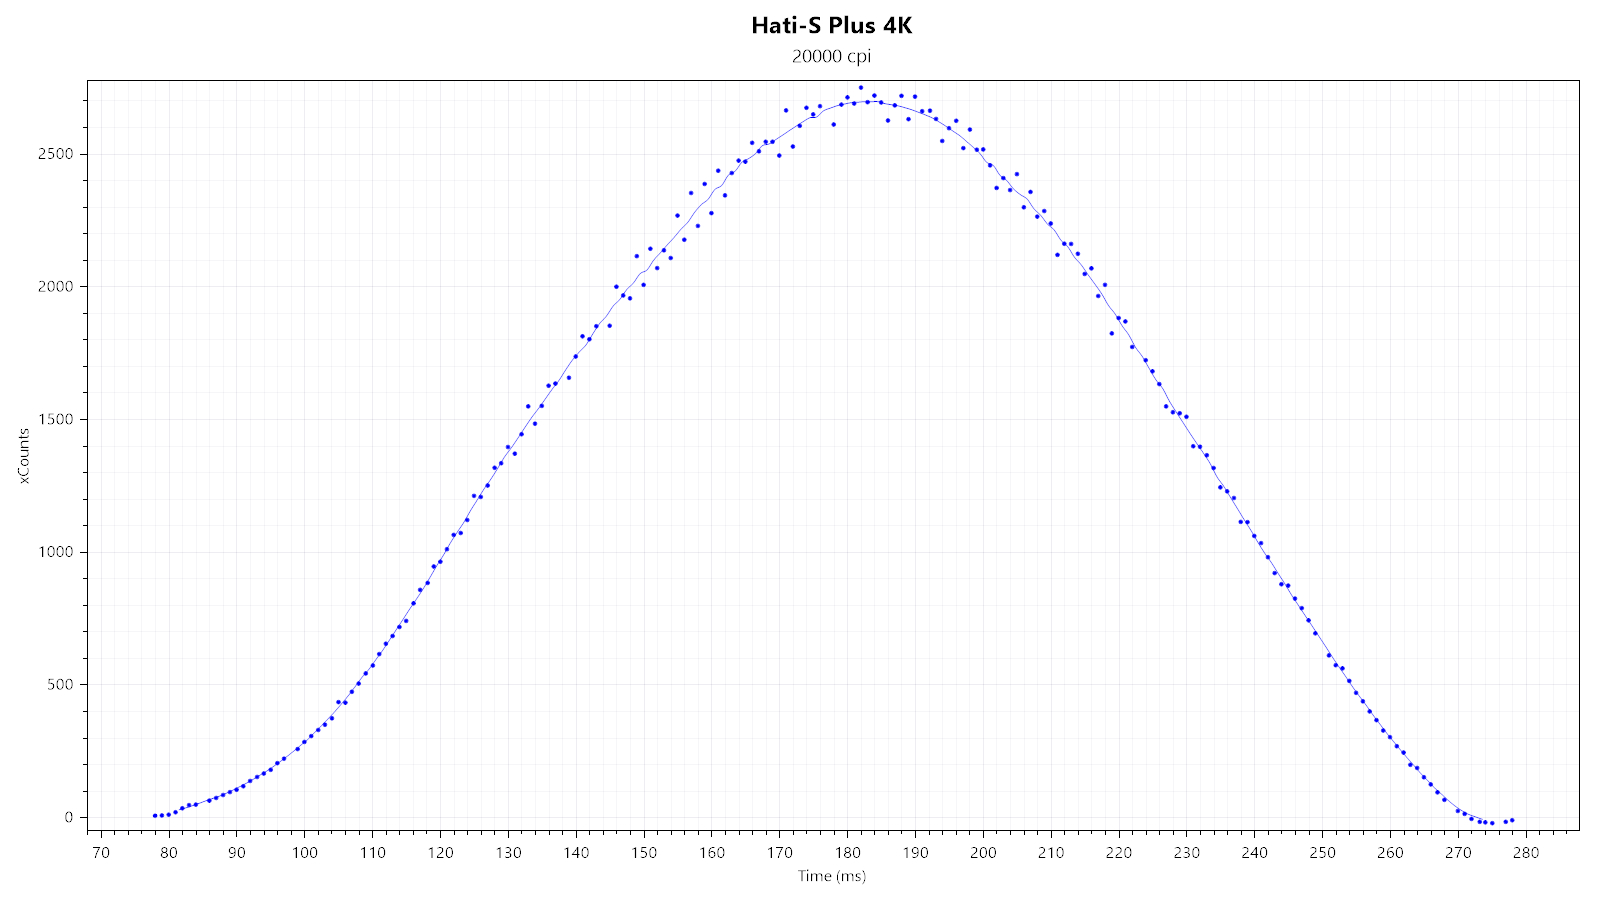
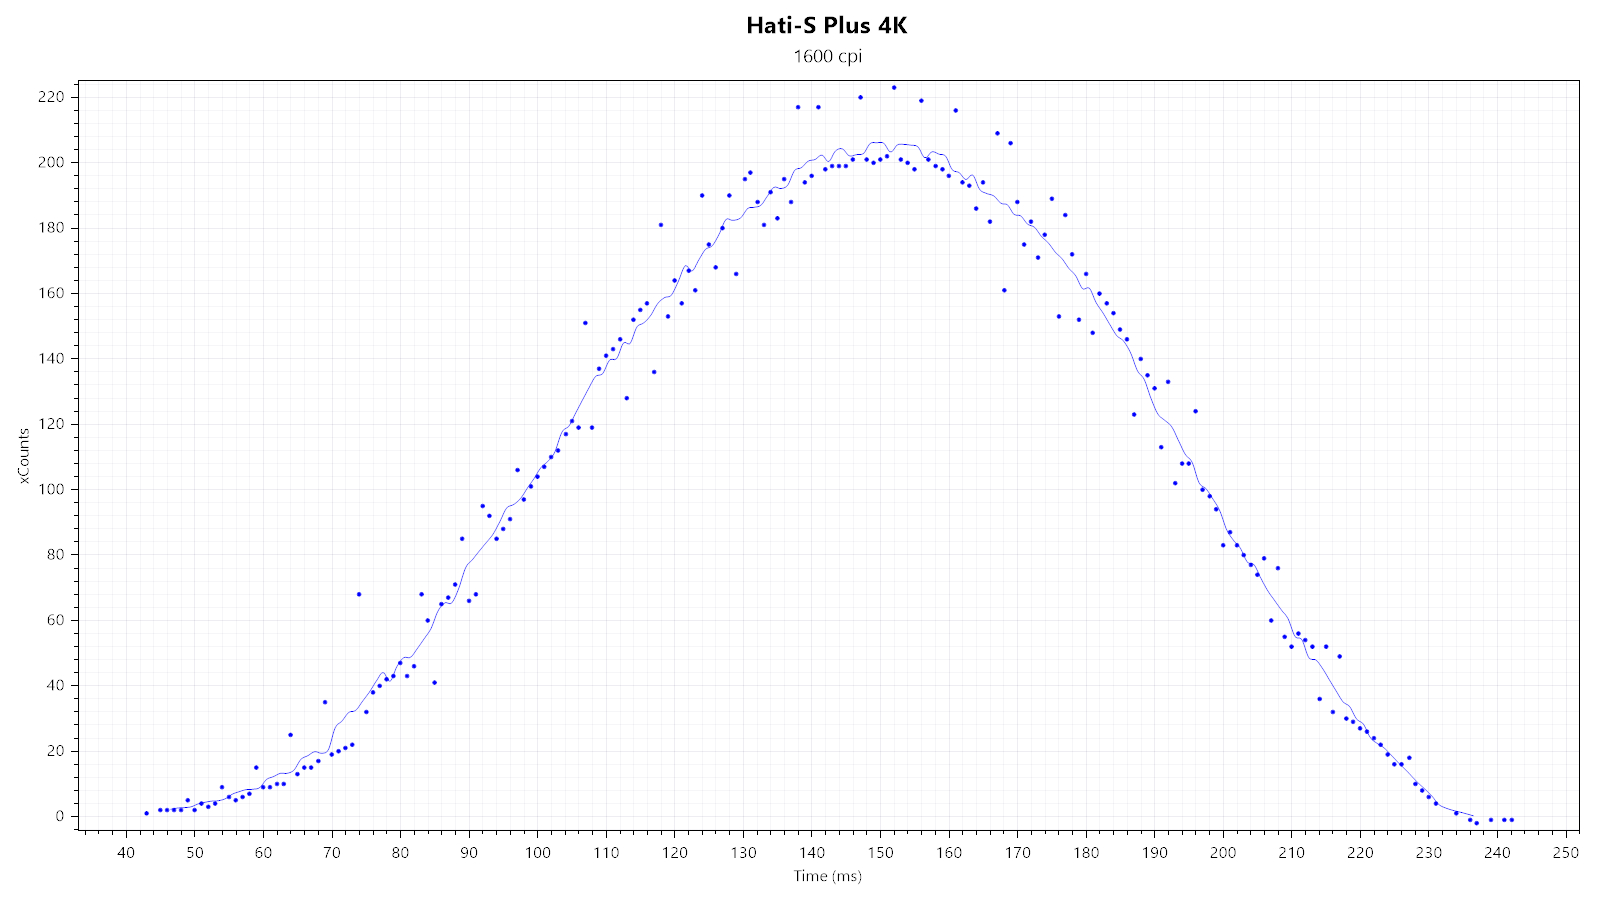
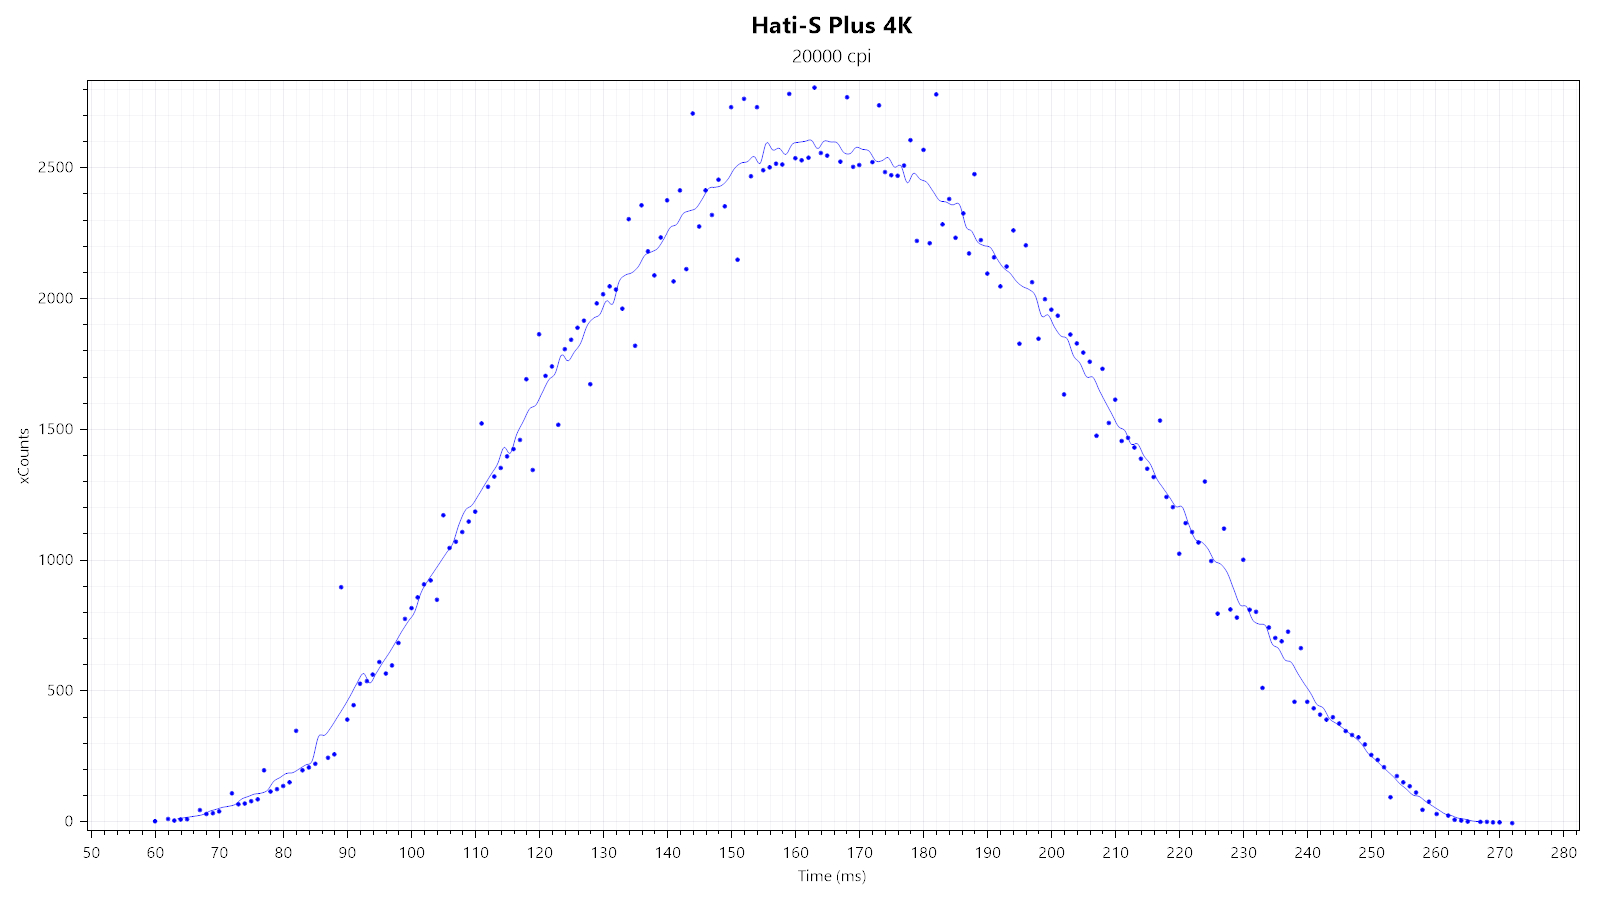
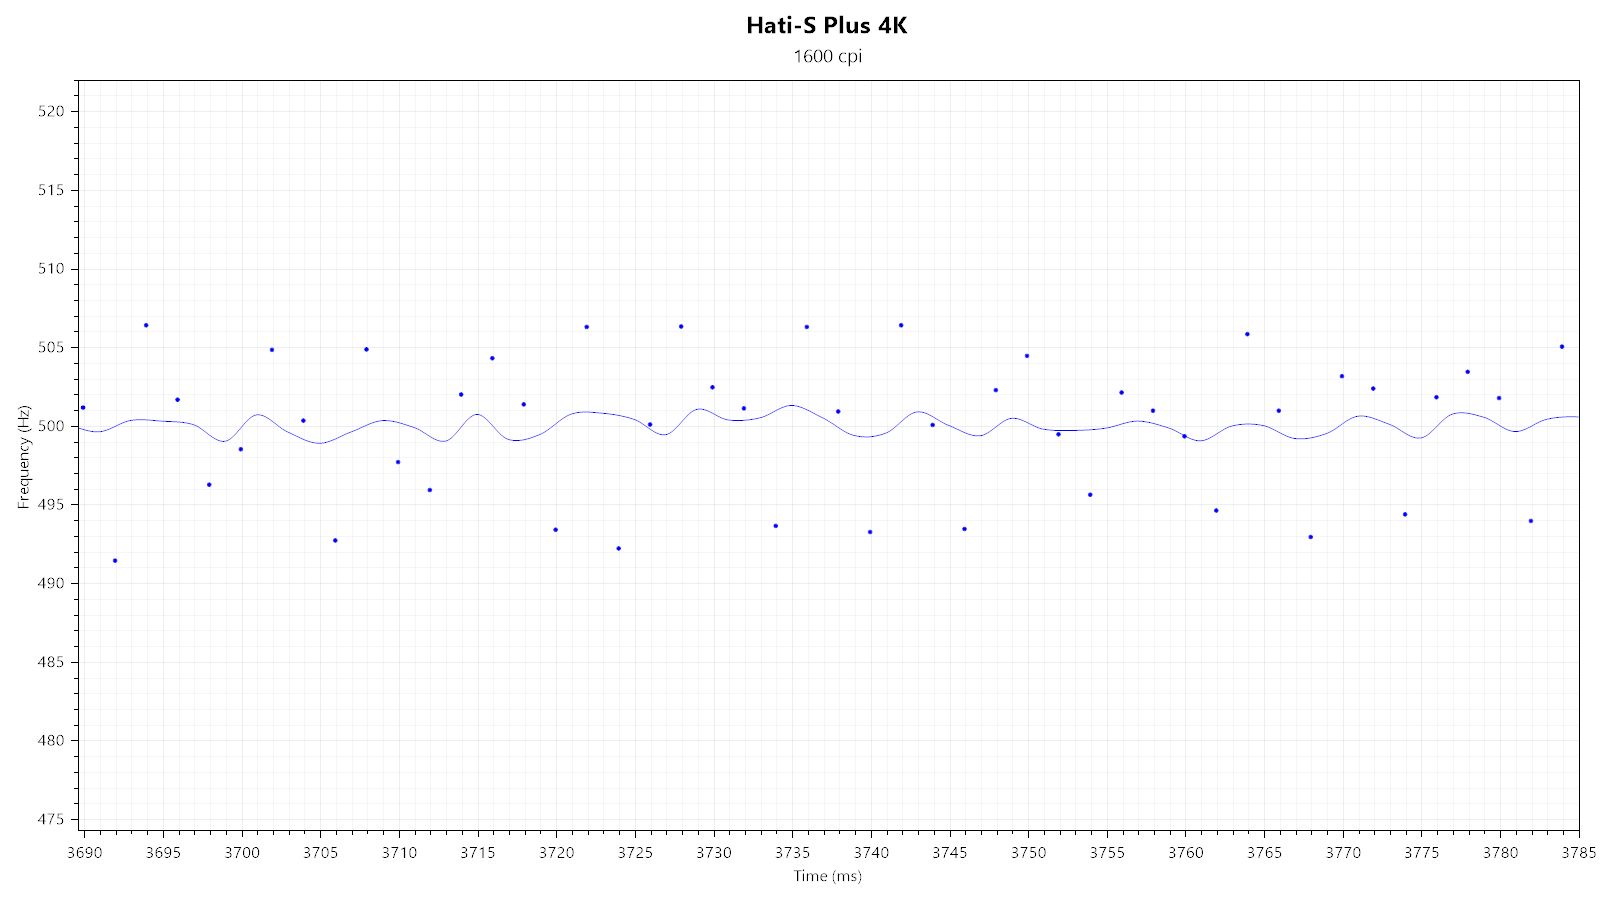
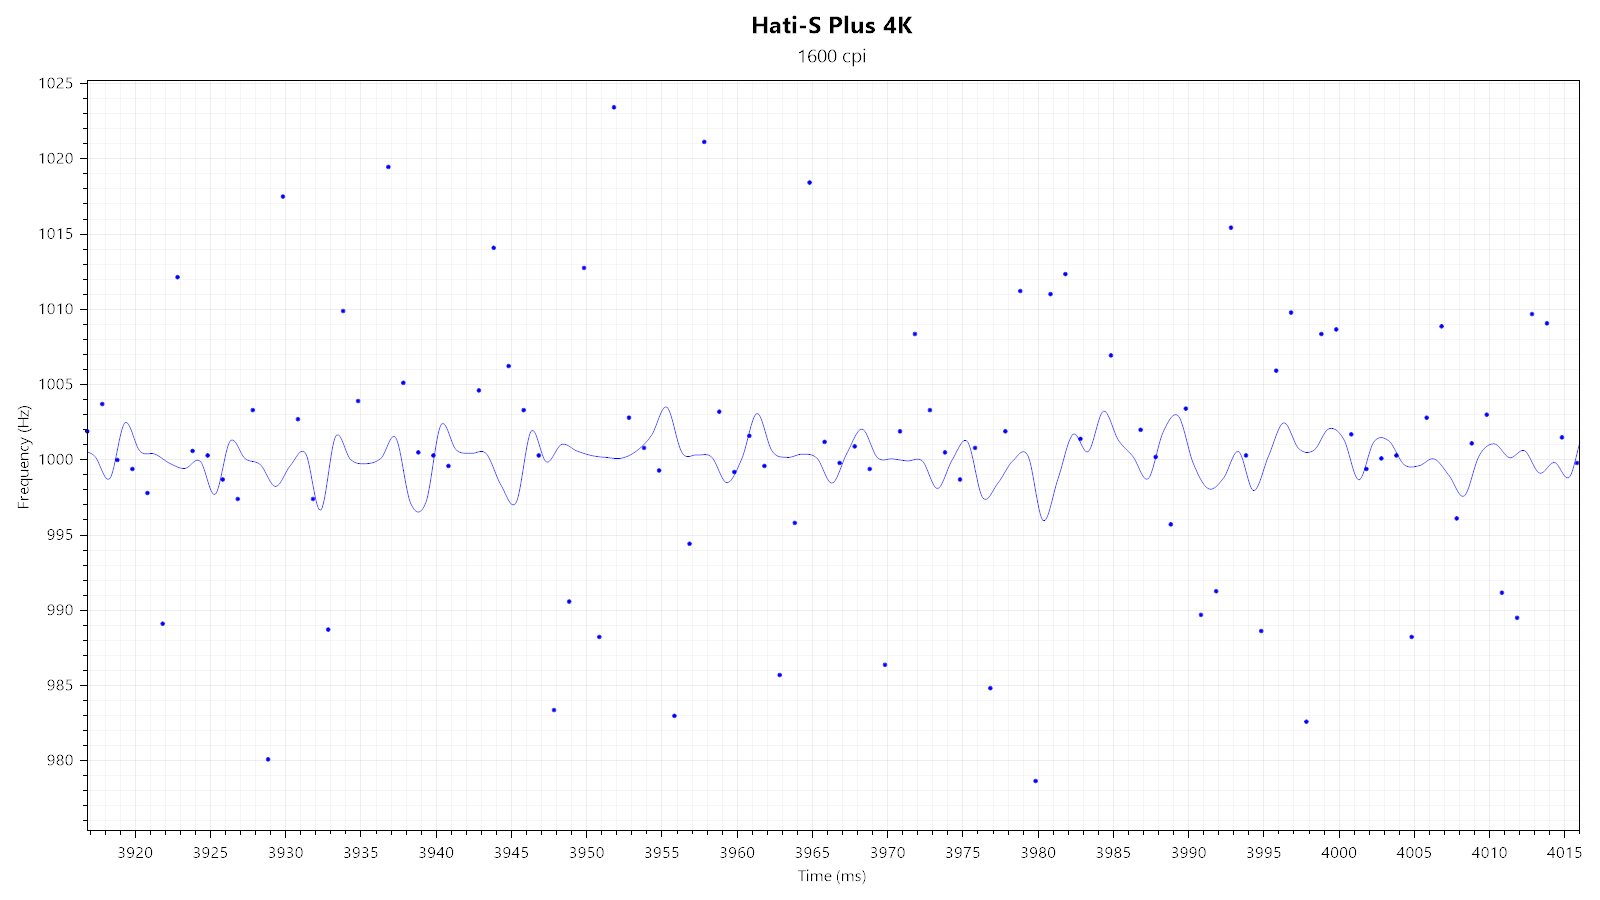
First, I'm looking at two xCounts plots—generated at 1600 and 20,000 CPI—to quickly gauge whether there is any smoothing, which would be indicated by any visible "kinks." No such kinks are visible in either plot, indicating there not being any smoothing.
The Hati-S Plus 4K also allows enabling MotionSync, which effectively synchronizes SPI reads with USB polls, resulting in very low SPI timing jitter as seen above.


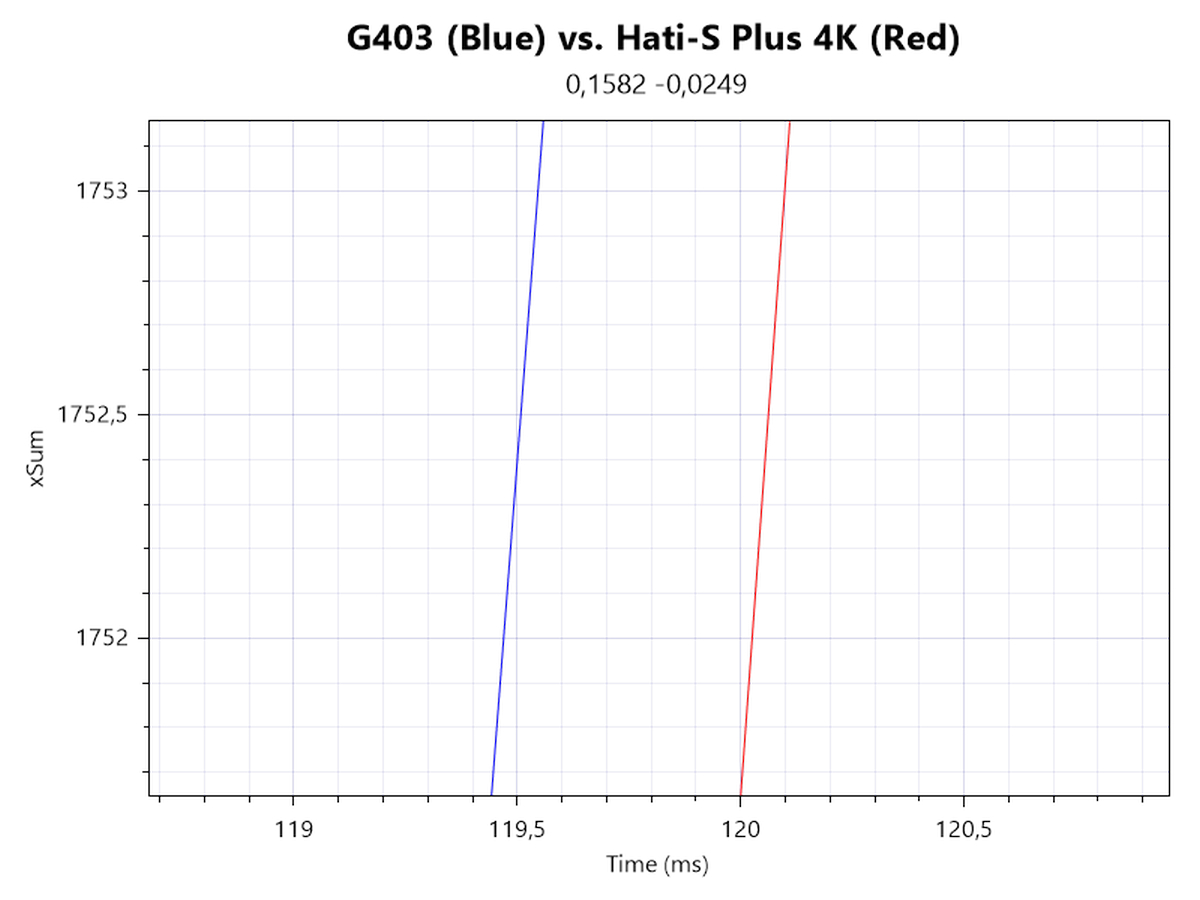
In order to determine motion delay, I'm looking at xSum plots generated at 1600 and 20,000 CPI, both without (first row) and with (second row) MotionSync. The line further to the left denotes the sensor with less motion delay. Without MotionSync, there is no motion delay differential at either step. With MotionSync, a minor motion delay (<0.5 ms) is added. Much like on the Hati-S Plus ACE, motion delay is increased by roughly 1–1.5 ms at the onset of motion due to sensor framerate ramp-up.
Wireless testing
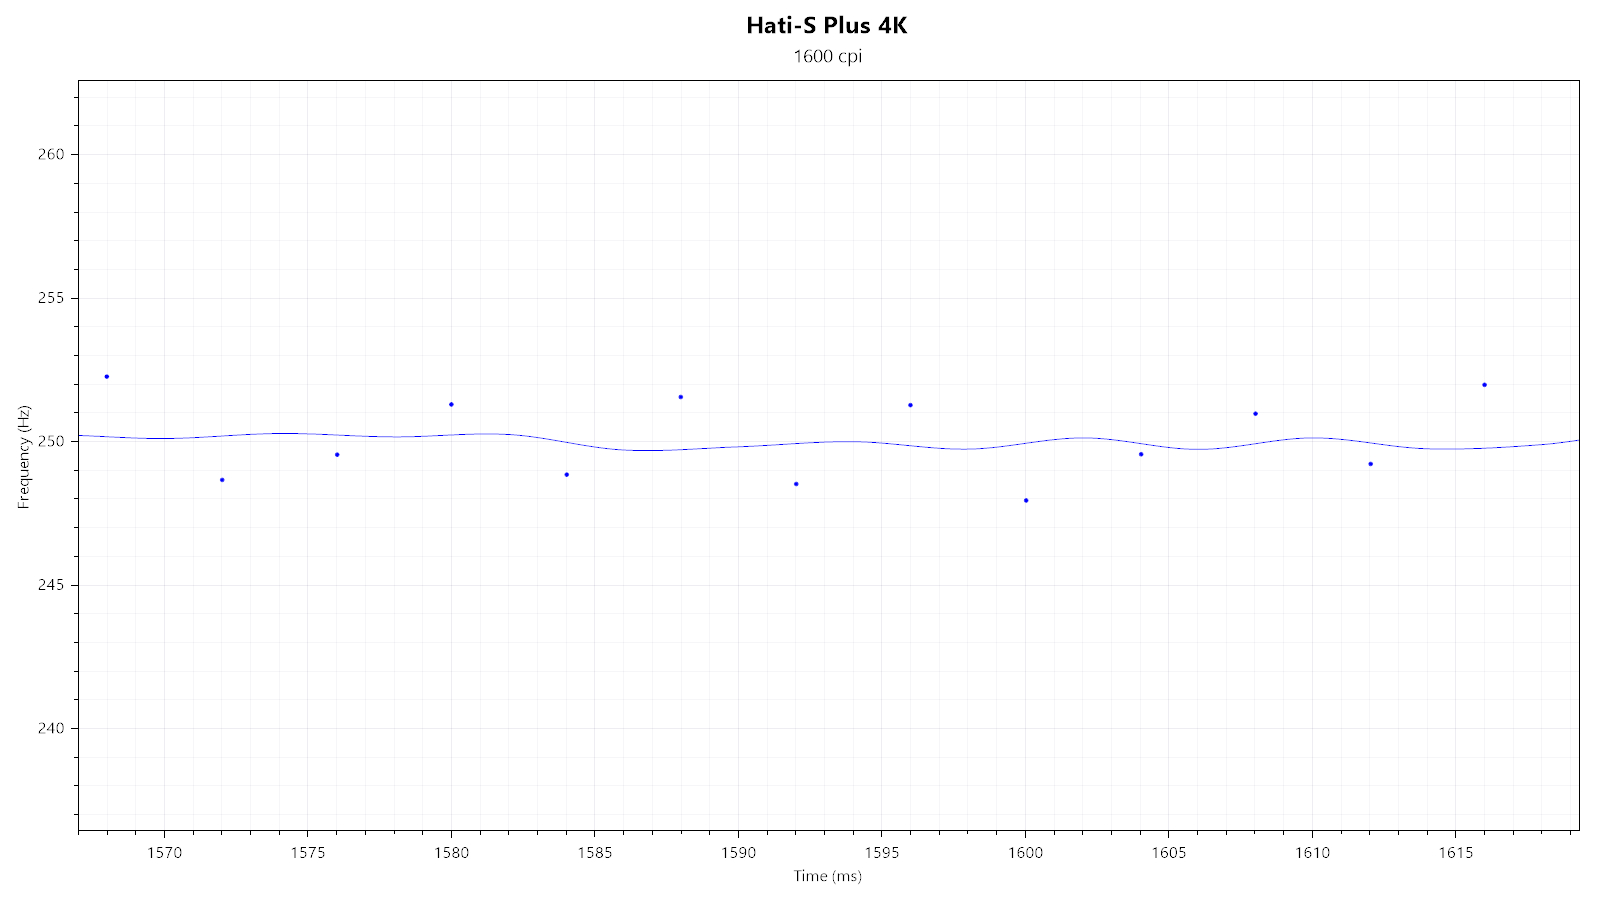
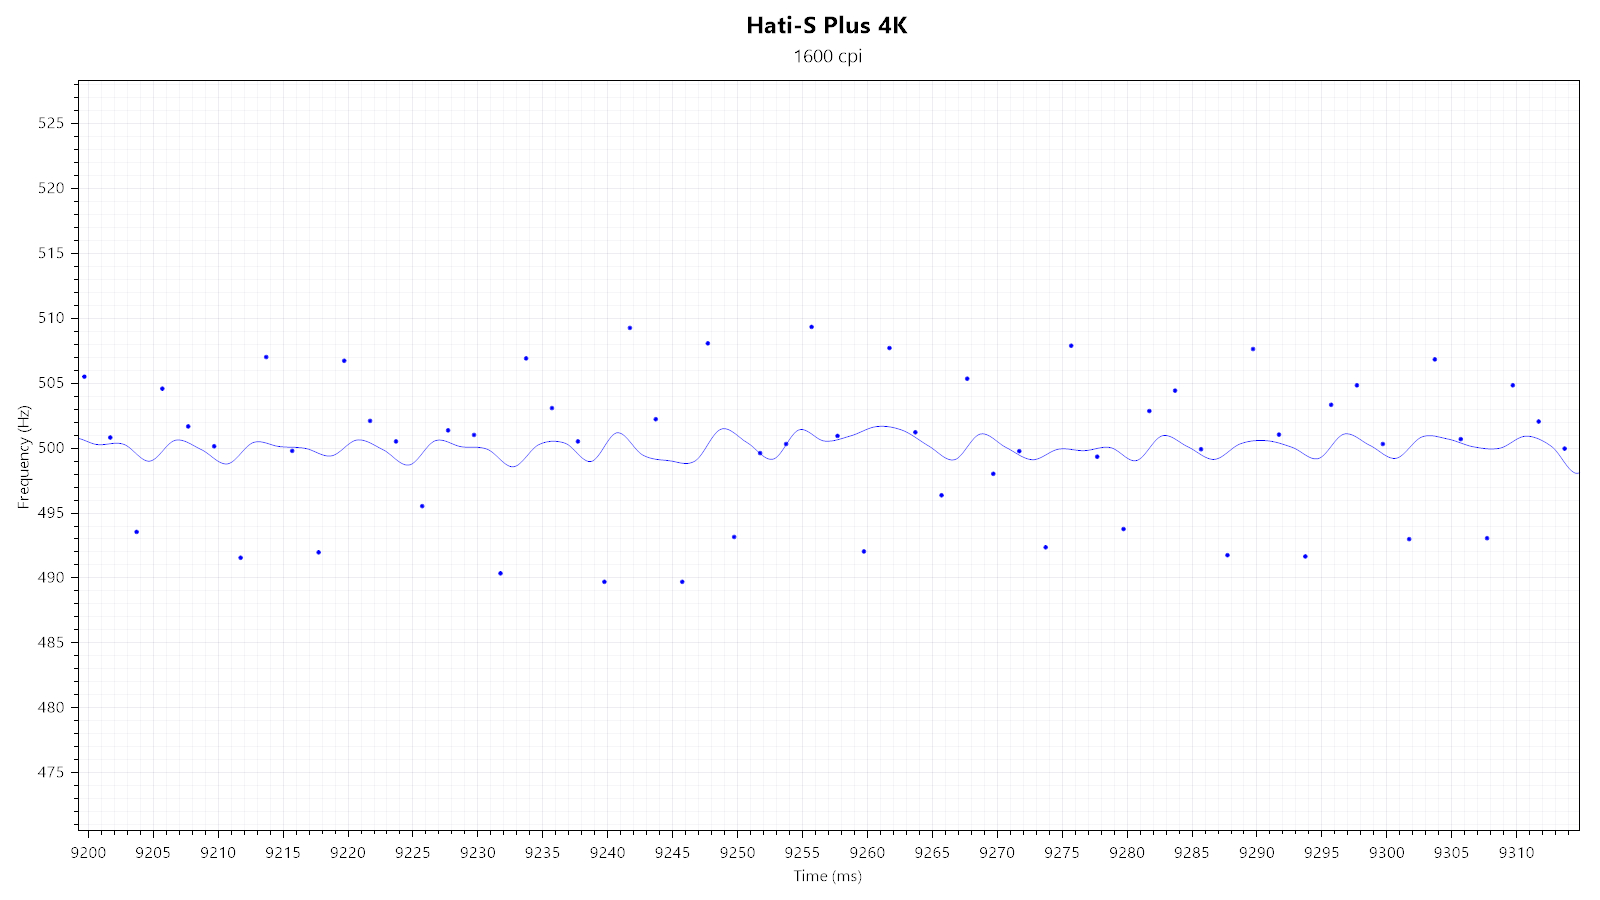
Not much changes when running the Hati-S Plus 4K in wireless mode as SPI timing jitter and general tracking are virtually on the same level as when wired.


This also applies with MotionSync enabled.


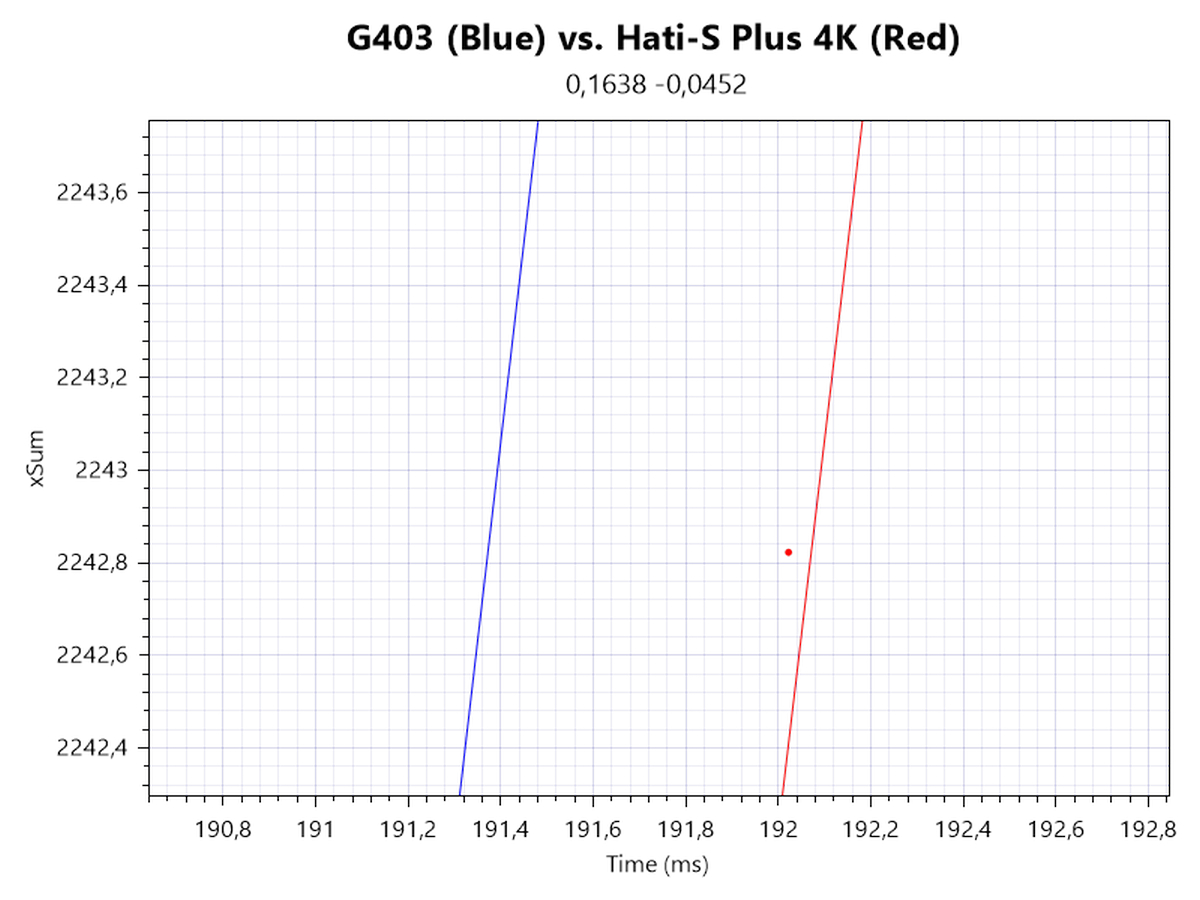
Once again, 1600 and 20,000 CPI both without (first row) and with (second row) MotionSync are tested. Without MotionSync, a motion delay differential of roughly 0.5 ms can be measured. With MotionSync, a minor motion delay (<0.5 ms) is added once again, resulting in a total motion delay differential of roughly 1 ms.
Speed-related Accuracy Variance (SRAV)

What people typically mean when they talk about "acceleration" is speed-related accuracy variance (SRAV for short). It's not about the mouse having a set amount of inherent positive or negative acceleration, but about the cursor not traveling the same distance if the mouse is moved the same physical distance at different speeds. The easiest way to test this is by comparison with a control subject that is known to have very low SRAV, which in this case is the G403. As you can see from the plot, no displacement between the two cursor paths can be observed, which confirms that SRAV is very low.
Perfect Control Speed

Perfect Control Speed (or PCS for short) is the maximum speed up to which the mouse and its sensor can be moved without the sensor malfunctioning in any way. I've only managed to hit a measly 5.0 m/s, which is within the proclaimed PCS range and results in no observable sign of the sensor malfunctioning.
Polling Rate Stability
Considering the Hati-S Plus 4K is usable as a regular wired mouse as well, I'll be testing polling rate stability for both wired and wireless use.Wired testing


All of the available polling rates (125, 250, 500, and 1000 Hz) look nice and stable.
Wireless testing
For wired mice, polling rate stability merely concerns the wired connection between the mouse (SPI communication) and the USB. For wireless mice, another device that needs to be kept in sync between the first two is added to the mix: the wireless dongle/wireless receiver. I'm unable to measure all stages of the entire end-to-end signal chain individually, so testing polling-rate stability at the endpoint (the USB) has to suffice here.

First, I'm testing whether SPI, wireless, and USB communication are synchronized. Any of these being out of sync would be indicated by at least one 2 ms report, which would be the result of any desynchronization drift accumulated over time. I'm unable to detect any periodic off-period polls that would be indicative of a desynchronization drift.


Second, I'm testing the general polling-rate stability of the individual polling rates in wireless mode. Running the Hati-S Plus 4K at a lower polling rate can have the benefit of extending battery life. All of the available polling rates look and perform fine.
Paint Test
This test is used to indicate any potential issues with angle snapping (non-native straightening of linear motion) and jitter, along with any sensor lens rattle. As you can see, no issues with angle snapping can be observed. No jitter is visible at 1600 CPI. 10,000 CPI shows moderate jitter, which is amplified to major levels at 20,000 CPI. This is in line with what to expect from a sensor lacking any smoothing. Lastly, there is no sensor lens movement.
Lift-off Distance
The Hati-S Plus 4K offers two pre-defined LOD levels. At the "Low" setting, the sensor does not track at a height of 1 DVD (<1.2 mm). Using the "High" setting, the sensor does track at a height of 1 DVD (1.2 mm<x<2.4 mm, with x being LOD height), but not at a height of 2 DVDs. Keep in mind that LOD may vary slightly depending on the mousing surface (pad) it is being used on.Click Latency

In most computer mice, debouncing is required to avoid double clicks, slam-clicks, or other unintended effects of switch bouncing. Debouncing typically adds a delay, which, along with any potential processing delay, shall be referred to as click latency. In order to measure click latency, the mouse has been interfaced with an NVIDIA LDAT (Latency Display Analysis Tool). Many thanks go to NVIDIA for providing an LDAT device. More specifically, the LDAT measures the time between the electrical activation of the left main button and the OS receiving the button-down message. Unless noted otherwise, the values presented in the graph refer to the lowest click latency possible on the mouse in question. If a comparison mouse is capable of both wired and wireless operation, only the result for wireless (2.4 GHz) operation will be listed.
Unlike on the Hati-S Plus ACE, click latency will behave normally when using the latest firmware in conjunction with the older software. Still, exclusively using the latest software is recommended.
Unless specified otherwise, only the lowest debounce setting ("A") has been used. In wired mode at 1000 Hz, click latency has been measured to be roughly 0.5 ms, with standard deviation being 0.22 ms. In wireless mode at 1000 Hz, click latency has been measured to be roughly 0.8 ms, with standard deviation being 0.27 ms. In wireless mode at 2000 Hz, click latency has been measured to be roughly 0.6 ms, with standard deviation being 0.11 ms. Finally, in wireless mode at 4000 Hz, click latency has been measured to be roughly 0.6 ms, with standard deviation being 0.09 ms. When using the "B" setting, click latency is 1.4 ms likewise for wired 1000 Hz as well as wireless 1000, 2000, and 4000 Hz.
The main button switches were measured to be running at 1.985 V. I'm not aware of the voltage specifications of the Zippy DF3-P1L1 (60 M) switches, but find this voltage to be rather low.
May 11th, 2024 15:24 EDT
change timezone
Latest GPU Drivers
New Forum Posts
- Copper Shims on Chipset (174)
- Air makes its way from the reservoir into the radiator. (1)
- Ryzen Owners Zen Garden (7297)
- What's an inexpensive AIO product line with a strong pump and low price? (98)
- Soundbar or 2.1 speaker for virtual 3d audio in PC games... (2)
- X670 owners, what kind of PCH temps do you you see? (17)
- 2024 and STILL no dark mode? (26)
- LOL ASUS says this is $200 in repair, Steve from gamers Nexus smokes ASUS, Steam Deck til I die boys!!!! (61)
- NVME underperforming (15)
- Intel Core Ultra 9 185H - PROCHOT (4)
Popular Reviews
- Bykski CPU-XPR-C-I CPU Water Block Review - Amazing Value!
- ZMF Caldera Closed Planar Magnetic Headphones Review
- CHERRY XTRFY M64 Pro Review
- ThundeRobot ML903 NearLink Review
- Corsair MP700 Pro SE 4 TB Review
- Corsair iCUE Link RX120 RGB 120 mm Fan Review
- Upcoming Hardware Launches 2023 (Updated Feb 2024)
- AMD Ryzen 7 7800X3D Review - The Best Gaming CPU
- Finalmouse UltralightX Review
- ASUS Radeon RX 7900 GRE TUF OC Review
Controversial News Posts
- Intel Statement on Stability Issues: "Motherboard Makers to Blame" (266)
- AMD to Redesign Ray Tracing Hardware on RDNA 4 (206)
- Windows 11 Now Officially Adware as Microsoft Embeds Ads in the Start Menu (171)
- NVIDIA to Only Launch the Flagship GeForce RTX 5090 in 2024, Rest of the Series in 2025 (144)
- Sony PlayStation 5 Pro Specifications Confirmed, Console Arrives Before Holidays (119)
- AMD's RDNA 4 GPUs Could Stick with 18 Gbps GDDR6 Memory (114)
- NVIDIA Points Intel Raptor Lake CPU Users to Get Help from Intel Amid System Instability Issues (106)
- AMD Ryzen 9 7900X3D Now at a Mouth-watering $329 (104)