 25
GEEKOM A7 Max Review
Web & Office Productivity »General Performance
AIDA64 Cache & Memory
The AIDA64 memory benchmark measures how quickly data moves between system memory and the CPU's cache hierarchy. It provides insight into bandwidth (read/write/copy speeds) and latency, which directly affect responsiveness in everyday computing and the performance of integrated graphics that share system memory.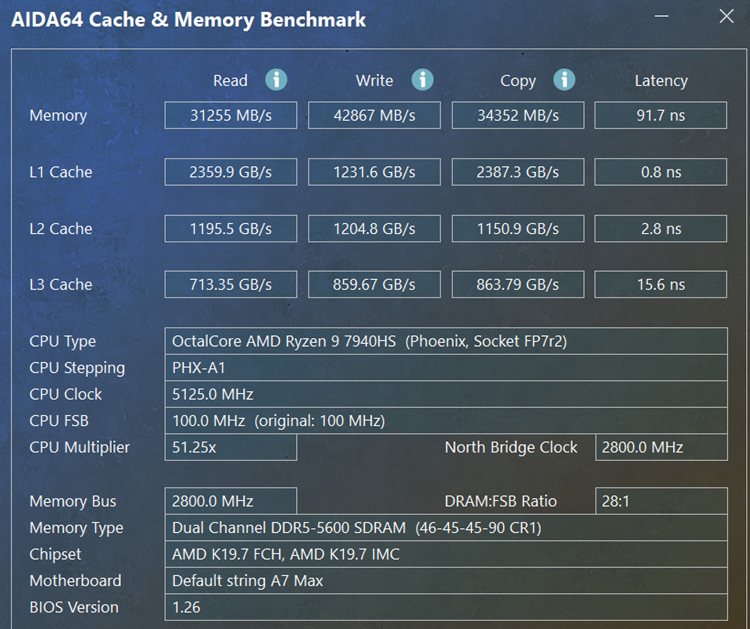
The A7 Max records 31,255 MB/s read, 42,867 MB/s write, and 34,352 MB/s copy in AIDA64, along with 91.7 ns of memory latency. That is decent bandwidth for DDR5-5600, though the latency is a bit high, so the memory looks better in throughput than in responsiveness.
As expected, cache results are much stronger: L1 cache reaches 2359.9 GB/s read, 1231.6 GB/s write, and 2387.3 GB/s copy with 0.8 ns latency, while L2 cache posts 1195.5 GB/s read, 1204.8 GB/s write, and 1150.9 GB/s copy with 2.8 ns latency. L3 cache comes in at 713.35 GB/s read, 859.67 GB/s write, and 863.79 GB/s copy with 15.6 ns latency, so the processor side of the memory system looks very good overall.
Cinebench
Cinebench is a CPU rendering benchmark based on Maxon's Cinema 4D engine. It evaluates both single-threaded and multithreaded workloads, giving a clear picture of how a processor handles everyday tasks as well as heavier rendering scenarios.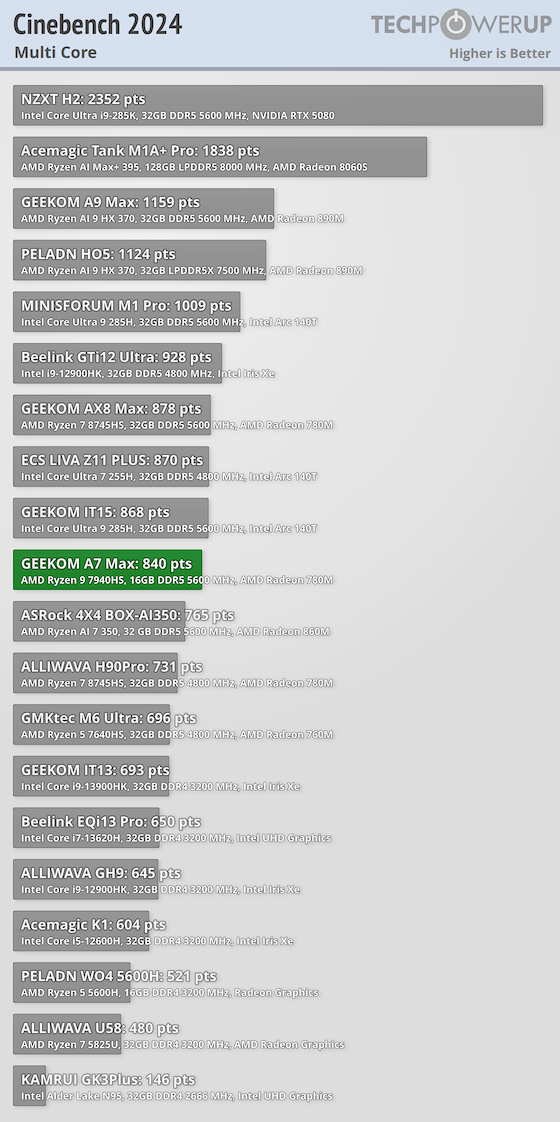
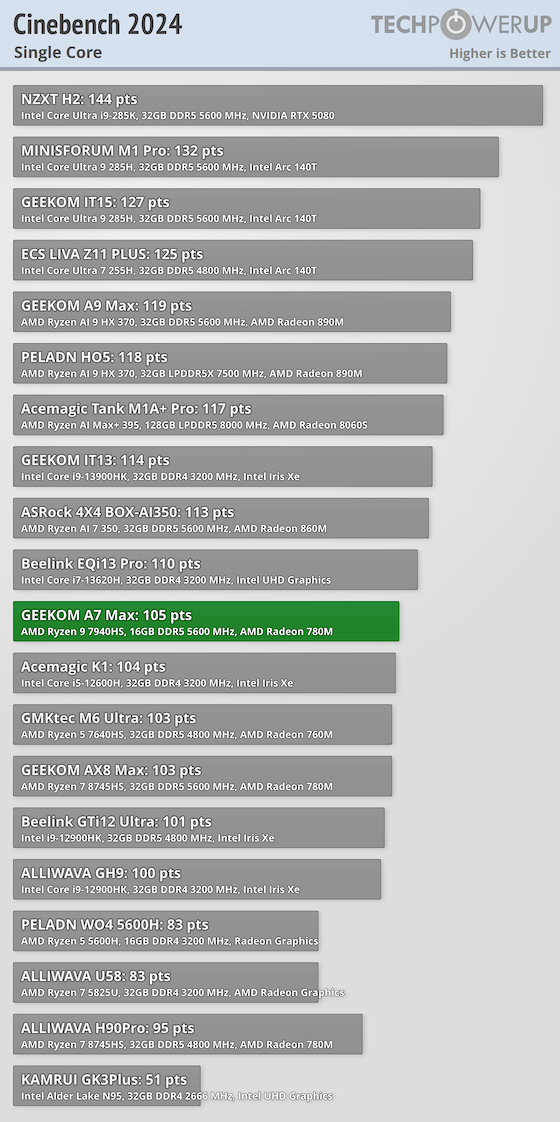
With 840 in Multi Core and 105 in Single Core, the A7 Max posts CPU numbers that are close to the middle of this mini PC group, with the Multi Core result a bit above the chart median and the Single Core score a bit below it. That is still enough for solid desktop work and longer multithreaded loads, even if newer flagship chips are faster.
7-Zip
7-Zip's built-in benchmark measures CPU performance when compressing and decompressing data. It's a good indicator of how a system handles file-heavy workloads such as packing archives, installing software, or building projects.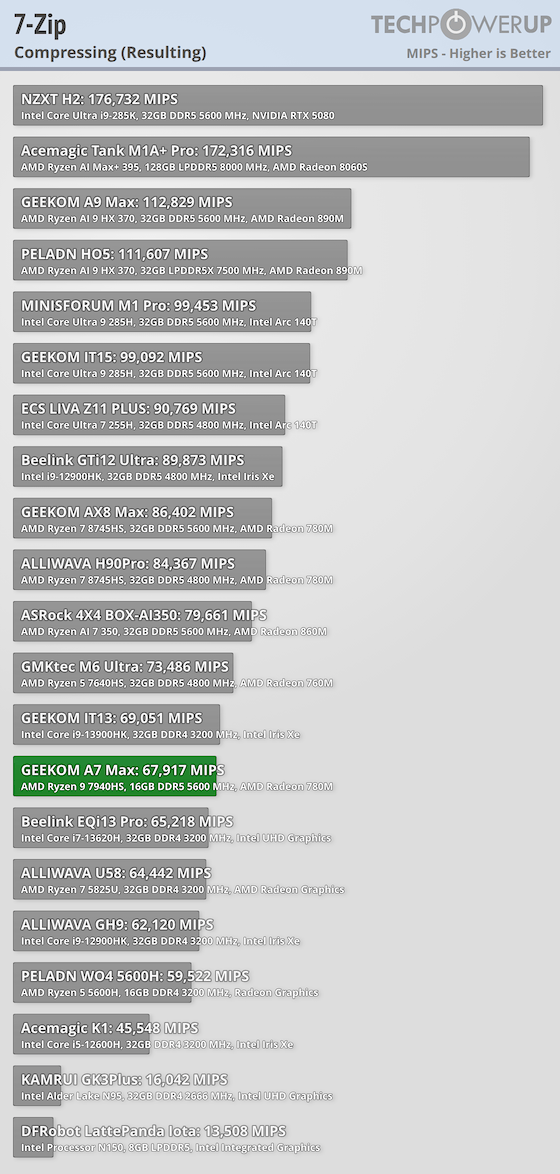
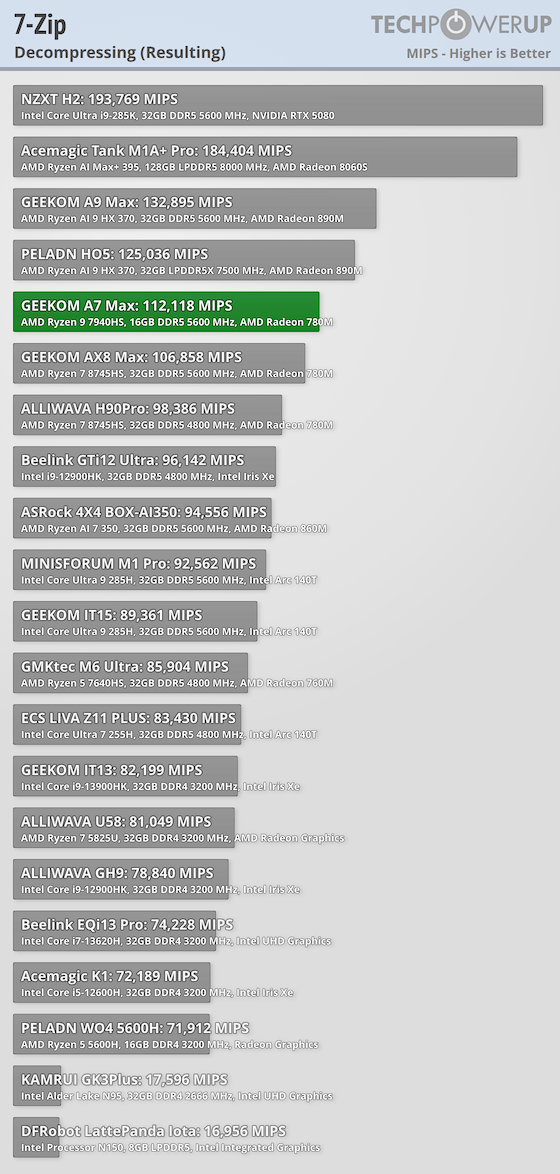
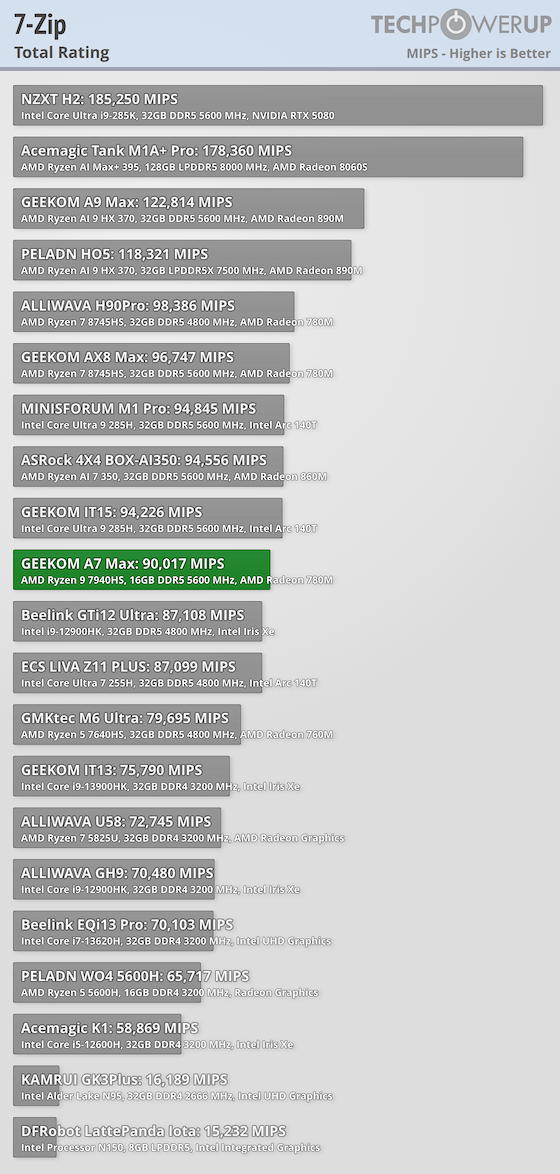
The A7 Max scores 67,917 in Compressing, 112,118 in Decompressing, and 90,017 for Total Rating, which gives it a mixed result overall. Compression is a bit weaker, but decompression is much better, which leaves the total result near the middle of the group.
PCMark 10
PCMark simulates common desktop activities across browsing, video conferencing, office apps, and media workflows. It provides a composite view of how a system will feel in day-to-day usage.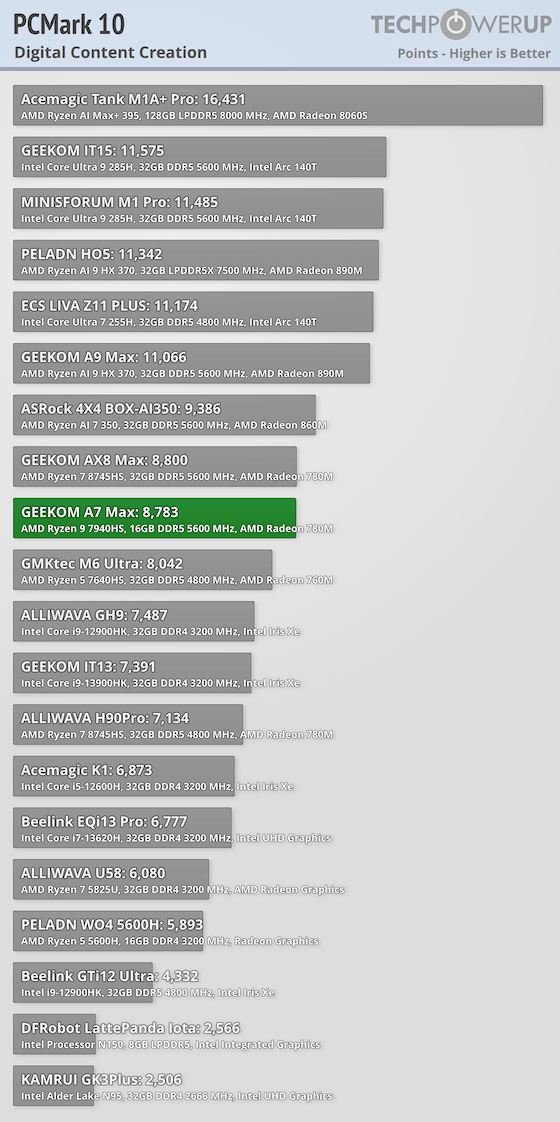
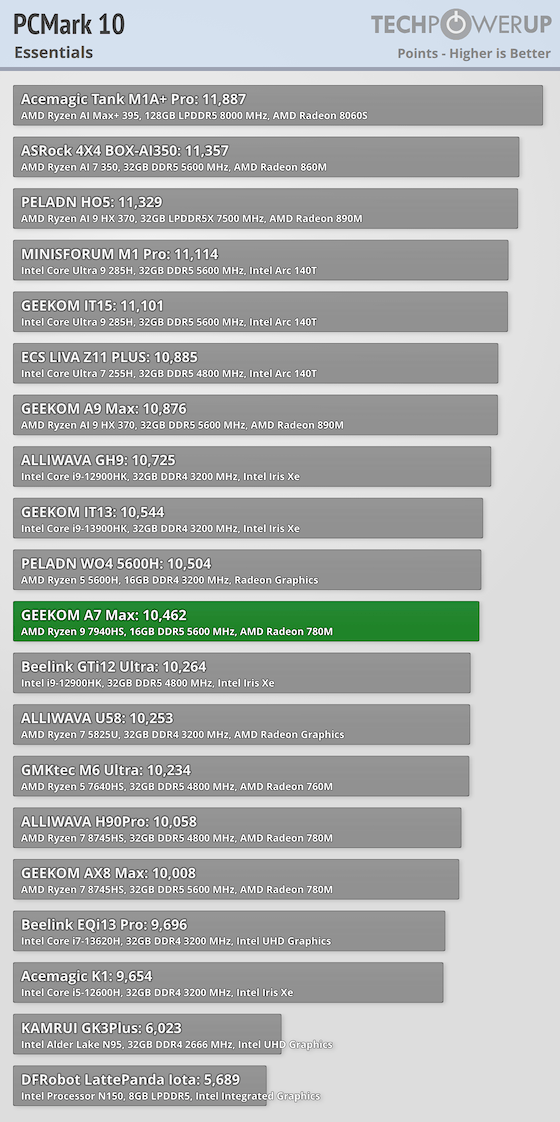
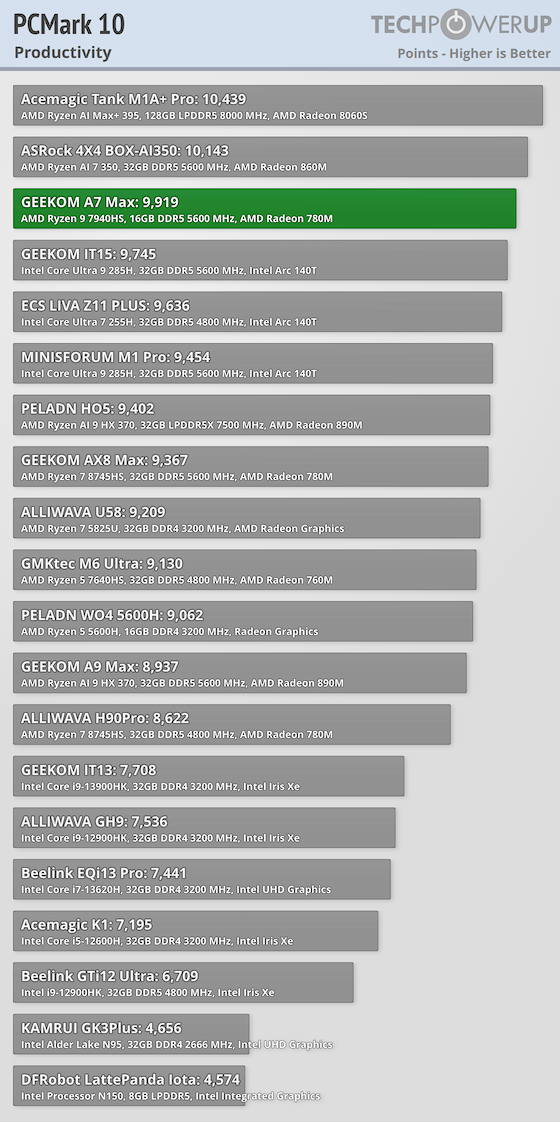
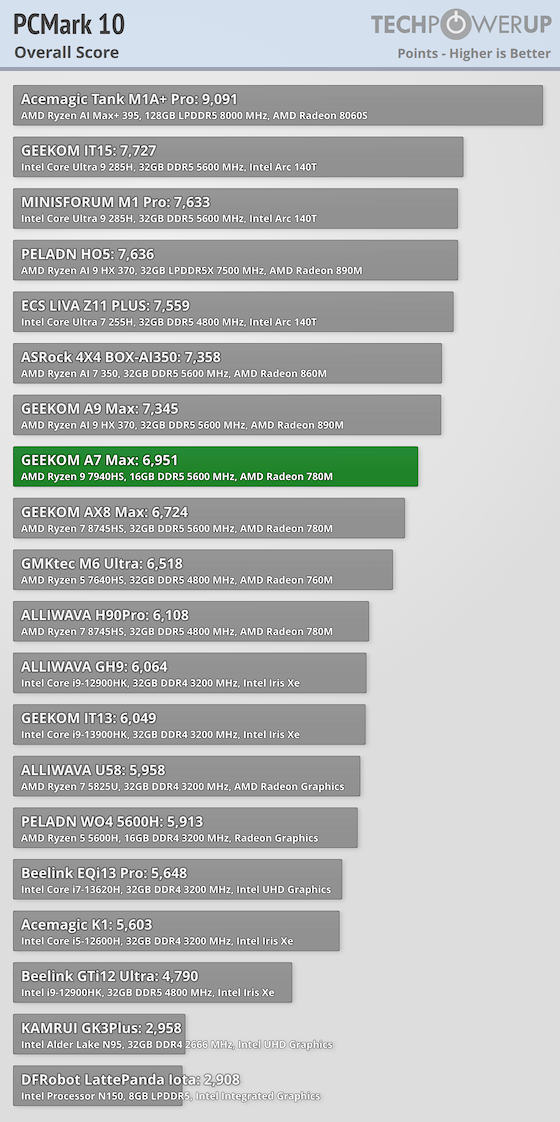
In PCMark 10, the A7 Max puts up 10,462 in Essentials, 9,919 in Productivity, 8,783 in Digital Content Creation, and 6,951 overall. That is a good everyday result, with Productivity being one of the stronger parts of the run.
Y-Cruncher
Y-Cruncher calculates digits of Pi with extreme precision, pushing both CPU and memory to their limits. It's useful for gauging raw compute ability and stability under heavy math workloads.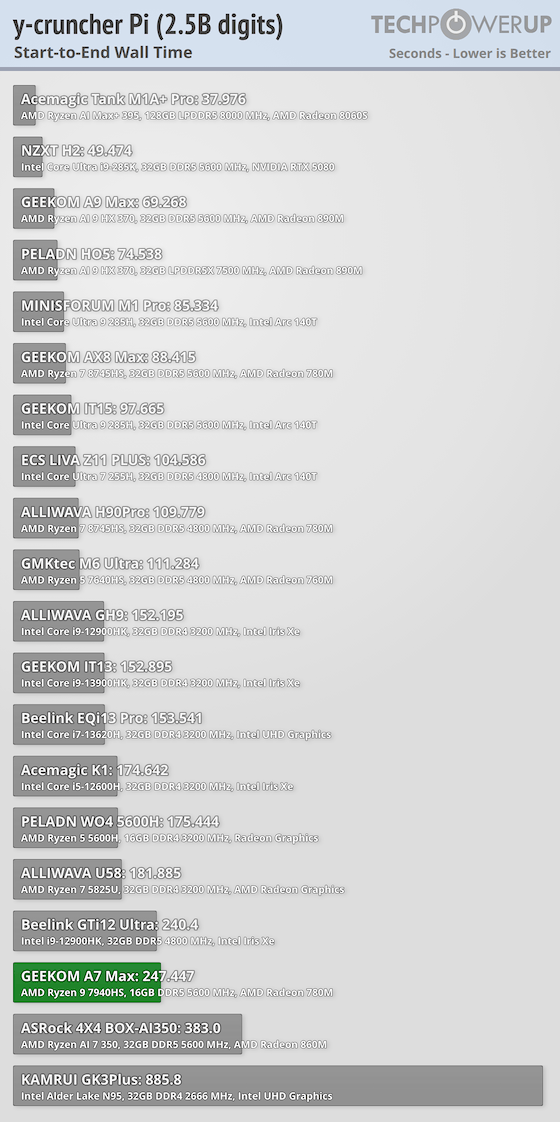
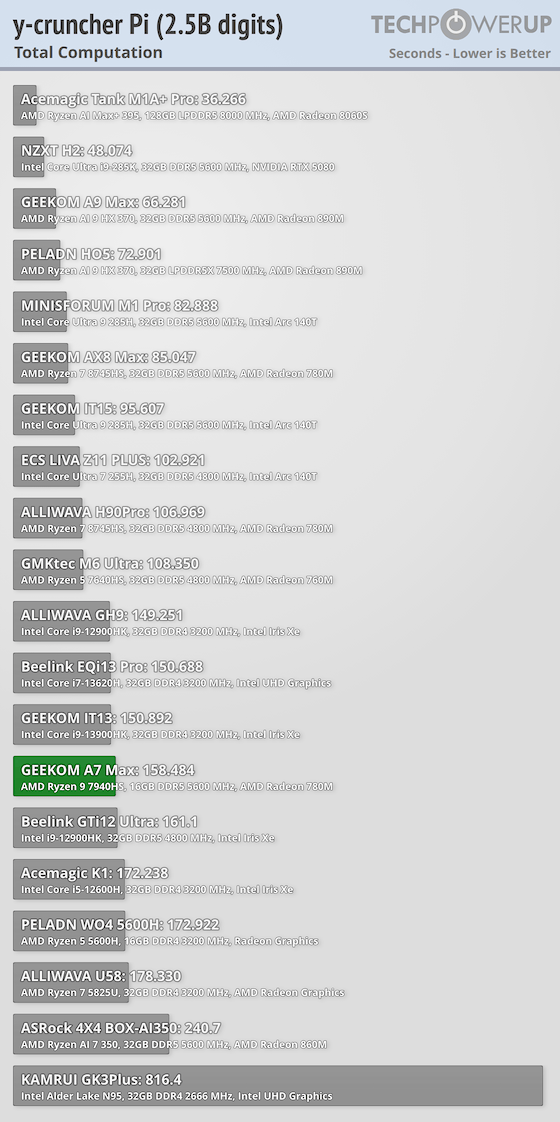
The A7 Max finishes the y-cruncher run in 158.484 seconds for Total Computation and 247.447 seconds for Start-to-End Wall Time. The computation time itself is decent, but the much longer wall time shows the system gave up a fair bit of time before or around the main run, likely in setup or memory work.
Geekbench
Geekbench tests a wide variety of workloads, from encryption and machine learning to office productivity and photo editing. It also includes GPU acceleration, giving a broader view of system capability.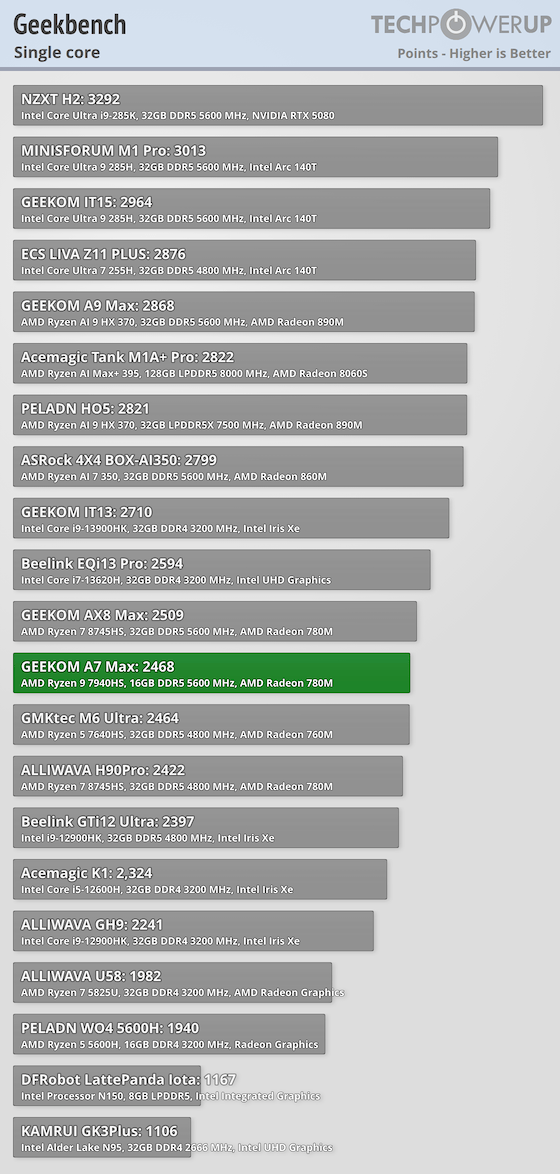
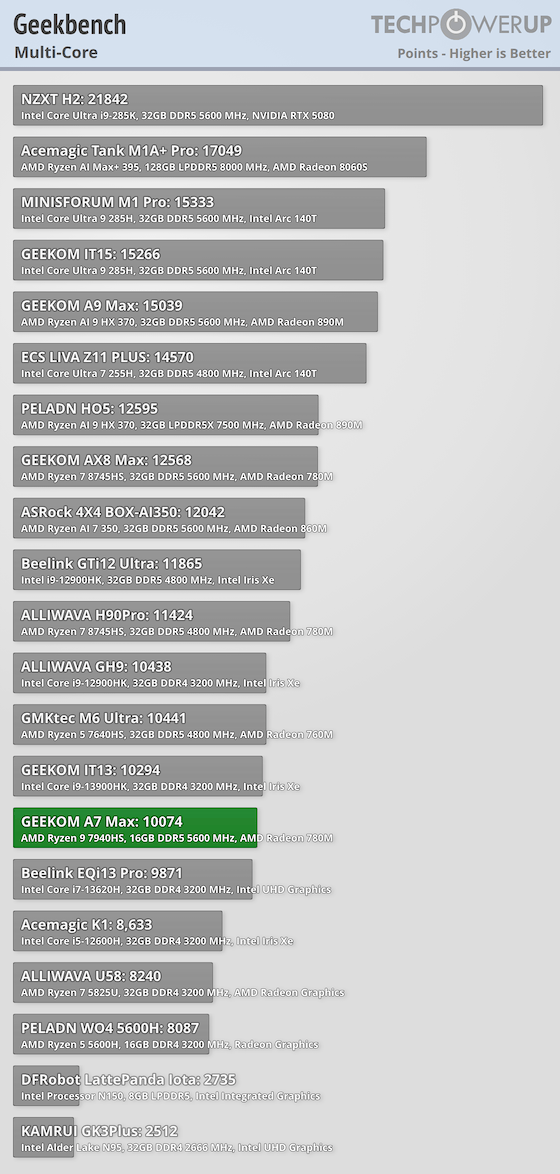
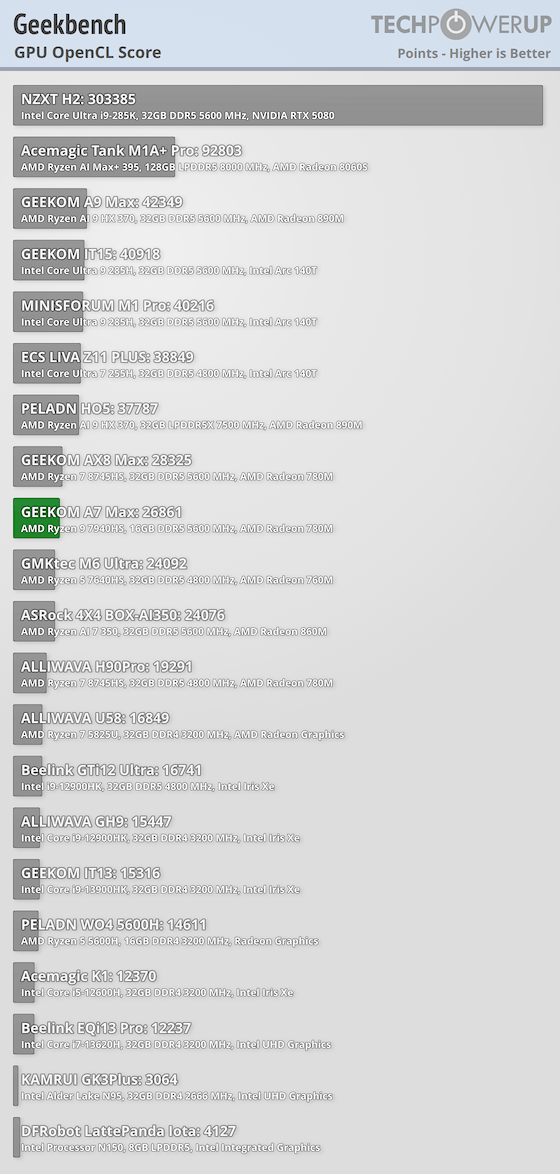
Geekbench shows 2,468 in Single Core, 10,074 in Multi-Core, and 26,861 in GPU OpenCL, which is a modest CPU result but decent showing from the Radeon 780M. The CPU scores are a bit lower than some of the stronger systems in this group, but the OpenCL result is better and helps the A7 Max in GPU-accelerated workloads.
Nov 20th, 2026 14:33 PST
change timezone
Latest GPU Drivers
New Forum Posts
- Logitech Headsets Modded Driver — Unlock Dolby in G HUB (23)
- 1 - 5 person file storage server equivalent accasible from anywhere + general VM server. (1)
- WarpCoreBench scores! (81)
- How to prevent OLED burn damage due to PC freezes or power outtages? (48)
- RX 9000 series GPU Owners Club (2247)
- Honestly, do you care about GTA VI? (208)
- When you could finally run Crysis maxed out? (63)
- GTA VI (20)
- Anthrophics IPO (25)
- GeekMagic Ultra Smart WiFi Weather Station (8)
Popular Reviews
- AMD Zen 6 Technical Deep Dive
- Microsoft Surface Laptop Ultra Review - The Next-gen Arm Laptop
- Ugreen NASync DXP4800 GT Review
- Corsair RM1200e (Second Generation) Review
- Acemagic Retro X3 Review
- Upcoming Hardware Launches 2027 (Updated Nov 2026)
- Pulsar Office Tour & First Look at P1 Dual-Sensor Mouse
- Biwin Black Opal NV7400 2 TB Review
- AMD Ryzen 7 9800X3D Memory Performance Scaling
- AMD Ryzen 7 9800X3D Review - The Best Gaming Processor
TPU on YouTube
Controversial News Posts
- NVIDIA Co-Founder and CEO Jensen Huang Officially Resigns (490)
- Report: Jensen Huang Eyes NVIDIA Comeback (256)
- Open Letter Asking NVIDIA to Reinstate Jensen Huang Passes 115,000 Signatures (184)
- OpenAI CEO Argues Home PCs Waste the World's Limited DRAM Supply (152)
- NVIDIA Launches Investigation Into Jensen Huang's Relationship With Suspected Chinese Spy (136)
- Intel "Raptor Lake Next" 16-Core and 20-Core CPUs Surface (130)
- Legendary Game Studio BioWare Shuts Down Following EA Layoffs (104)
- Dell CEO Says the Memory Shortage Will Get Worse in 2027 (95)