 23
HP FX700 2 TB Review - Chinese QLC is Working Well
(23 Comments) »Introduction

HP, aka Hewlett Packard, is one of the most well-known tech companies in the world. They produce nearly every product you can think of: laptops, desktops, printers, enterprise hardware, and solid-state drives.
For their SSD storage products, HP teamed up with BIWIN Storage, a large Chinese OEM for SSD solutions with 25 years of experience in the storage and microelectronics business. BIWIN were granted authorization from HP to produce SSDs in their name.

The HP FX700 is the first solid-state-drive we have tested that's built using QLC NAND flash from YMTC, in the new 232-layer variant, which is an impressive technological feat, because China's flash memory manufacturing has caught up with Micron and Hynix. For the controller the Maxiotech MAP1602 is used—we've seen it on several highly affordable drives recently. As expected, a DRAM cache chip is not included, just like on other MAP1602 drives, to reach the targeted price point.
The HP FX700 is available in capacities of 512 GB ($45), 1 TB ($68), 2 TB ($100) and 4 TB ($200). Endurance for these models is set to 200 TBW, 400 TBW, 800 TBW and 1600 TBW, respectively. HP includes a five-year warranty with the FX700.
| Specifications: HP FX700 2 TB SSD | |
|---|---|
| Brand: | HP |
| Model: | 8U2N5AA#UUF |
| Capacity: | 2048 GB (1907 GB usable) No additional overprovisioning |
| Controller: | Maxiotech MAP1602A |
| Flash: | YMTC 232-Layer 3D QLC BWN0AQF1B1HCAD |
| DRAM: | N/A, but 40 MB Host-Memory-Buffer (HMB) |
| Endurance: | 800 TBW |
| Form Factor: | M.2 2280 |
| Interface: | PCIe Gen 4 x4, NVMe 2.0 |
| Device ID: | HP SSD FX700 2TB |
| Firmware: | SN14428 |
| Warranty: | Five years |
| Price at Time of Review: | $100 / $49 per TB |
Packaging


The Drive


The drive is designed for the M.2 2280 form factor, which makes it 22 mm wide and 80 mm long.

PCI-Express 4.0 x4 is used as the host interface to the rest of the system, which doubles the theoretical bandwidth compared to PCIe 3.0 x4.


On the PCB you'll find the SSD controller and four flash chips. A DRAM cache is not available.

HP includes a preinstalled heat spreader foil with the SSD. We've seen this on other SSDs, too, but here the metal foil is rather thin. The are also marketing the grayish substance as "graphene," looks like graphite to me. Still, as our thermal testing shows, this level of cooling is sufficient for everything, including the worst possible scenarios.
Chip Component Analysis

MaxioTech's MAP1602A controller is produced on TSMC's 12 nanometer node and uses several Arm Cortex R5 CPU cores.

The four flash chips are YMTC 232-layer 3D QLC NAND.
Test Setup
| Test System SSD 2023 | |
|---|---|
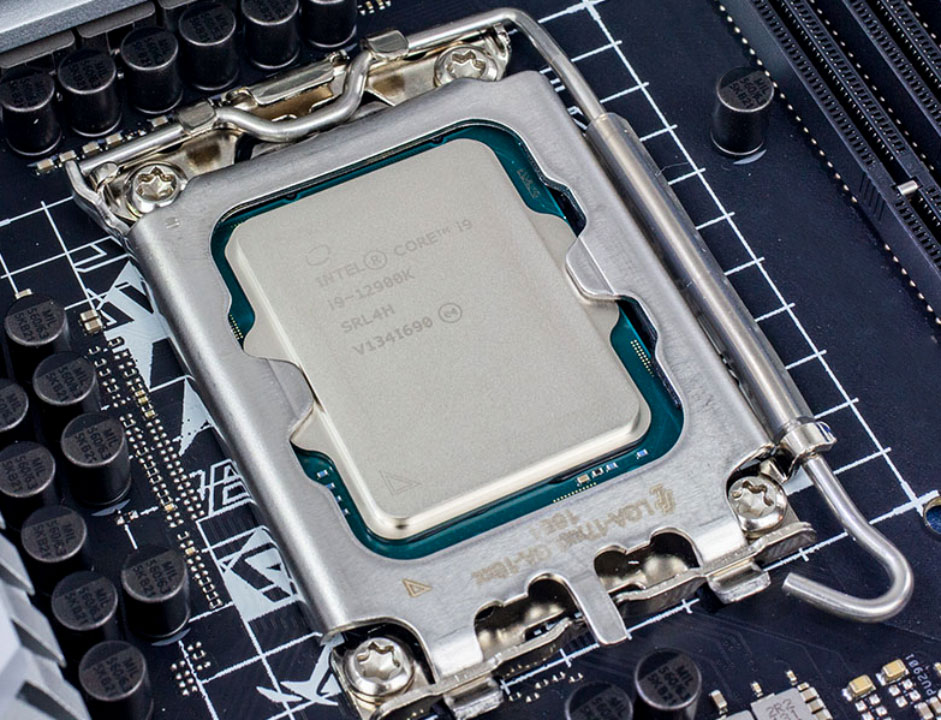
| Processor: | Intel Core i9-12900K Alder Lake 5.2 GHz, 8+8 cores / 24 threads |
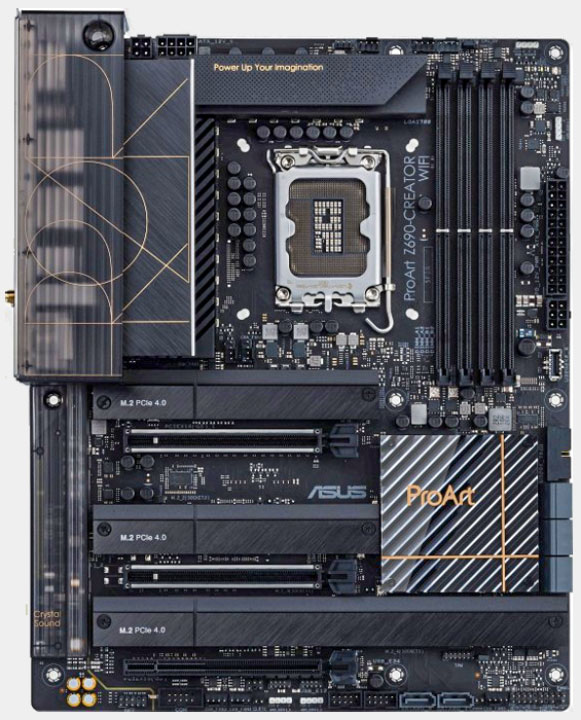
| Motherboard: | ASUS ProArt Z690-Creator WIFI BIOS 2204 |
| Memory: | 2x 16 GB DDR5-6000 |
| Graphics: | PNY GeForce RTX 4070 Ti OC |
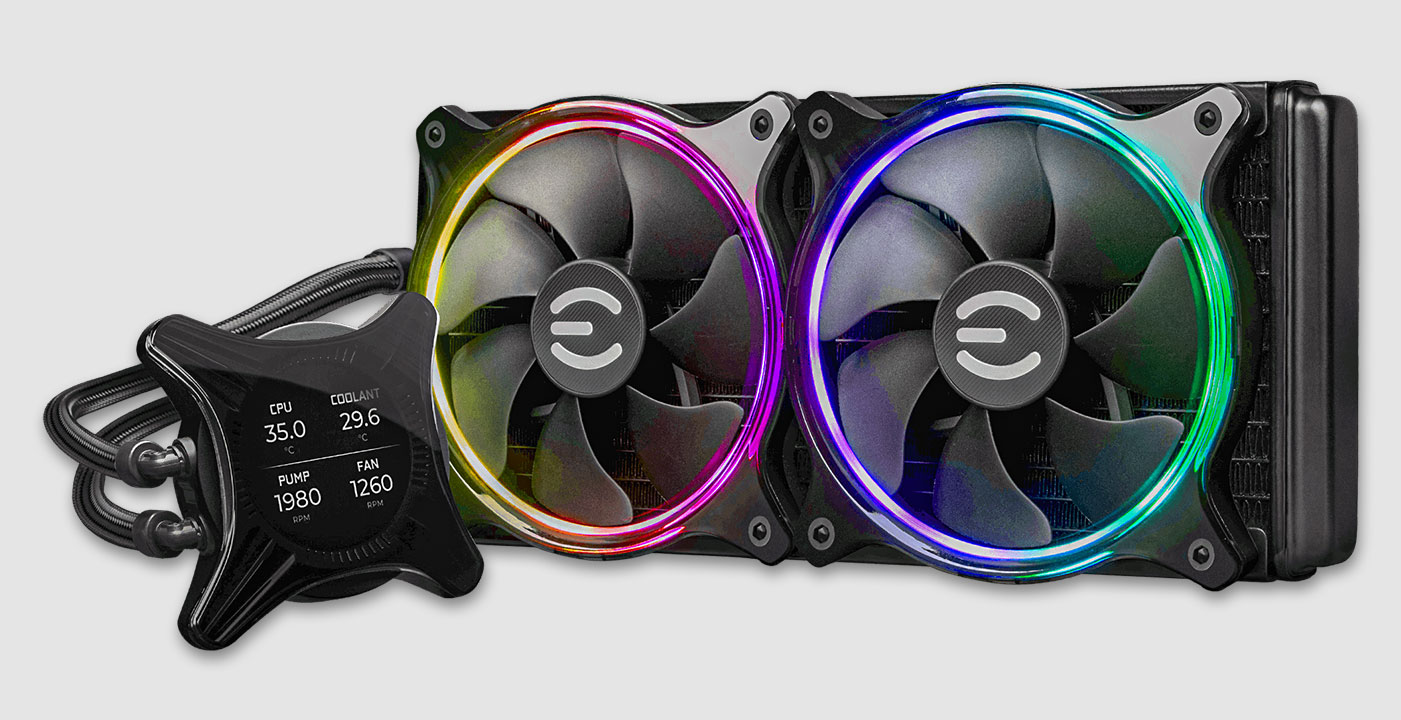
| Cooling: | EVGA CLCx 280 mm AIO |
| Thermal Paste: | Arctic MX-6 |
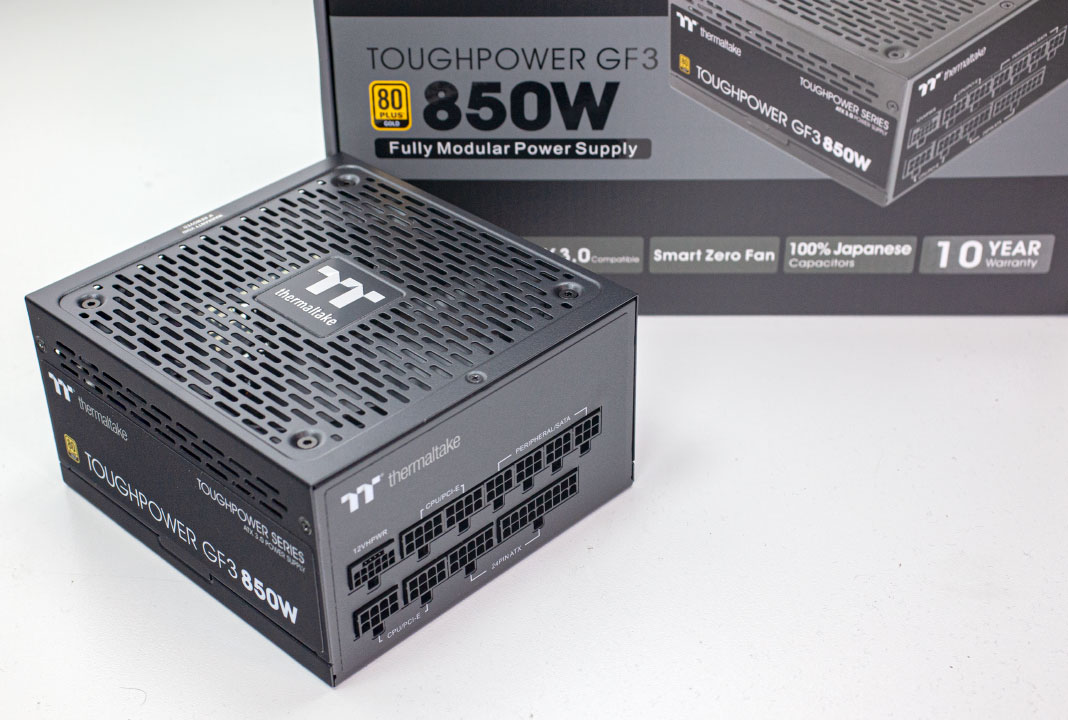
| Power Supply: | Thermaltake Toughpower GF3 850 W ATX 3.0 / 16-pin 12VHPWR |
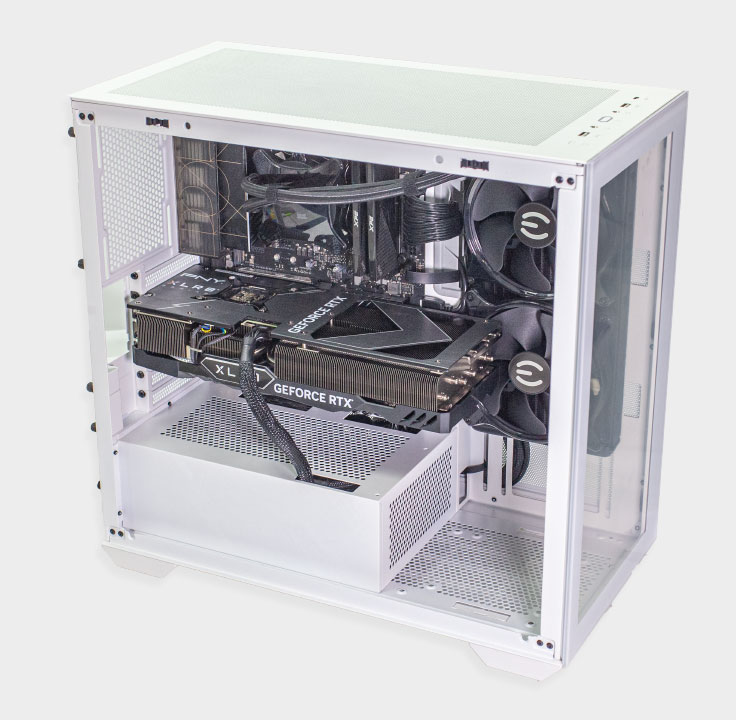
| Case: | darkFlash DLX4000 |
| Operating System: | Windows 11 Professional 64-bit 22H2 VBS enabled (Windows 11 default) |
| Drivers: | NVIDIA: 528.02 WHQL |

Synthetic Testing
- Tests are run with a 20-second-long warm-up time (result recording starts at second 21).
- Between each test, the drive is left idle for 60 seconds, to allow it to flush and reorganize its internal data.
- All write requests contain random, incompressible data.
- Disk cache is flushed between all tests.
- M.2 drives are tested with a fan blowing on them; that is, except for the results investigating uncooled behavior on the thermal testing page.
Real-life Testing
- After initial configuration and installation, a disk image is created; it is used to test every drive.
- Automated updates are disabled for the OS and all programs. This ensures that—for every review—each drive uses the same settings, without interference from previous testing.
- Our disk image consumes around 600 GB—partitions are resized to fill all available space on the drive.
- All drives are filled with random data to 80% of their capacity
- Partitions are properly aligned.
- Disk cache is flushed between all tests.
- In order to minimize random variation, each real-life performance test is run several times, with reboots between tests to minimize the impact of disk cache.
- All application benchmarks run the actual application and do not replay any disk traces.
- Our real-life testing data includes performance numbers for a typical high-performance HDD, using results from a Western Digital WD Black 1 TB 7200 RPM 3.5" SATA. HDDs are significantly slower than SSDs, which is why we're not putting the result in the chart, as that would break the scaling, making the SSDs indistinguishable in comparison. Instead, we've added the HDD performance numbers in the title of each test entry.
Our Patreon Silver Supporters can read articles in single-page format.
Nov 14th, 2026 11:53 CST
change timezone
Latest GPU Drivers
New Forum Posts
- Slow SSD read speeds - help! (6)
- What can the FX 8320 do today? Here is the answer. (27)
- What card do I get for VR? (29)
- Tell me about your favourite graphics card (55)
- Ddr4 instead of ddr5 for 9060xt 8 gb over 5060 8 gb (7)
- Your PC ATM (36414)
- TPU's Nostalgic Hardware Club (22161)
- Microsoft Exchange/365 outages? (62)
- Opinion on Monitor Replacement (7)
- Show us your collections thread!! (366)
Popular Reviews
- AMD Zen 6 Technical Deep Dive
- Corsair HX1000i Shift Crystal Review
- ASUS ROG Strix B850-I Gaming Wi-Fi7 W Review
- NZXT C1200 Platinum Review
- Upcoming Hardware Launches 2027 (Updated Nov 2026)
- Montech King 95 3D PRO Review
- NZXT H7 RGB+ Review
- NZXT H5 Review
- Phantom Blade Zero Performance Benchmark Review - 35 GPUs Tested
- XPG NIMBUS PLUS Review - Mid-range Chair With Strong Competitors
TPU on YouTube
Controversial News Posts
- NVIDIA Co-Founder and CEO Jensen Huang Officially Resigns (399)
- OpenAI CEO Argues Home PCs Waste the World's Limited DRAM Supply (152)
- NVIDIA Launches Investigation Into Jensen Huang's Relationship With Suspected Chinese Spy (136)
- Intel "Raptor Lake Next" 16-Core and 20-Core CPUs Surface (130)
- Legendary Game Studio BioWare Shuts Down Following EA Layoffs (104)
- Dell CEO Says the Memory Shortage Will Get Worse in 2027 (95)
- NVIDIA GeForce RTX 50-Series Scheduled for up to $500 Price Hike This Week (89)
- Modder Fits RTX 5090 With Four 8-Pin Connectors, Halving Current per Wire (80)