 11
MSI MEG Maestro 900R Review
Gaming Stress Test »Thermal Stress Test
| Thermal Test Components | |
|---|---|
| Processor: | AMD Ryzen 5-9600X Zen 5 5.4 GHz, 6 cores/12 threads |
| Motherboard: | ASUS ROG Strix B850-I Gaming Wi-Fi Socket AM5 |
| Memory: | 32 GB (2× 16 GB) ADATA XPG ARMAX DDR5 6000 MT/s |
| Graphics: | AMD Radeon RX 7600 |
| Cooling: | Noctua NH-L9x65 Low-Profile CPU Cooler |
| Thermal Paste: | Arctic MX-7 |
| Power Supply: | FSP Dagger PM SFX 1000 W |
| Fan Hub: | Cuifati 10-port fan and lighting hub |
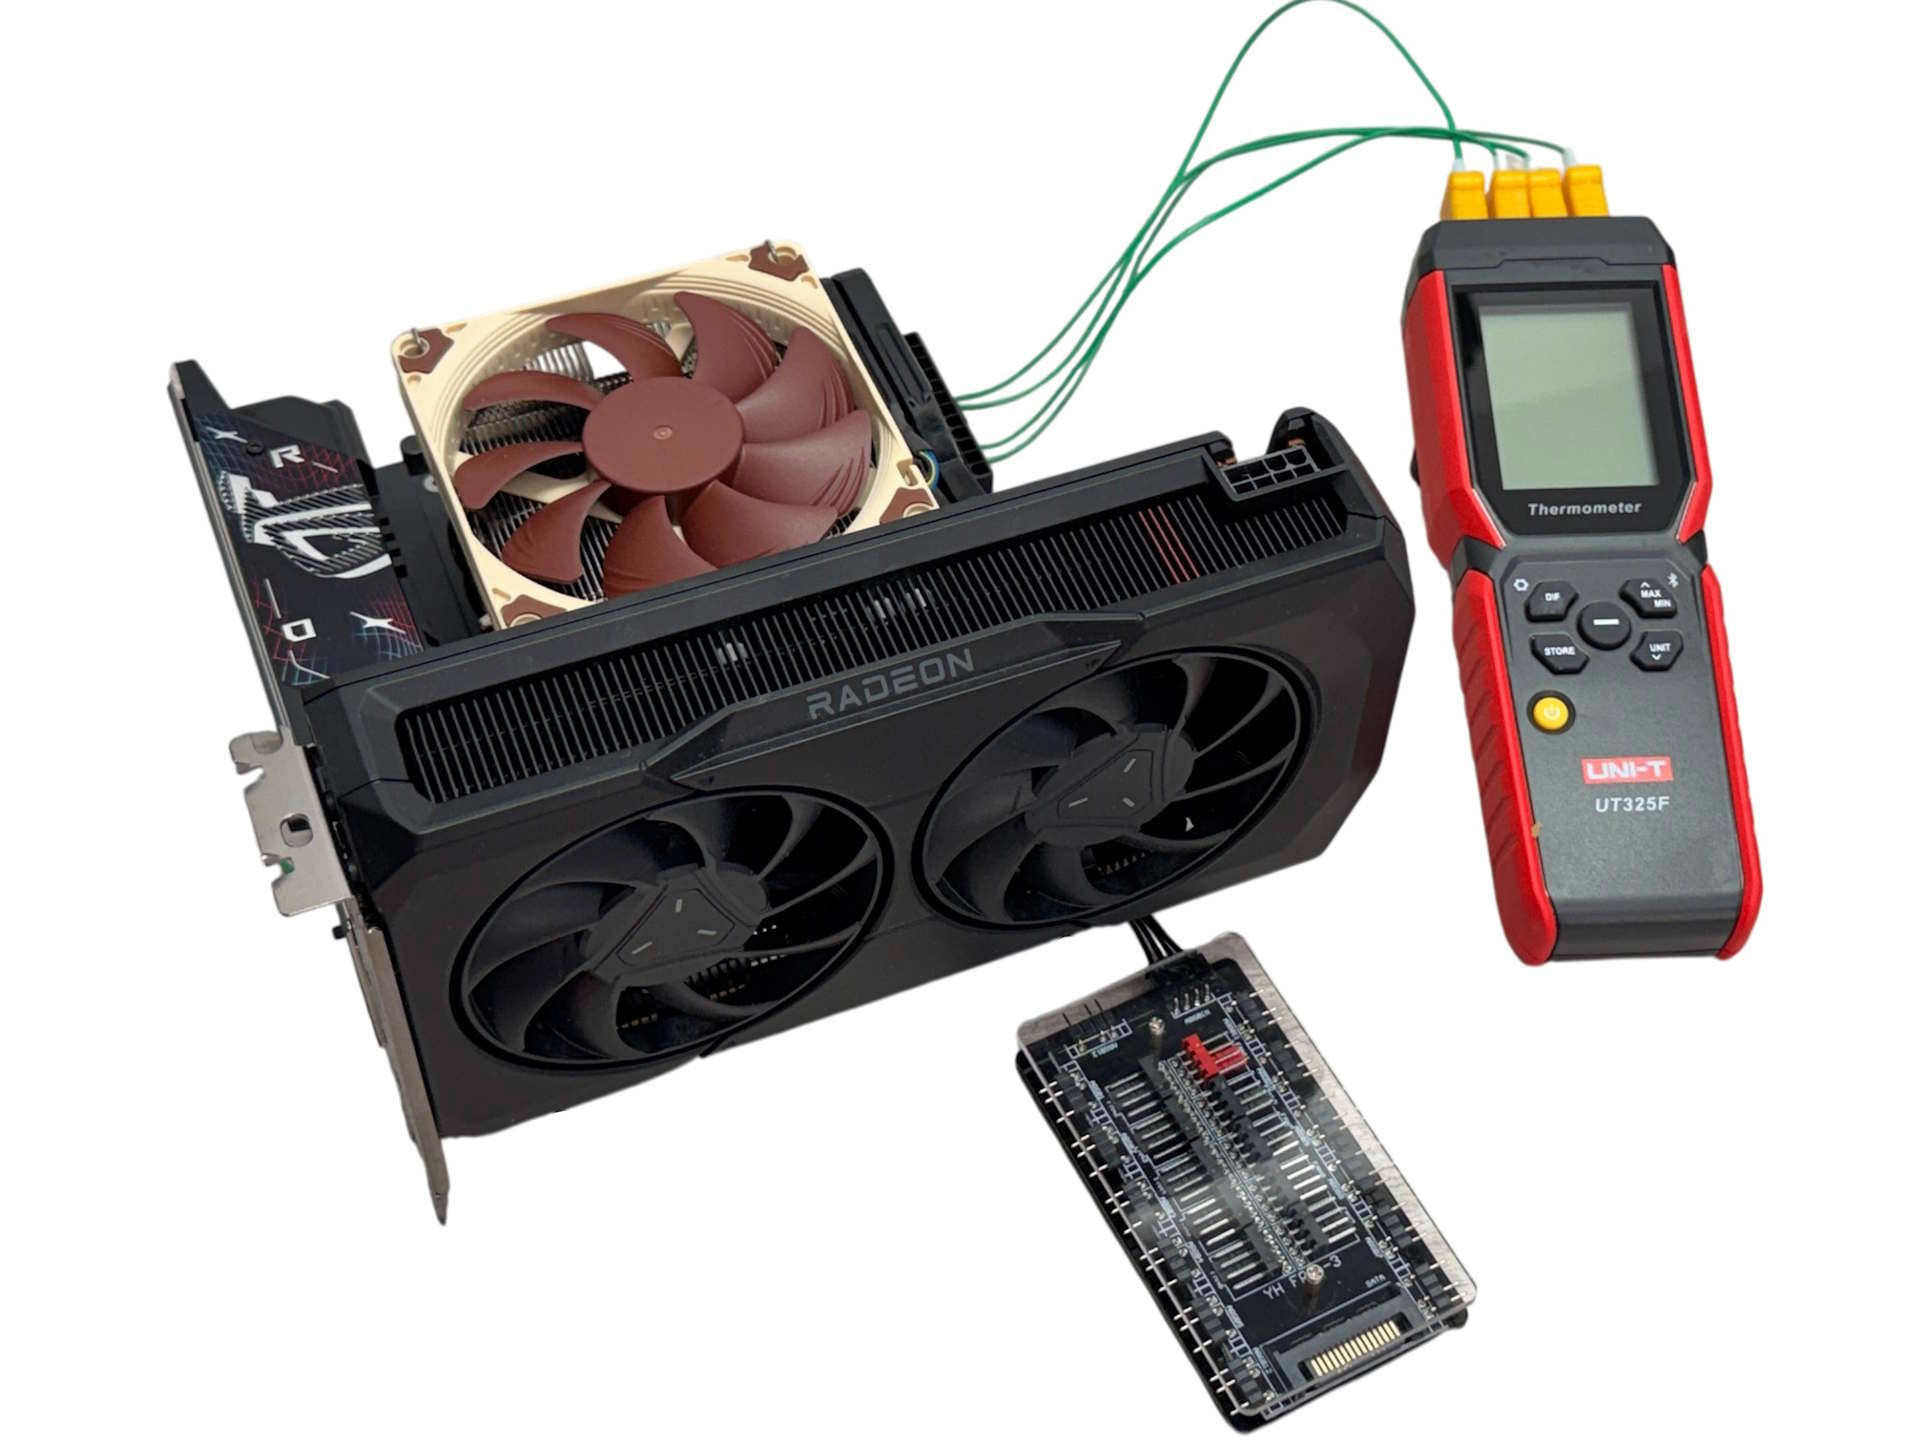
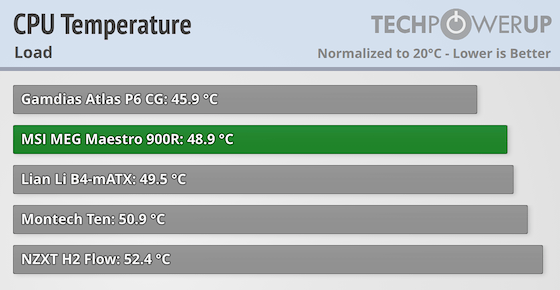
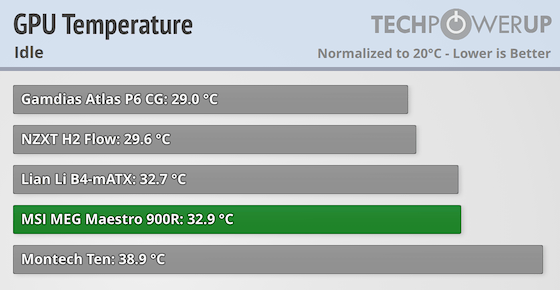
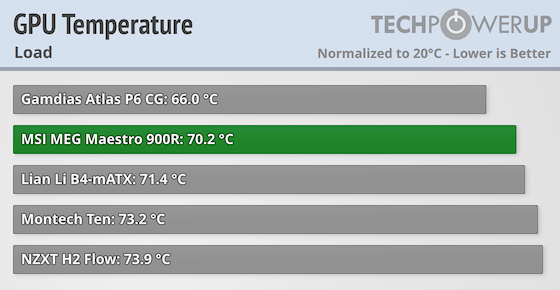
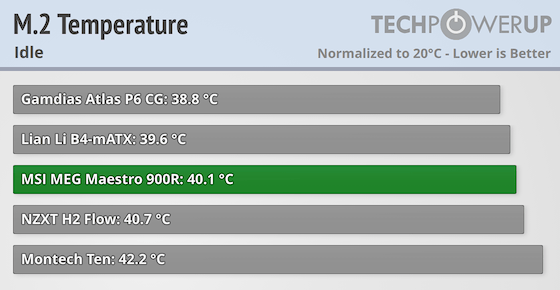
We have just updated our test gear so for the moment we have very few comparison results. However, we will be adding to these graphs over the next few weeks. Our test setup focuses on four components small enough to fit into every chassis format. This allows us to compare the impact that case size and cooling has on a modern system. Each of the four measured components is connected to a UNI-T UT325F Data Logging Thermometer with K-type sensors that have been placed as close as possible to the benchmarked areas of the CPU, GPU, M.2 SSD, and motherboard chipset. A fifth sensor is used to monitor the room temperature for an accurate delta-T result. While the data provides us with an accuracy of one decimal point, it is still dependent on human placement of the sensor as well as small variances in things like automatic disk activity in Windows, for example. The system is air-gapped, so that no automatic software updates can trigger an unwanted workload on any of the components.
For the cases, the out-of-the-box fan setup is used, connected to the motherboard, with the board adjusting fan speeds automatically. This puts the onus of noise and performance on the case manufacturers and motivates them to actually care about thermal performance instead of simply using active cooling as a marketing bullet point.
On the software side, the test setup includes Windows 11 Pro with Furmark and Cinebench R24's multithread test, both running at the same time to put the maximum load on both the processor and the graphics card.
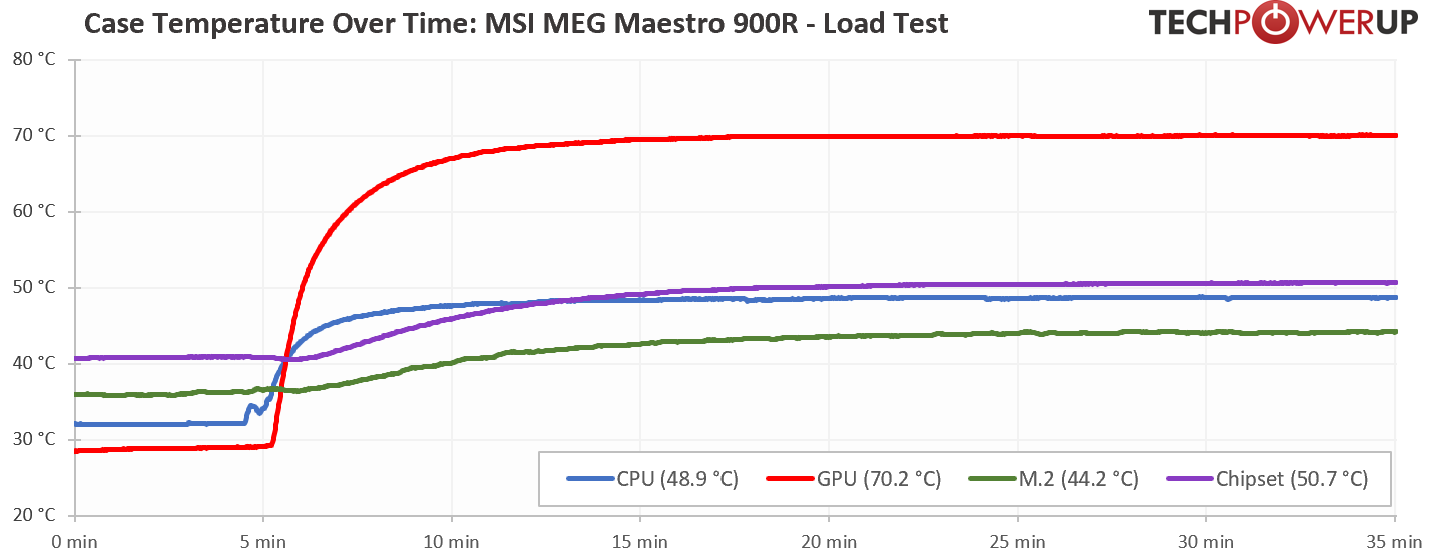
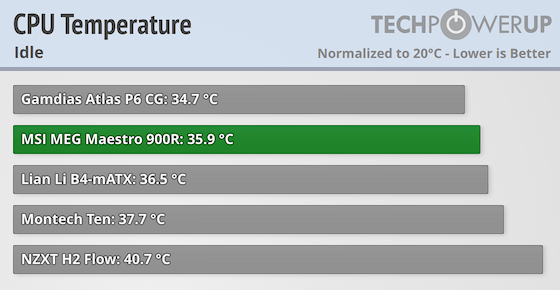
We let the chassis sit at idle until temperatures reach equilibrium, but never for less than 30 minutes. Next, our stress-testing load is started, and it continues to run until temperatures are stable. The temperature result for each section of the case is the highest value measured during the test run. All reported temperatures are normalized to 20°C room temperature.
Comparison
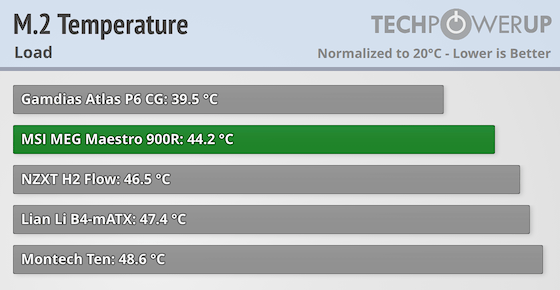
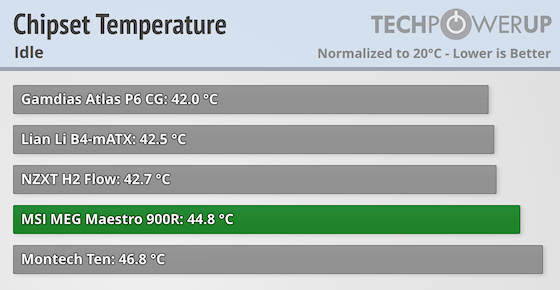
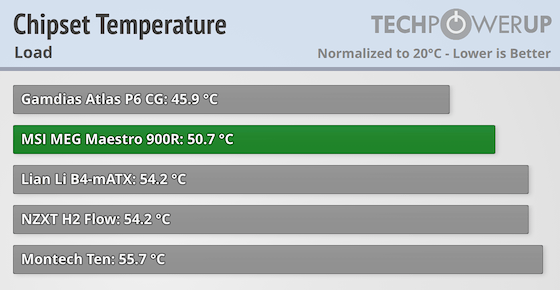
Nov 14th, 2026 20:11 CST
change timezone
Latest GPU Drivers
New Forum Posts
- [Intel AX1xx/AX2xx/AX4xx/AX16xx/BE2xx/BE17xx] Intel Modded Wi-Fi Driver with Intel® Killer™ Features (632)
- Optical Disc Drive owners club (208)
- Planning for Prolonged High Prices and Maintaining What You Already Have (67)
- Game Soundtracks You Love (1287)
- WarpCoreBench scores! (35)
- Tell me about your favourite graphics card (80)
- 9070 GRE 3.9ghz validation reached. (11)
- Honestly, do you care about GTA VI? (20)
- AI generated images... (226)
- What is in your fleet, size and contents? (28)
Popular Reviews
- AMD Zen 6 Technical Deep Dive
- ASUS ROG Strix B850-I Gaming Wi-Fi7 W Review
- Corsair HX1000i Shift Crystal Review
- Upcoming Hardware Launches 2027 (Updated Nov 2026)
- Montech King 95 3D PRO Review
- NZXT C1200 Platinum Review
- NZXT H7 RGB+ Review
- NZXT H5 Review
- Phantom Blade Zero Performance Benchmark Review - 35 GPUs Tested
- AMD Ryzen 7 9800X3D Review - The Best Gaming Processor
TPU on YouTube
Controversial News Posts
- NVIDIA Co-Founder and CEO Jensen Huang Officially Resigns (406)
- OpenAI CEO Argues Home PCs Waste the World's Limited DRAM Supply (152)
- NVIDIA Launches Investigation Into Jensen Huang's Relationship With Suspected Chinese Spy (136)
- Intel "Raptor Lake Next" 16-Core and 20-Core CPUs Surface (130)
- Legendary Game Studio BioWare Shuts Down Following EA Layoffs (104)
- Dell CEO Says the Memory Shortage Will Get Worse in 2027 (95)
- NVIDIA GeForce RTX 50-Series Scheduled for up to $500 Price Hike This Week (89)
- Modder Fits RTX 5090 With Four 8-Pin Connectors, Halving Current per Wire (80)