 45
Thermal Grizzly WireView Pro Review
Performance Testing »Screen Modes
The WireView comes with several screens. By default, it will start to the power screen and slowly cycle through the other ones, this can be configured in settings. You can manually cycle through the screens by pressing the button.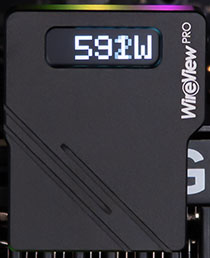
On the first screen you see the current power draw as a big number that's easy to read from quite a distance.
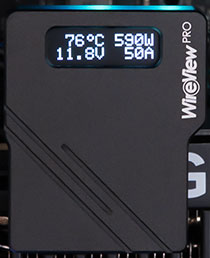
The next screen has more details, showing current temperature, voltage, power draw and current.
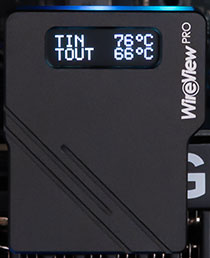
Next, we can see the temperatures of two internal sensors on the PCB of the WireView, close to the 16-pin in and out connectors.
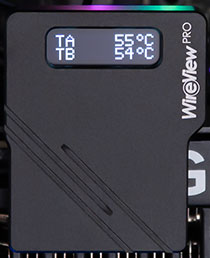
On the next screen we can see the temperatures of the thermal probes. If they aren't attached they'll show "N/A" while the unit continues to work normally.
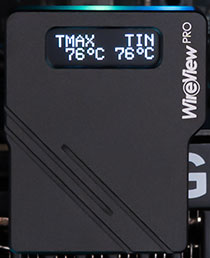
Moving on, there's a screen that shows the maximum temperature ever measured on the sensors (since the unit was powered up).
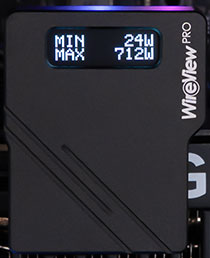
The power stats screen shows the min and max power values.
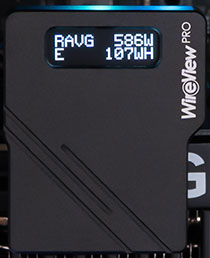
RAVG is the average of all the power measurements and "E" is the total energy consumed in watt-hours—use this to calculate cost. i.e. divide by 1000 to get kWh and then multiply by your power price, like $0.30 per kWh. In my case: 107 Wh = 0.107 kWh x €0.35 per kWh = €0.03745 = 3.7 Euro cents.
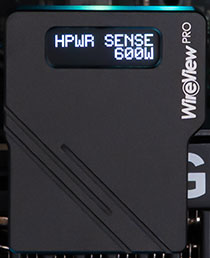
The final screen shows the status of the sense wire configuration on your 16-pin cable. Besides the 16 power wires, there are four more thin wires in the cable that let the PSU signal to the graphics card how powerful it is. Usually you will always see "600" here.
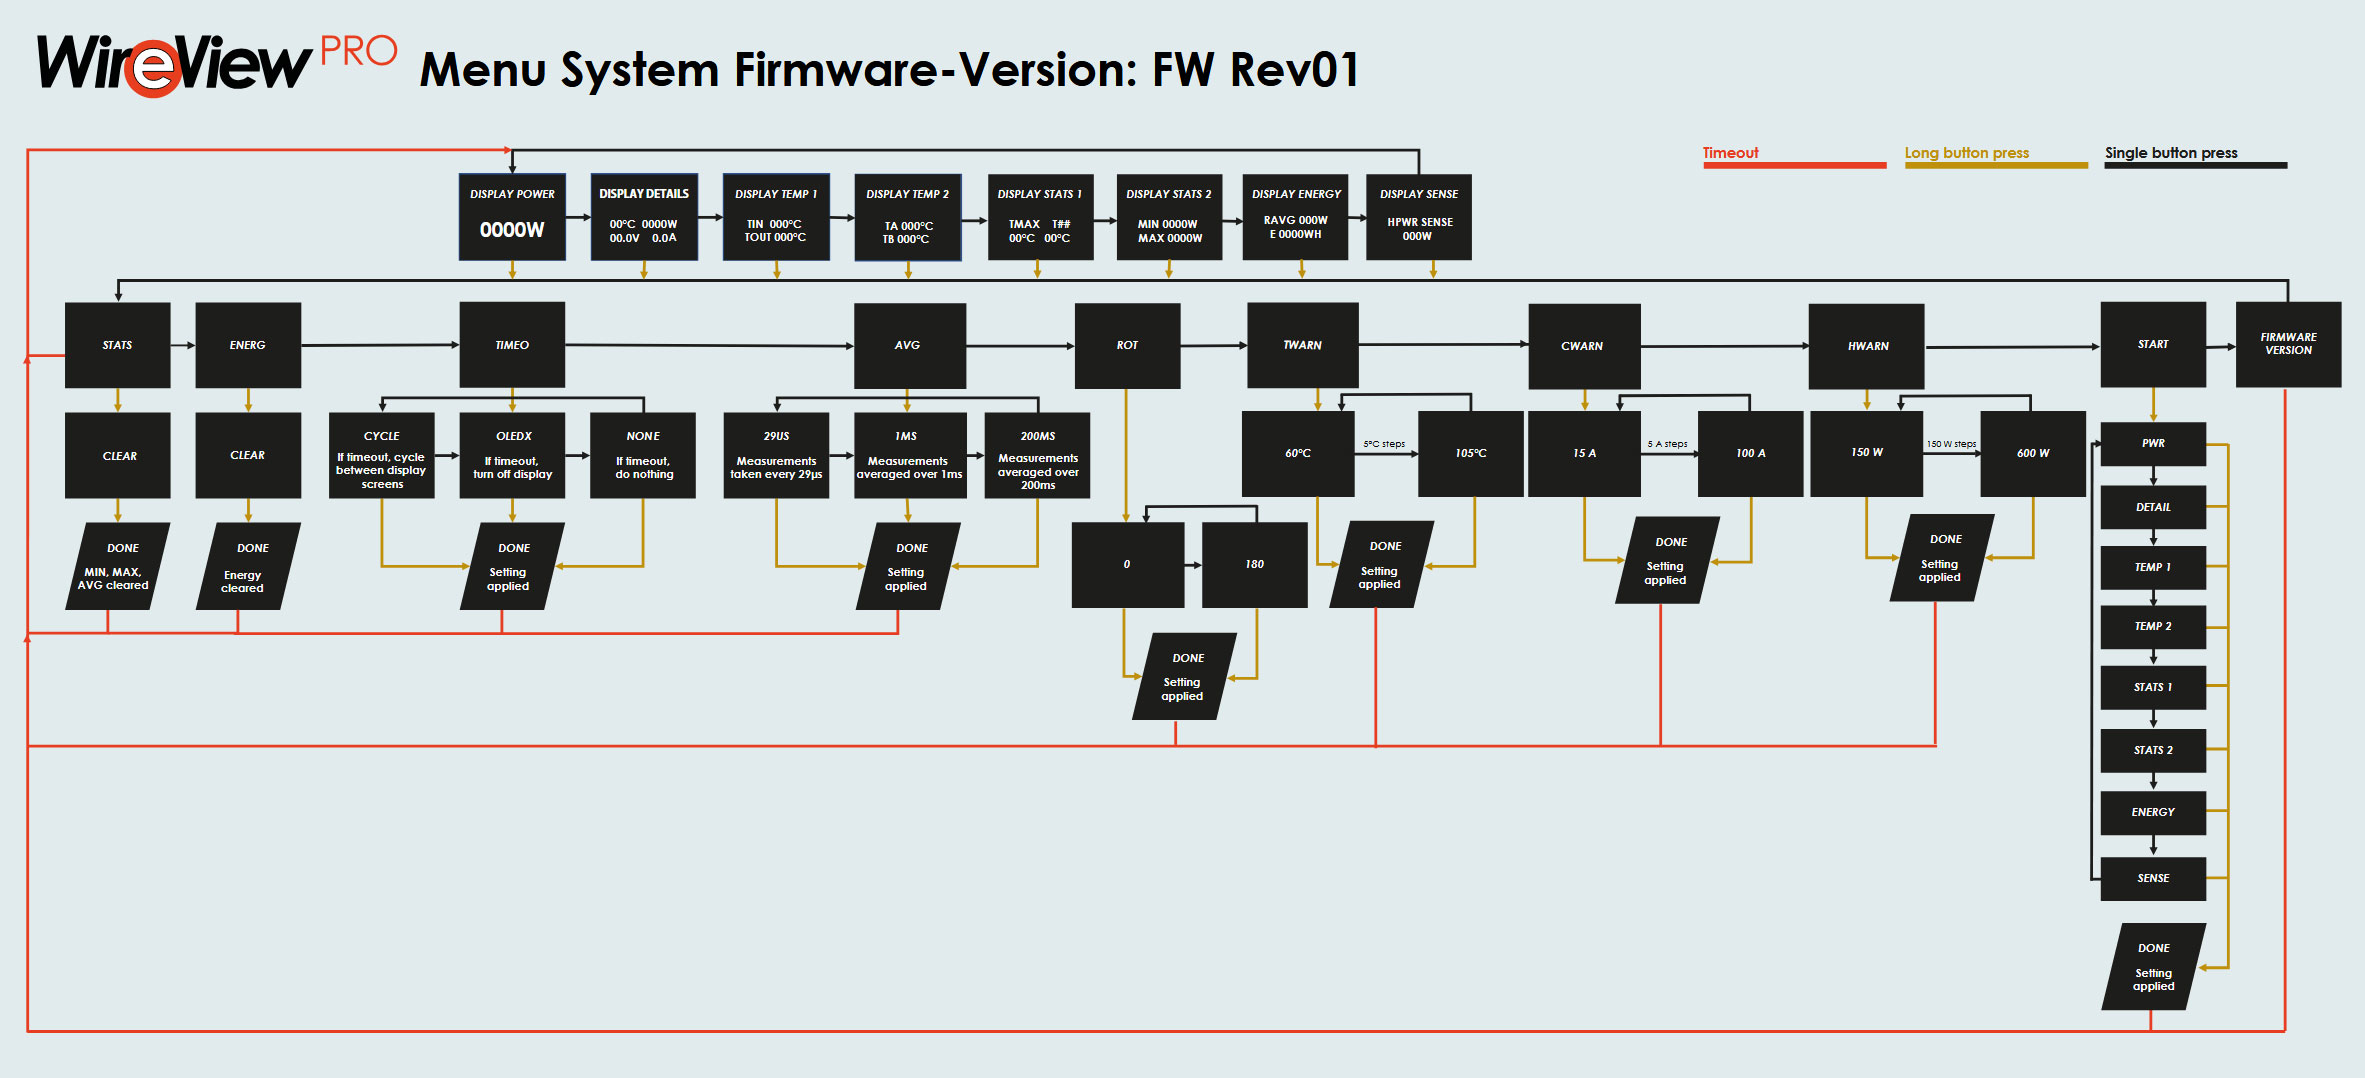
Here's the map of all the menu options, including the settings, which can be activated by long-pressing the button.
Nov 21st, 2026 06:58 PST
change timezone
Latest GPU Drivers
New Forum Posts
- What's your latest tech Freebie? (87)
- UPS what one to get? (3)
- Differences i might've missed between these ultrawides to decide which to buy during BF. (0)
- Honestly, do you care about GTA VI? (220)
- Anthrophics IPO (31)
- Without Jensen, PC gaming will be (53)
- WarpCoreBench scores! (88)
- TPU's Nostalgic Hardware Club (22179)
- [Poll] 12V-2x6 Connector Protection: What Are You Using? (WireView / Ampinel / Equalizer / Other / Nothing) (50)
- Windows 11 General Discussion (7743)
Popular Reviews
- Microsoft Surface Laptop Ultra Review - The Next-gen Arm Laptop
- Ugreen NASync DXP4800 GT Review
- Corsair RM1200e (Second Generation) Review
- Pulsar Office Tour & First Look at P1 Dual-Sensor Mouse
- Upcoming Hardware Launches 2027 (Updated Nov 2026)
- Acemagic Retro X3 Review
- Biwin Black Opal NV7400 2 TB Review
- AMD Ryzen 7 9800X3D Review - The Best Gaming Processor
- AMD Zen 6 Technical Deep Dive
- Chieftec Iceberg PRO 360 DARK Review
TPU on YouTube
Controversial News Posts
- NVIDIA Co-Founder and CEO Jensen Huang Officially Resigns (491)
- Report: Jensen Huang Eyes NVIDIA Comeback (258)
- Open Letter Asking NVIDIA to Reinstate Jensen Huang Passes 115,000 Signatures (184)
- OpenAI CEO Argues Home PCs Waste the World's Limited DRAM Supply (152)
- NVIDIA Launches Investigation Into Jensen Huang's Relationship With Suspected Chinese Spy (136)
- Intel "Raptor Lake Next" 16-Core and 20-Core CPUs Surface (130)
- Legendary Game Studio BioWare Shuts Down Following EA Layoffs (104)
- NVIDIA GeForce RTX 50-Series Scheduled for up to $500 Price Hike This Week (89)