 10
10
Thermaltake Toughpower DPS G 1050 W Review
Efficiency, Temperatures & Noise »Test Setup

All measurements were performed using two Chroma 6314A mainframes equipped with the following electronic loads: six 63123A [350 W each], one 63102A [100 W x2], and one 63101A [200 W]. The aforementioned equipment can deliver 2500 W of load, and all loads are controlled by a custom-made software. We also used a Rigol DS2072A oscilloscope kindly sponsored by Batronix, a Picoscope 3424 oscilloscope, a Picotech TC-08 thermocouple data logger, two Fluke multimeters (models 289 and 175), and a Yokogawa WT210 power meter. We also included a wooden box, which, along with some heating elements, was used as a hot box. Finally, we had at our disposal three more oscilloscopes (Rigol VS5042, Stingray DS1M12, and a second Picoscope 3424), and a Class 1 Bruel & kjaer 2250-L G4 Sound Analyzer which is equipped with a type 4189 microphone that features a 16.6-140 dBA-weighted dynamic range. You will find more details about our equipment and the review methodology we follow in this article. We also conduct all of our tests at 40°C-45°C ambient to simulate the environment seen inside a typical system with a higher accuracy, with 40°C-45°C being derived from a standard ambient assumption of 23°C and 17°C-22°C being added for the typical temperature rise within a system.
Rigol DS2072A kindly provided by: |
 |
Primary Rails Load Regulation
The following charts show the voltage values of the main rails, recorded over a range from 60 W to the maximum specified load, and the deviation (in percent) for the same load range.


5VSB Regulation
The following chart shows how the 5VSB rail deals with the load we throw at it.

Hold-up Time
Hold-up time is a very important PSU characteristic and represents the amount of time, usually measured in milliseconds, a PSU can maintain output regulations as defined by the ATX spec without input power. In other words, it is the amount of time the system can continue to run without shutting down or rebooting during a power interruption. The ATX specification sets the minimum hold-up time to 16 ms with the maximum continuous output load. In the following screenshot, the blue line is the mains signal and the yellow line is the "Power Good" signal. The latter is de-asserted to a low state when any of the +12V, 5V, or 3.3V output voltages fall below the undervoltage threshold, or after the mains power has been removed for a sufficiently long time to guarantee that the PSU cannot operate anymore.

The hold-up time was way lower than the allowed minimum, so the unit registered a major fail in this test.
Inrush Current
Inrush current, or switch-on surge, refers to the maximum, instantaneous input-current drawn by an electrical device when it is first turned on. Because of the charging current of the APFC capacitor(s), PSUs produce large inrush-current right as they are turned on. Large inrush current can cause the tripping of circuit breakers and fuses and may also damage switches, relays, and bridge rectifiers; as a result, the lower the inrush current of a PSU right as it is turned on, the better.
Compared to other units of similar capacity, inrush current was low.
Load Regulation and Efficiency Measurements
The first set of tests revealed the stability of the voltage rails and the PSU's efficiency. The applied load was equal to (approximately) 10%-110% of the maximum load the PSU can handle, in 10% steps.We conducted two additional tests. In the first test, we stressed the two minor rails (5V and 3.3V) with a high load while the load at +12V was only 0.10 A. This test reveals whether the PSU is Haswell ready or not. In the second test, we dialed the maximum load the +12V rail can handle while the load on the minor rails was minimal.
| Load Regulation & Efficiency Testing Data - Thermaltake TPG-1050D-G | ||||||||||
|---|---|---|---|---|---|---|---|---|---|---|
| Test | 12 V | 5 V | 3.3 V | 5VSB | Power (DC/AC) | Efficiency | Fan Speed | Fan Noise | Temp (In/Out) | PF/AC Volts |
| 10% Load | 6.878A | 1.963A | 1.970A | 0.985A | 104.68W | 89.04% | 415 RPM | 27.5 dBA | 39.63°C | 0.887 |
| 12.088V | 5.079V | 3.345V | 5.053V | 117.57W | 43.08°C | 230.1V | ||||
| 20% Load | 14.821A | 2.957A | 2.967A | 1.190A | 209.59W | 92.36% | 415 RPM | 27.5 dBA | 39.86°C | 0.951 |
| 12.060V | 5.062V | 3.333V | 5.033V | 226.94W | 43.51°C | 230.3V | ||||
| 30% Load | 23.157A | 3.465A | 3.489A | 1.395A | 314.72W | 93.08% | 420 RPM | 27.5 dBA | 40.29°C | 0.978 |
| 12.033V | 5.048V | 3.321V | 5.013V | 338.11W | 45.25°C | 230.3V | ||||
| 40% Load | 31.517A | 3.972A | 3.984A | 1.600A | 419.57W | 93.16% | 420 RPM | 27.5 dBA | 41.31°C | 0.988 |
| 12.006V | 5.034V | 3.311V | 4.995V | 450.40W | 46.80°C | 230.2V | ||||
| 50% Load | 39.447A | 4.977A | 5.003A | 1.805A | 524.48W | 92.78% | 420 RPM | 27.5 dBA | 42.40°C | 0.991 |
| 12.017V | 5.017V | 3.296V | 4.977V | 565.30W | 48.67°C | 230.2V | ||||
| 60% Load | 47.133A | 6.000A | 6.026A | 2.014A | 629.42W | 92.39% | 584 RPM | 29.2 dBA | 43.30°C | 0.994 |
| 12.086V | 5.000V | 3.284V | 4.956V | 681.30W | 50.01°C | 230.2V | ||||
| 70% Load | 55.179A | 7.018A | 7.059A | 2.225A | 734.31W | 91.89% | 720 RPM | 31.0 dBA | 44.82°C | 0.996 |
| 12.057V | 4.980V | 3.270V | 4.937V | 799.15W | 51.94°C | 230.1V | ||||
| 80% Load | 63.261A | 8.063A | 8.108A | 2.440A | 839.23W | 91.26% | 825 RPM | 34.2 dBA | 46.47°C | 0.996 |
| 12.027V | 4.961V | 3.256V | 4.913V | 919.65W | 53.96°C | 230.1V | ||||
| 90% Load | 71.795A | 8.591A | 8.661A | 2.445A | 944.13W | 90.57% | 956 RPM | 36.8 dBA | 47.03°C | 0.997 |
| 12.000V | 4.947V | 3.245V | 4.901V | 1042.45W | 54.90°C | 230.1V | ||||
| 100% Load | 80.143A | 9.124A | 9.193A | 3.080A | 1048.90W | 89.71% | 1248 RPM | 45.5 dBA | 48.13°C | 0.997 |
| 11.969V | 4.930V | 3.231V | 4.866V | 1169.25W | 56.38°C | 230.0V | ||||
| 110% Load | 89.129A | 9.146A | 9.225A | 3.087A | 1153.51W | 88.79% | 1436 RPM | 48.5 dBA | 49.92°C | 0.997 |
| 11.936V | 4.919V | 3.219V | 4.854V | 1299.20W | 58.71°C | 229.9V | ||||
| Crossload 1 | 0.098A | 16.018A | 16.005A | 0.004A | 133.50W | 83.64% | 420 RPM | 27.5 dBA | 46.26°C | 0.925 |
| 12.078V | 4.970V | 3.292V | 5.039V | 159.62W | 53.01°C | 230.5V | ||||
| Crossload 2 | 87.429A | 1.002A | 1.003A | 1.002A | 1058.92W | 90.08% | 1256 RPM | 45.5 dBA | 48.45°C | 0.997 |
| 11.960V | 5.000V | 3.266V | 4.975V | 1175.60W | 56.55°C | 230.0V | ||||
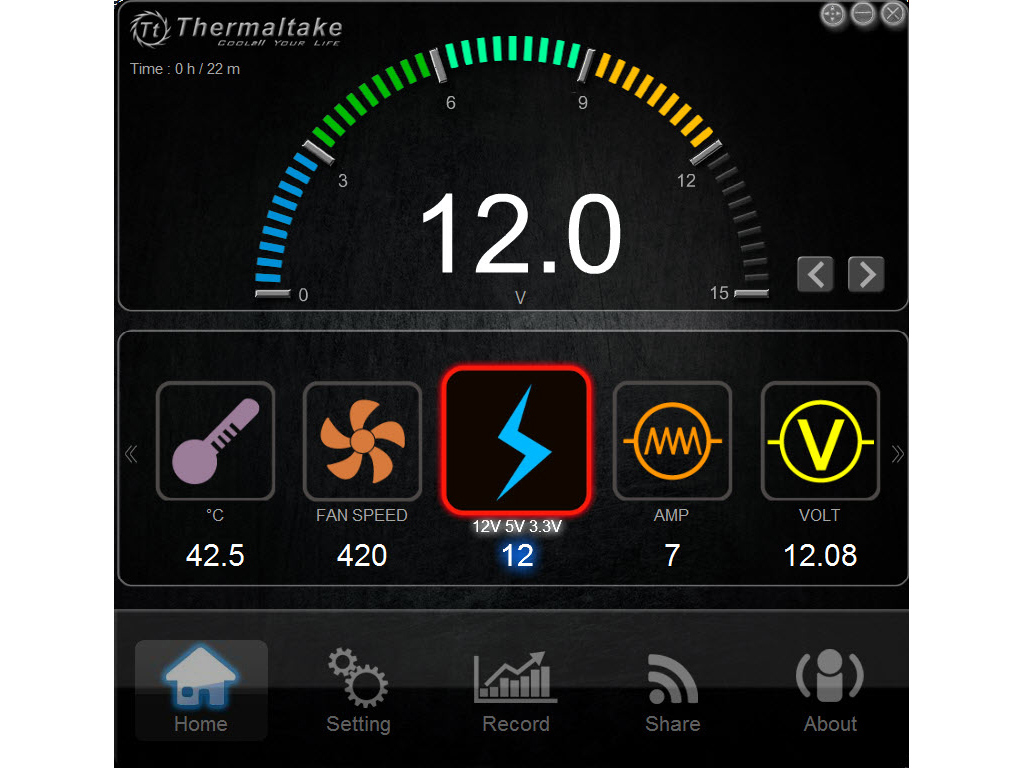
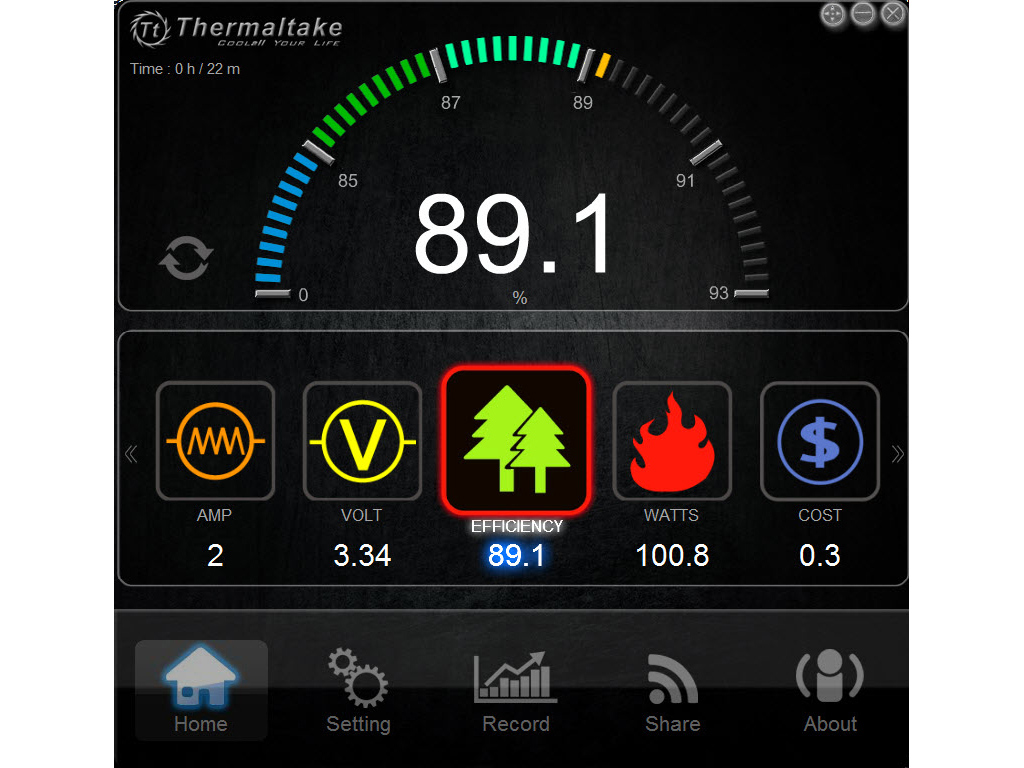
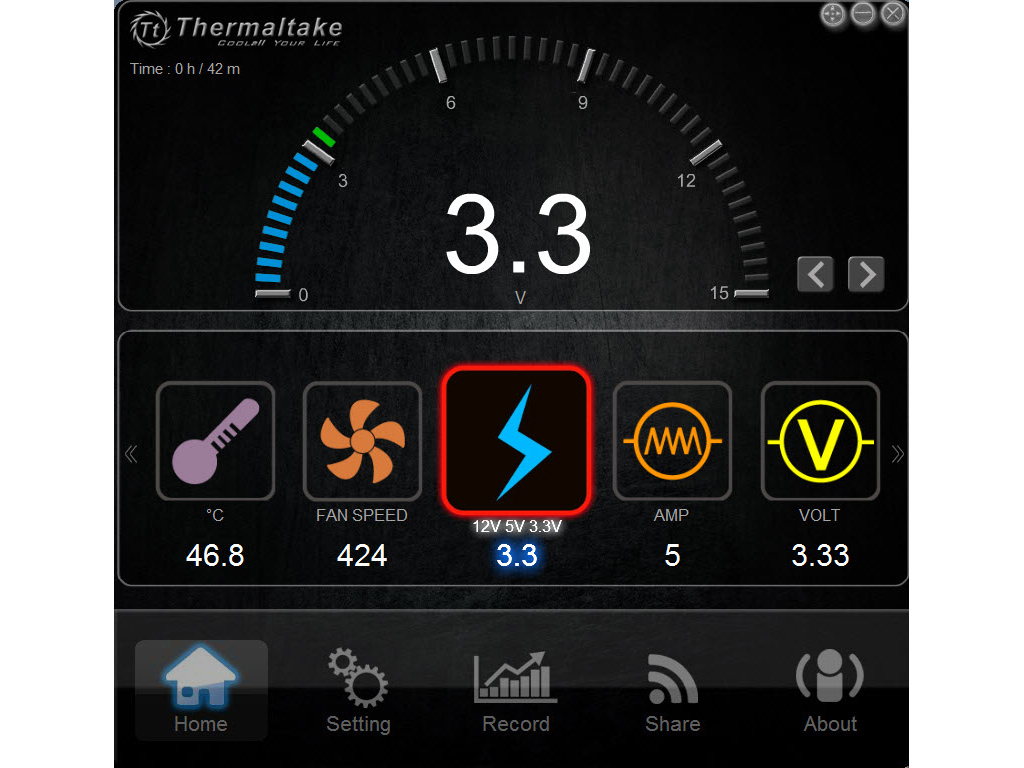
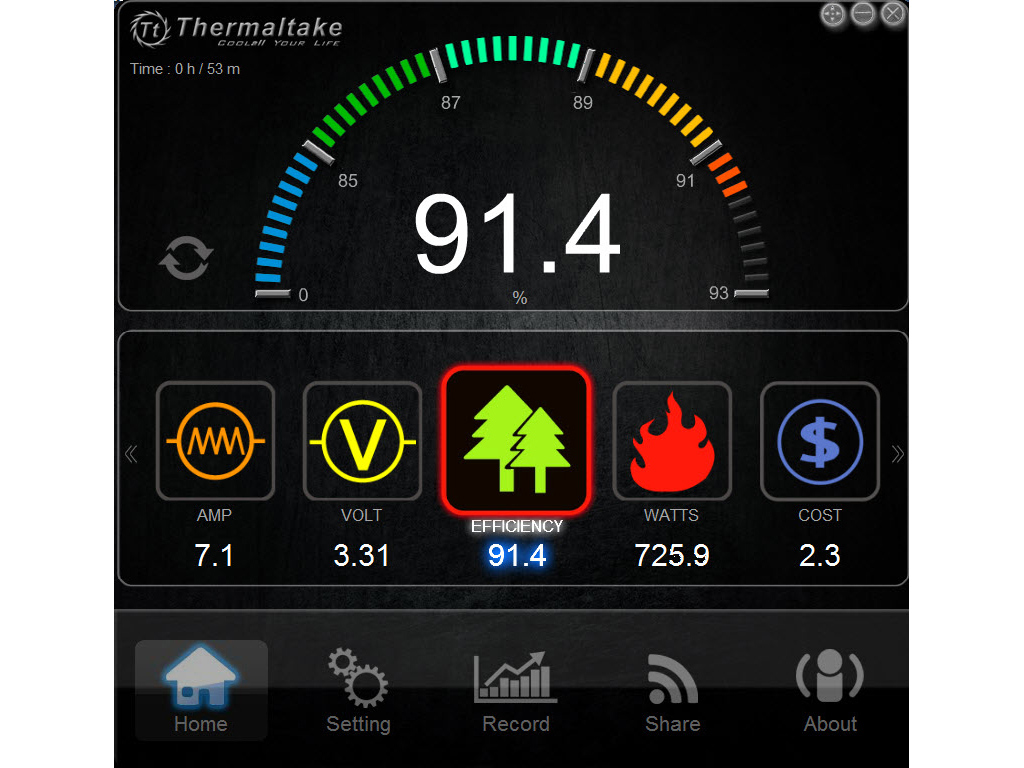
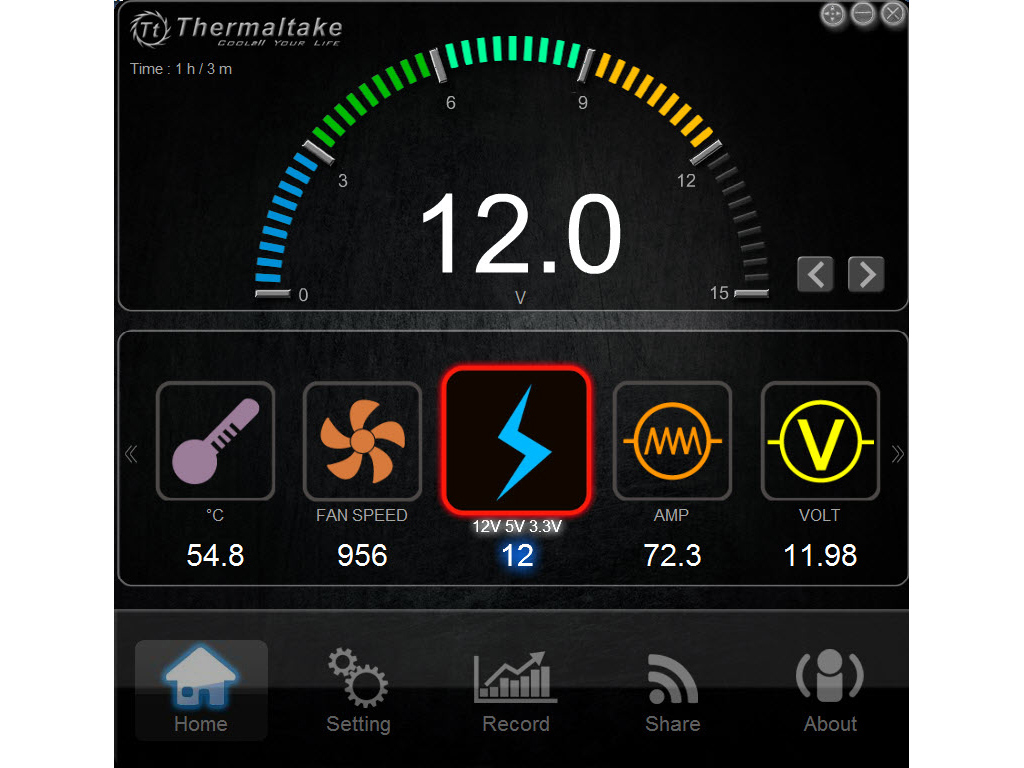
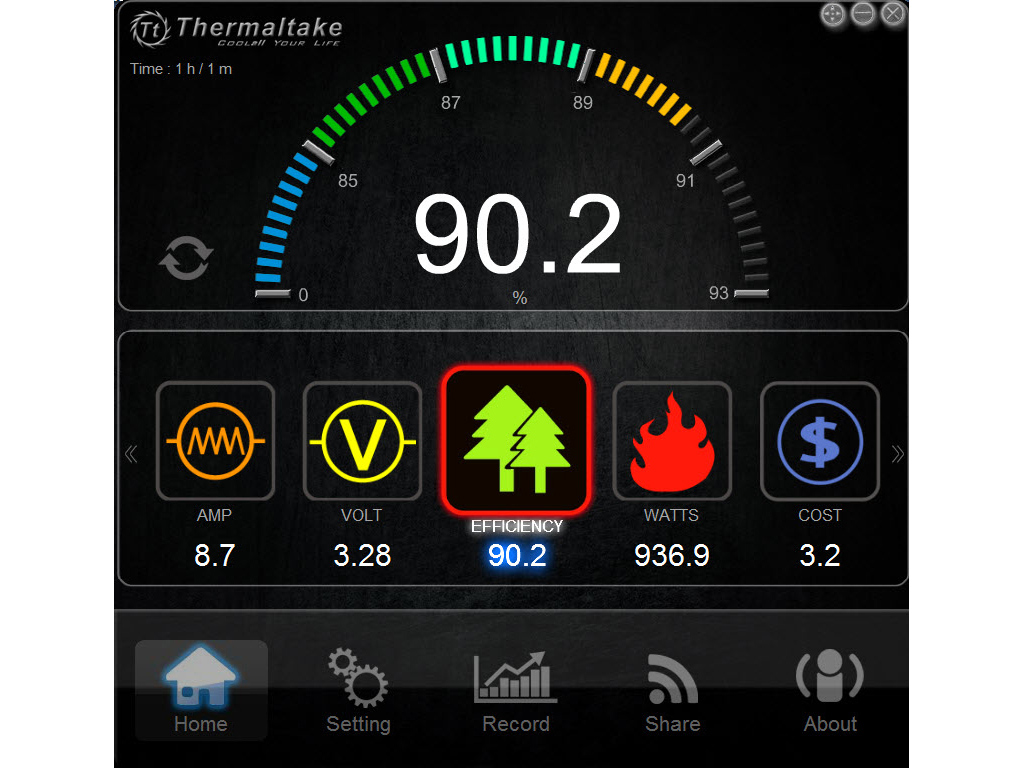
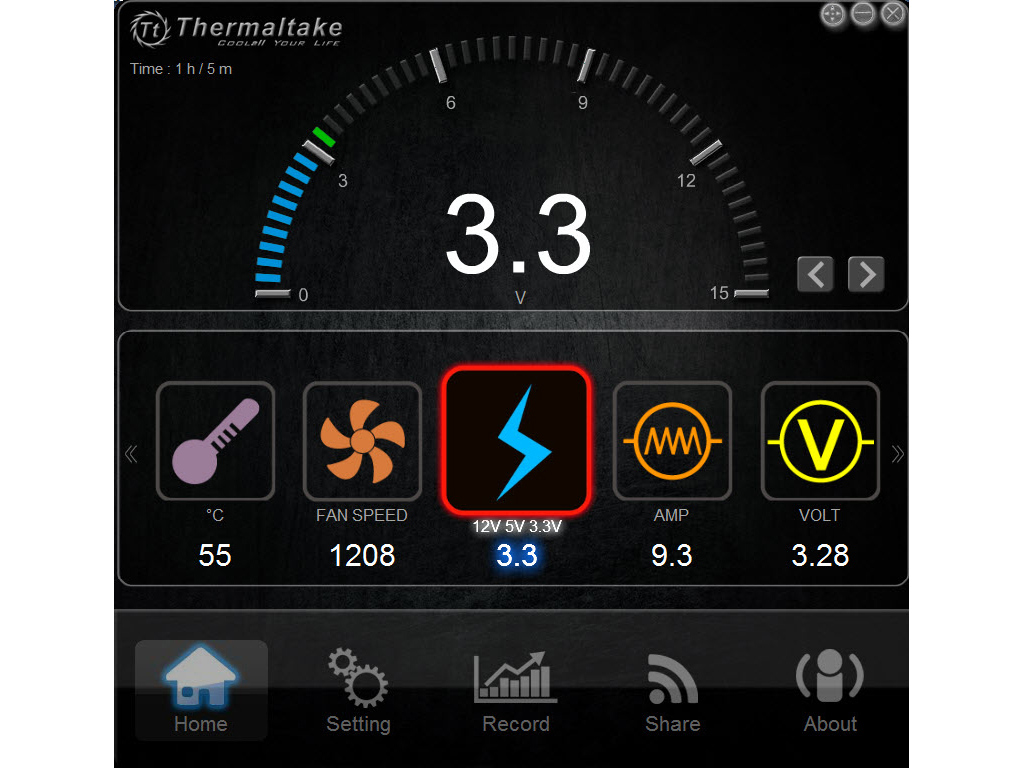
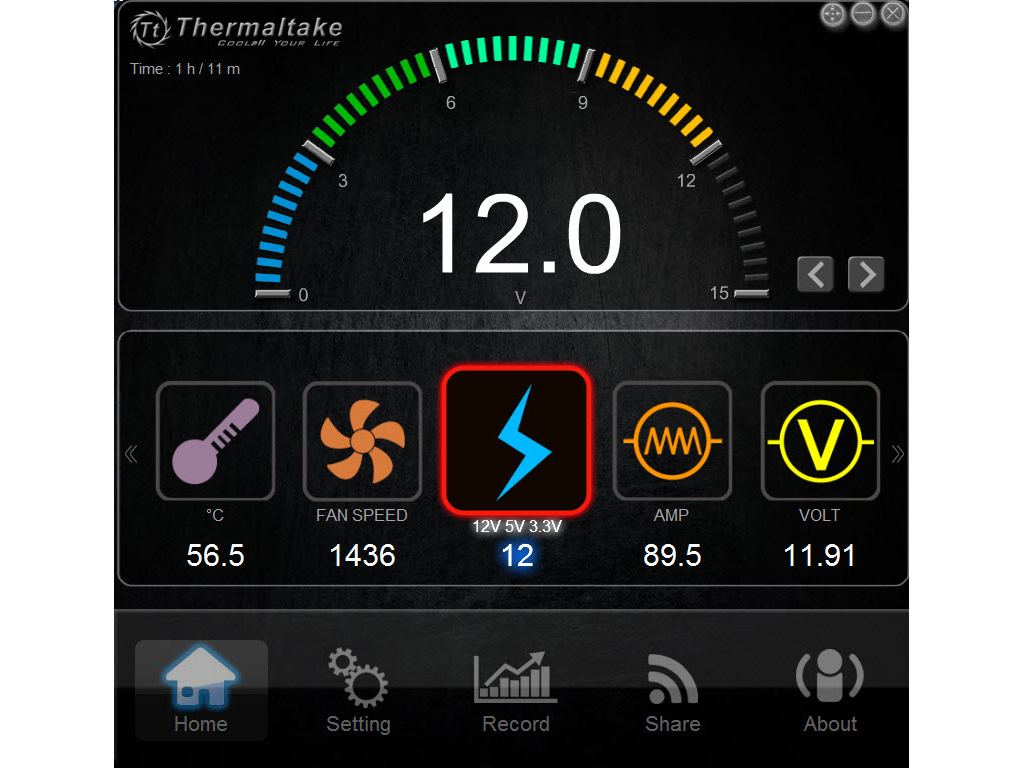
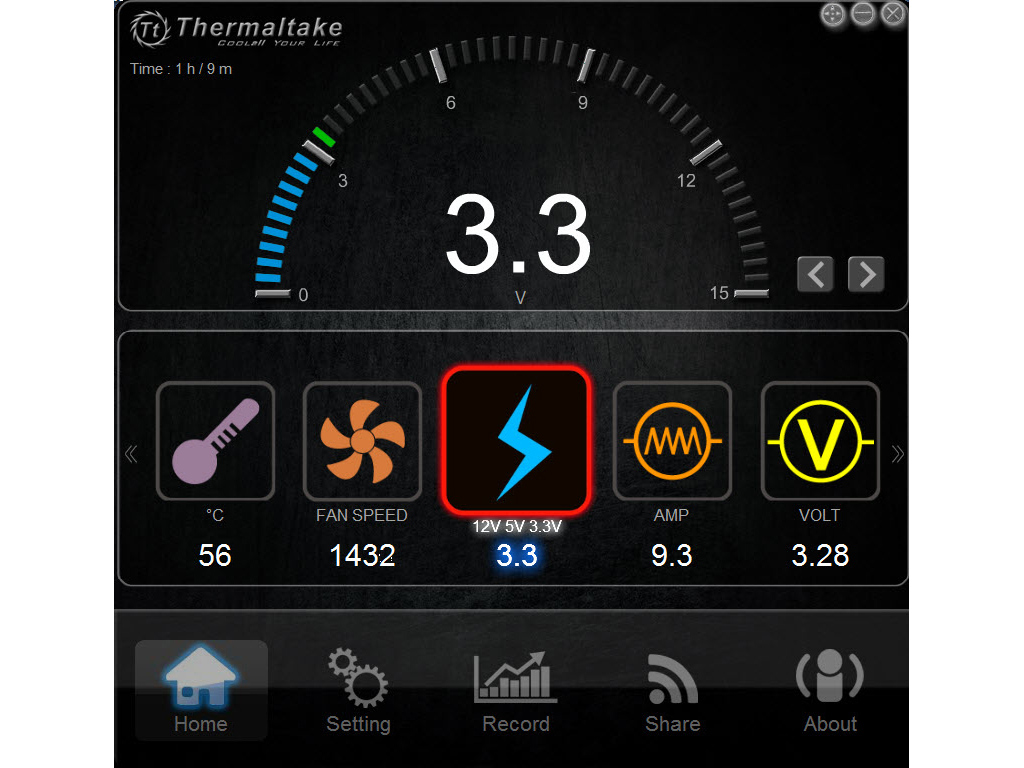
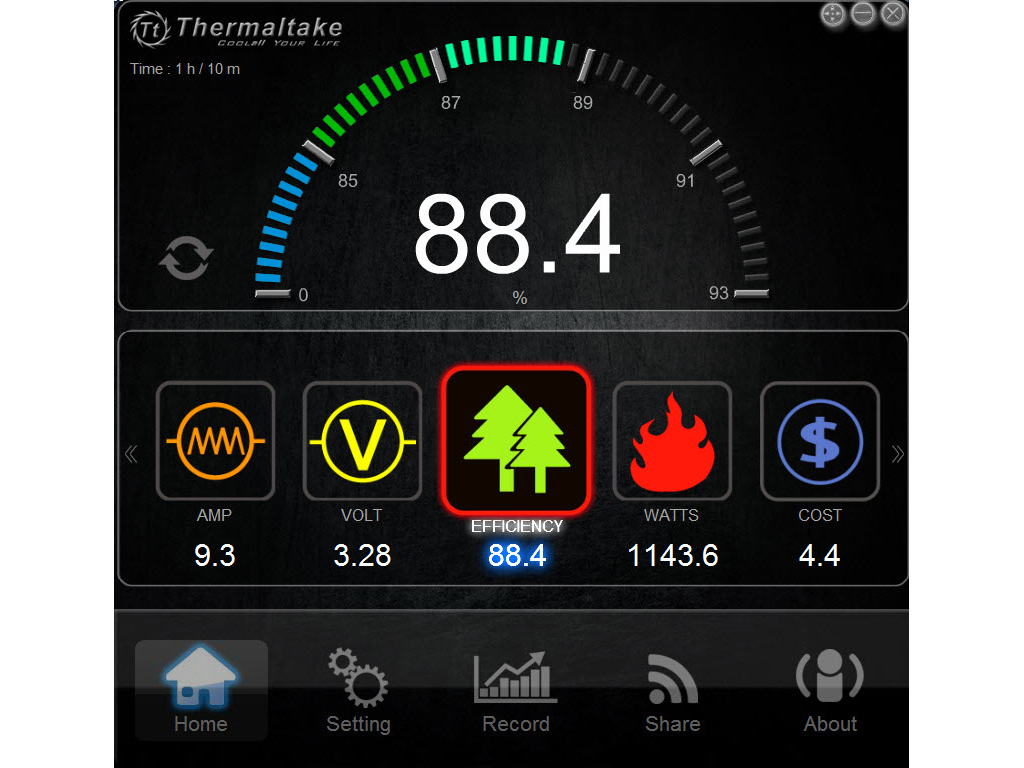
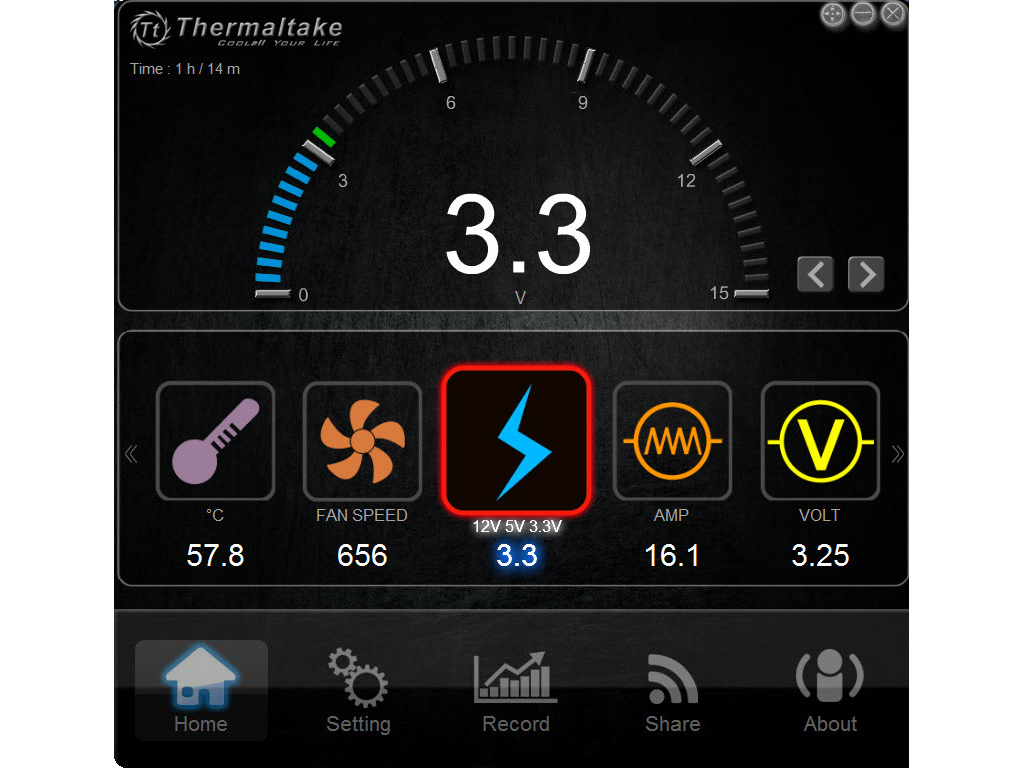
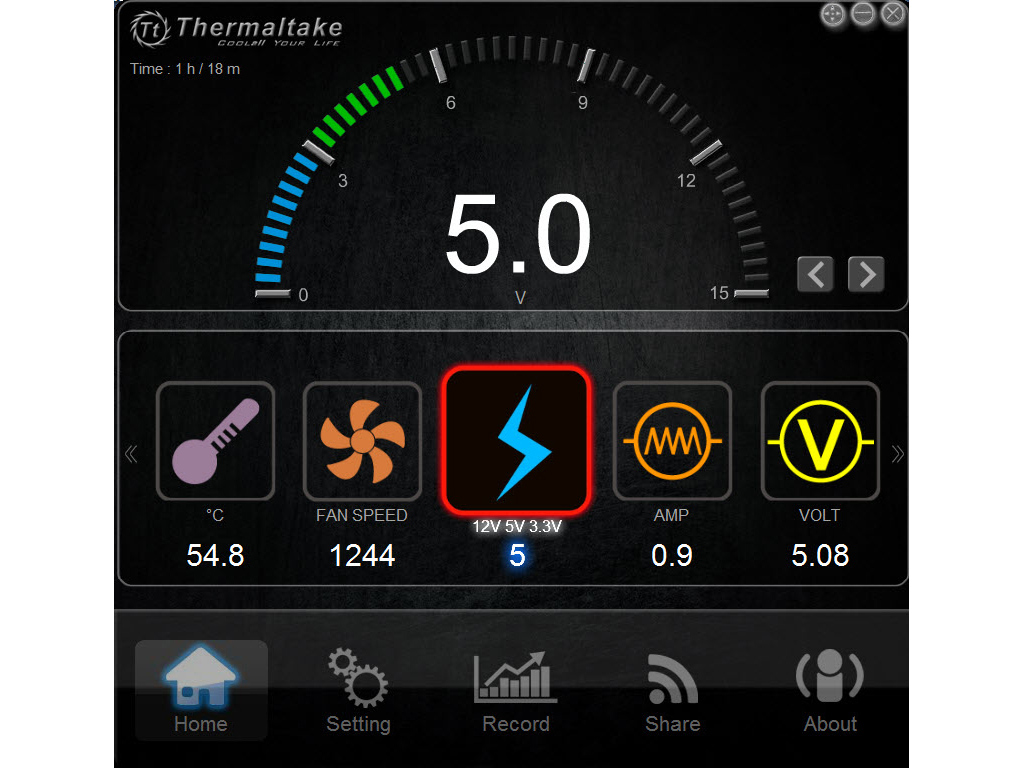
DPSApp Screenshots
Screenshots of the DPSApp software, which we took during our test sessions, follow. The order of screenshots is the same as the order of the tests shown in the table above (10% load test to Cross-load 2). Voltage readings weren't terribly accurate since they never steered far from their nominal values; however, we were surprised to find efficiency readings to be spot on.10% Load Test


20% Load Test


30% Load Test


40% Load Test


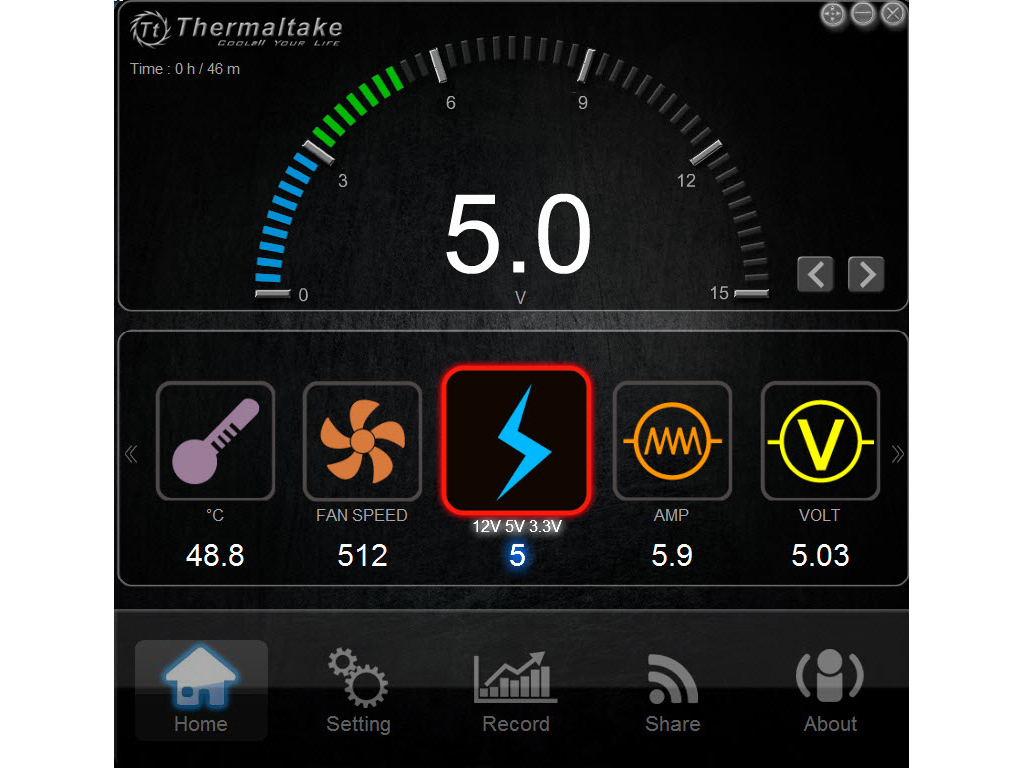
50% Load Test


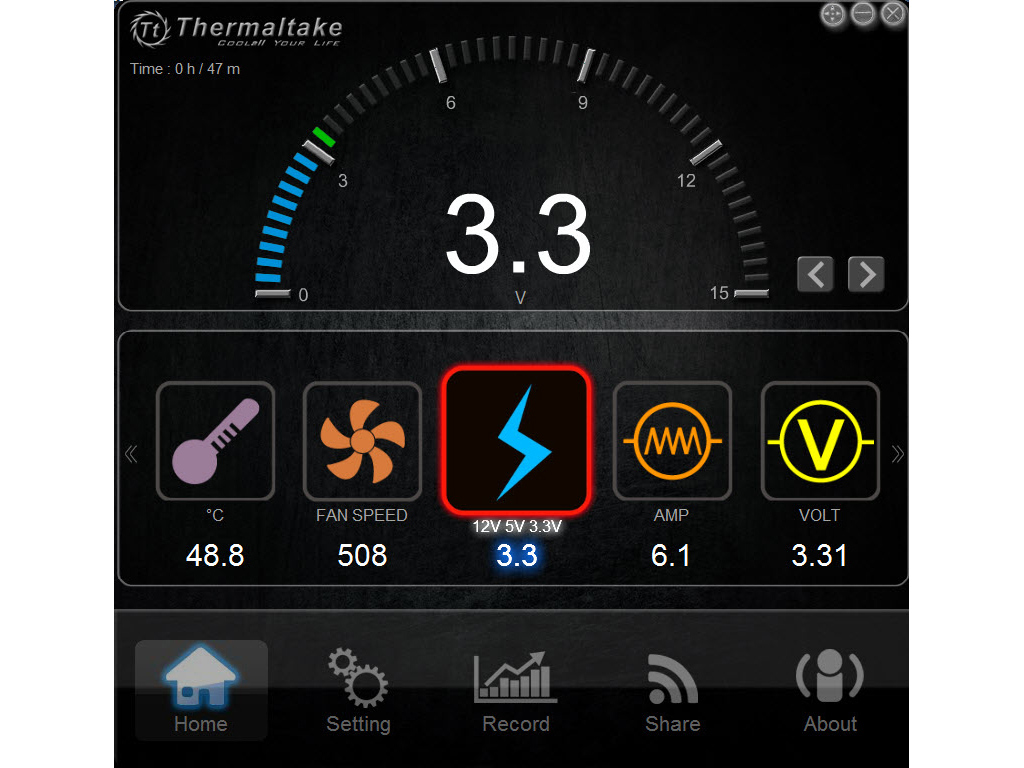
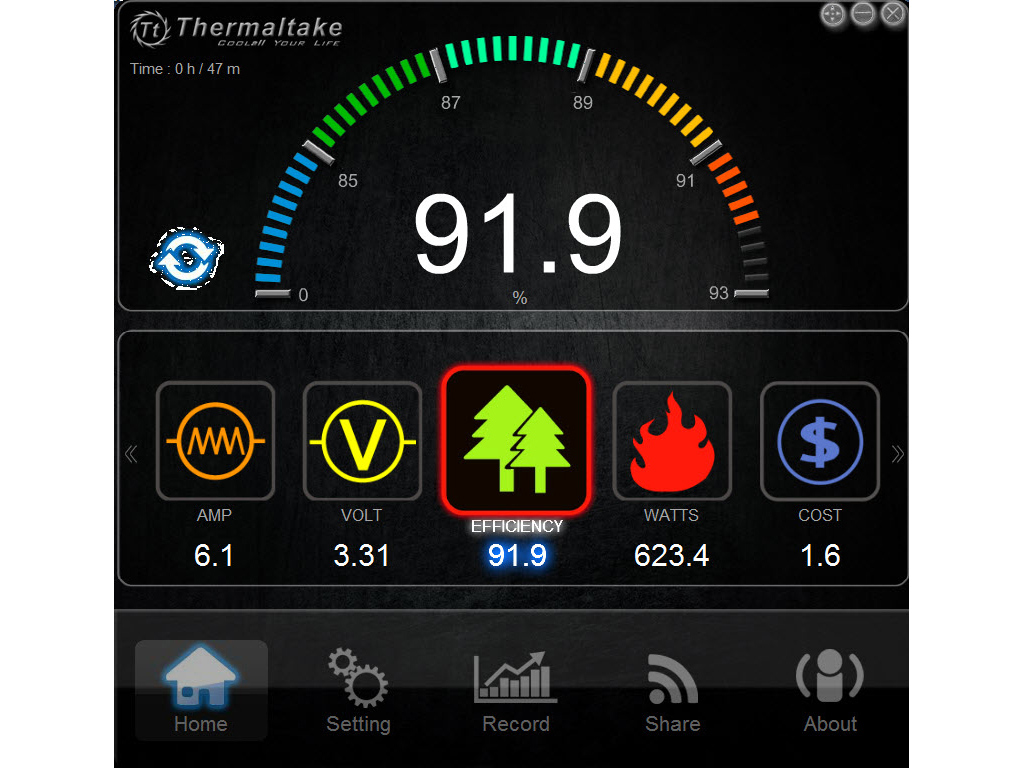
60% Load Test

70% Load Test


80% Load Test


90% Load Test


100% Load Test


110% Load Test

CL1 Load Test


CL2 Load Test


May 14th, 2024 13:26 EDT
change timezone
Latest GPU Drivers
New Forum Posts
- Battery swap for cyberpower UPS (89)
- The sands of time have run out, Son of Durotan. (Warcraft III Fan Club/Memories Thread) (8)
- Can't find rx 580 2048sp vbios (26)
- not impressed - nvme vs ssd (120)
- Air makes its way from the reservoir into the radiator. (68)
- What are you playing? (20639)
- Your PC ATM (34553)
- Purchased an AX1200i PSU as part of some forward planning, what tier is this PSU? (102)
- Ubuntu 24.04 LTS released (25)
- CYBERPUNK 2077 O.F. (8)
Popular Reviews
- Homeworld 3 Performance Benchmark Review - 35 GPUs Tested
- ZMF Caldera Closed Planar Magnetic Headphones Review
- Corsair MP700 Pro SE 4 TB Review
- Upcoming Hardware Launches 2023 (Updated Feb 2024)
- ThundeRobot ML903 NearLink Review
- AMD Ryzen 7 7800X3D Review - The Best Gaming CPU
- Bykski CPU-XPR-C-I CPU Water Block Review - Amazing Value!
- CHERRY XTRFY M64 Pro Review
- ASRock Radeon RX 7900 XT Phantom Gaming White Review
- Enermax REVOLUTION D.F. X 1200 W Review
Controversial News Posts
- Intel Statement on Stability Issues: "Motherboard Makers to Blame" (266)
- AMD to Redesign Ray Tracing Hardware on RDNA 4 (227)
- Windows 11 Now Officially Adware as Microsoft Embeds Ads in the Start Menu (172)
- NVIDIA to Only Launch the Flagship GeForce RTX 5090 in 2024, Rest of the Series in 2025 (152)
- AMD Hits Highest-Ever x86 CPU Market Share in Q1 2024 Across Desktop and Server (124)
- Sony PlayStation 5 Pro Specifications Confirmed, Console Arrives Before Holidays (119)
- AMD's RDNA 4 GPUs Could Stick with 18 Gbps GDDR6 Memory (114)
- AMD Ryzen 9 7900X3D Now at a Mouth-watering $329 (104)