 4
UPERFECT BE173BU Review - Sharp Picture, Blurred Gaming Ambitions
Value & Conclusion »Gaming Performance
The BE173BU runs at 120 Hz, supports FreeSync, and its OSD adds a black equalizer and picture presets. Whether the panel can cash those checks is another matter, so let's measure it.Response Time and Overdrive
I tested the response time with the Open Source Response Time Tool Pro (OSRTT Pro), developed by Andrew McDonald of TechTeamGB. It's a nifty tool that, combined with the OSRTT Launcher app, measures panel response times and presents them through detailed graphs and easy-to-read heatmaps. You can find everything you might want to know about the OSRTT in its technical documentation and on the official website, where you can order your unit, too. The OSRTT Launcher gives us three interesting heat maps to observe.Perceived Response Time tells us how much time the panel took to transition from one color to another. This measurement is expressed in milliseconds and includes overshoot. In other words, if the panel exceeded the target value, the perceived response time also includes the time it took for the transition to recover from overshoot and stabilize on the target value. I'm running my tests with recommended settings, so with a fixed RGB 10 tolerance level and with gamma-corrected RGB values.
RGB Overshoot tells us how much a specific transition missed the target value. For example, if the panel was transitioning from RGB 51 to RGB 204, and it initially landed on RGB 212, the overshoot RGB value is 8. Overshoot can be both positive and negative, and it commonly occurs at extreme overdrive settings when pixels are driven by high voltage. In practice, an overshoot manifests as an afterimage or a halo around a moving object. It can be easily spotted even when doing something as basic as scrolling through a webpage.
Visual Response Rating is the most abstract heatmap generated by the OSRTT Launcher; in essence, it's an ever-evolving scoring system. To quote OSRTT's technical documentation, it is a finite score rather than a direct measurement. The calculation is pretty simple; it's: "100 - (Initial Response Time + Perceived Response Time)." Since both metrics use the same tolerance level, if a display doesn't overshoot, both times will be identical. This essentially rewards displays that are fast with a small amount of overshoot over displays that aren't as fast even if they don't overshoot at all - while still overall preferring ultra-fast, accurate monitors.
Here's how the UPERFECT BE173BU fares in the pixel response time test.
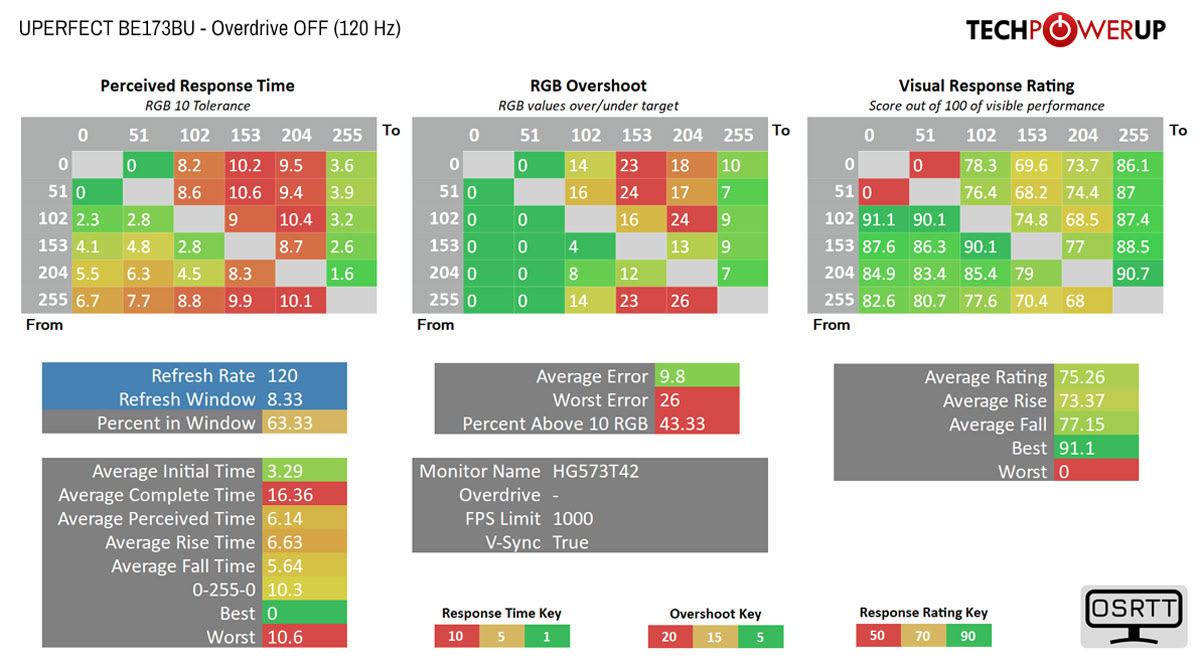
The results are a mixed picture, and the overshoot is the headline. The average perceived response time was 6.14 ms, with an average complete time of 16.36 ms, an average initial time of 3.29 ms, and average rise and fall times of 6.63 ms and 5.64 ms. The full 0-255-0 transition takes 10.3 ms, while the slowest individual transition reaches 10.6 ms. Only 63.33% of transitions finished inside the 8.33 ms refresh window at 120 Hz, so the panel frequently cannot keep up with its own refresh rate, and you do not get the full motion-clarity benefit that 120 Hz implies. More importantly, overshoot is significant: the average error reaches 9.8 RGB levels, the worst case hits 26, and 43.33% of all transitions exceed the 10 RGB threshold. That translates into visible inverse ghosting and coronas, the kind of haloing around moving objects you can spot just scrolling a webpage, and there is no overdrive setting in the OSD to tune it out. In short, this is a reasonably responsive panel let down by aggressive overshoot.
Input Lag
To measure the input lag of a monitor, I switched from using the LDAT V2 (Latency Display Analysis Tool), which I've covered extensively in my NVIDIA Reflex review, to the OSRTT Pro Tool. The OSRTT Pro Tool and the accompanying software include a DirectX code developed by Andrew McDonald of TechTeamGB, which allows the OSRTT Launcher to track the events and capture the frame time, making it possible to isolate the monitor latency from other factors that come into play when using the click-to-photon testing methodology, namely the USB polling rate and game render time. For a deeper insight, I suggest you watch an excellent overview video made by Andy himself.Here's how the UPERFECT BE173BU holds up in terms of input lag after doing 100 iterations of the input lag test.
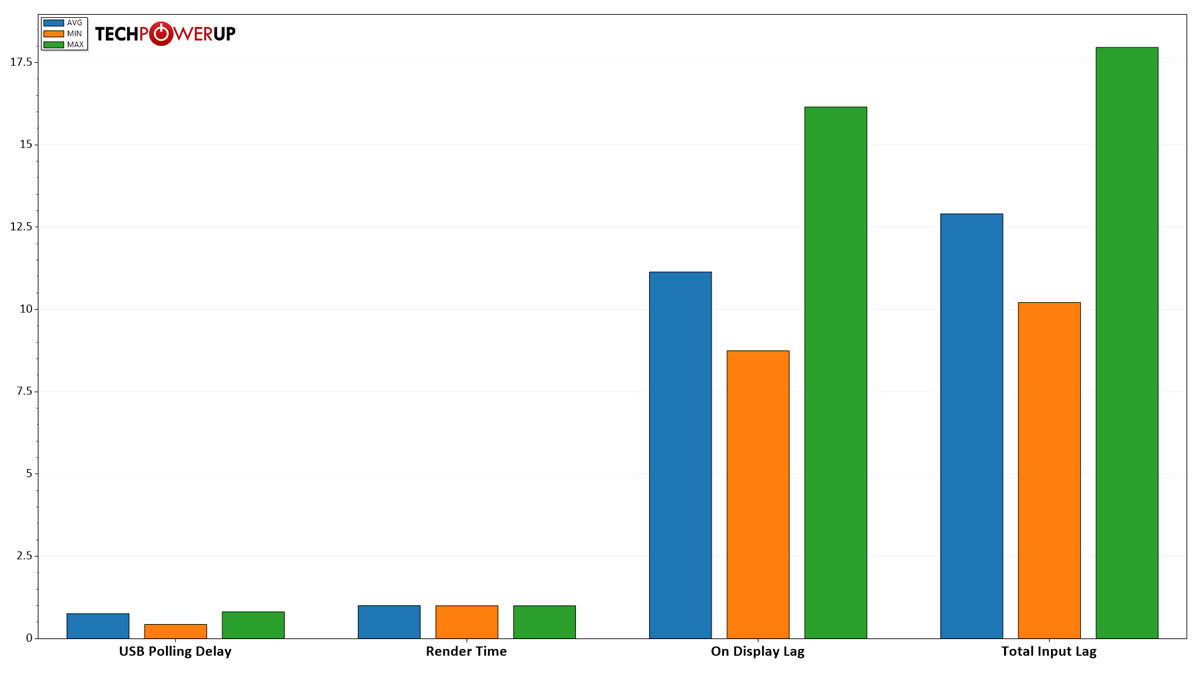
On-display lag averages about 11.1 ms, with the fastest sample near 8.7 ms and the slowest around 16.2 ms. At 120 Hz, one frame interval is 8.33 ms, so the average sits at roughly 1.3 frames of delay, and even the best case is close to a full frame. That is on the higher side for a display marketed on its gaming credentials, and combined with the overshoot it means the 120 Hz panel does not feel as sharp in motion as the spec sheet suggests. It is fine for general use and casual gaming, but competitive players will notice.
Nov 19th, 2026 16:20 CST
change timezone
Latest GPU Drivers
New Forum Posts
- Honestly, do you care about GTA VI? (166)
- Introducing DST Bench : one of the most advanced disk benchmark and storage analyzer real-time software (6)
- Making a game in Godot engine (5)
- Windows 11 General Discussion (7736)
- Current Sales, Bundles, Giveaways (10448)
- Last game you purchased? (1409)
- WarpCoreBench scores! (76)
- Got the EOL 32GB TridentZ 6000 CL26 1.4V (12)
- Dell Workstation Owners Club (3516)
- DTS DCH Driver for Realtek HDA [DTS:X APO4 + DTS Interactive] (2815)
Popular Reviews
- Acemagic Retro X3 Review
- Ugreen NASync DXP4800 GT Review
- Upcoming Hardware Launches 2027 (Updated Nov 2026)
- Pulsar Office Tour & First Look at P1 Dual-Sensor Mouse
- AMD Zen 6 Technical Deep Dive
- Biwin Black Opal NV7400 2 TB Review
- Sapphire Radeon RX 7700 XT Pure Review
- Sapphire Radeon RX 7700 XT Pulse Review
- AMD Ryzen 7 9800X3D Review - The Best Gaming Processor
- Chieftec Iceberg PRO 360 DARK Review
TPU on YouTube
Controversial News Posts
- NVIDIA Co-Founder and CEO Jensen Huang Officially Resigns (489)
- Report: Jensen Huang Eyes NVIDIA Comeback (223)
- Open Letter Asking NVIDIA to Reinstate Jensen Huang Passes 115,000 Signatures (184)
- OpenAI CEO Argues Home PCs Waste the World's Limited DRAM Supply (152)
- NVIDIA Launches Investigation Into Jensen Huang's Relationship With Suspected Chinese Spy (136)
- Intel "Raptor Lake Next" 16-Core and 20-Core CPUs Surface (130)
- Legendary Game Studio BioWare Shuts Down Following EA Layoffs (104)
- Dell CEO Says the Memory Shortage Will Get Worse in 2027 (95)