 57
57
MSI GeForce RTX 2070 Gaming Z 8 GB Review
Temperatures & Clock Profiles »Overclocking
Overclocking results listed in this section are achieved with the default fan, power, and voltage settings as defined in the VGA BIOS. We choose this approach as it is the most realistic scenario for most users.Every sample overclocks differently, which is why our results here can only serve as a guideline for what you can expect from your card.

Overclocking on Turing is massively complicated by the fact that the power limit is always limiting the clock frequencies. So you can't just dial in a frequency to test and then run any game to test for stability. The issue here is that another game might cause loads that are lighter, which causes higher boost clocks, leading to a crash due to too much overclocking.
With manual overclocking, the maximum overclock of our sample is 2015 MHz on the memory (15% overclock) and +90 MHz to the GPU's base clock, which increases maximum Boost from 1965 MHz to 2015 MHz (3% overclock).
| Maximum Overclock Comparison | ||
|---|---|---|
| Max. GPU Clock | Max. Memory Clock | |
| EVGA RTX 2070 Black | 2025 MHz | 1995 MHz |
| MSI RTX 2070 Gaming Z | 2015 MHz | 2015 MHz |
| NVIDIA RTX 2070 Founders Edition | 2040 MHz | 1985 MHz |
| ASUS RTX 2080 Ti STRIX | 2115 MHz | 2065 MHz |
| MSI RTX 2080 Ti Duke | 2115 MHz | 2005 MHz |
| MSI RTX 2080 Ti Gaming X Trio | 2085 MHz | 2005 MHz |
| NVIDIA RTX 2080 Ti Founders Edition | 2110 MHz | 1945 MHz |
| Zotac RTX 2080 Ti AMP | 2145 MHz | 2000 MHz |
| ASUS RTX 2080 STRIX | 2085 MHz | 1940 MHz |
| Gigabyte RTX 2080 Gaming OC | 2040 MHz | 2070 MHz |
| MSI RTX 2080 Gaming X Trio | 2115 MHz | 1995 MHz |
| NVIDIA RTX 2080 Founders Edition | 2100 MHz | 1980 MHz |
| Palit RTX 2080 Gaming Pro | 2085 MHz | 2070 MHz |
| Palit RTX 2080 Super JetStream | 2040 MHz | 2010 MHz |
differently based on random production variances. This table just serves to provide a list of typical
overclocks for similar cards, determined during TPU review.
Overclocked Performance
Using these clock frequencies, we ran a quick test of Unigine Heaven to evaluate the gains from overclocking.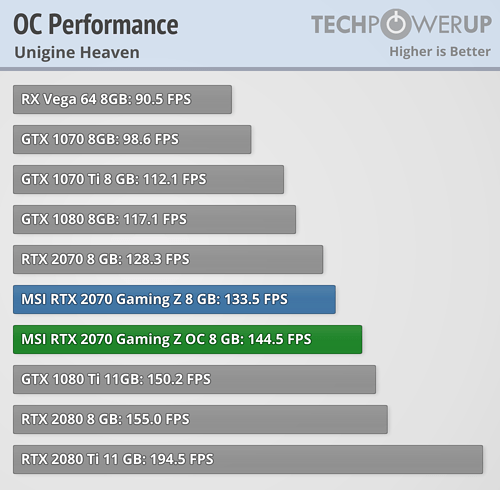
Actual 3D performance gained from overclocking is 8.2%.
Power Limits
All NVIDIA graphics cards have a power limit defined in the BIOS, which limits power draw by adjusting Boost frequencies accordingly. A second limit exists that defines the maximum TDP adjustment limit for user overclocking; i.e., how far the power slider will go. In the second chart, the (+xx%) value lists the percentage increase from the tested card's default power limit to the highest manual setting available—the slider's adjustment range.

Apr 25th, 2025 00:06 EDT
change timezone
Latest GPU Drivers
New Forum Posts
- Cracks in my cpu waterblock should I be concerned? (13)
- What's your latest tech purchase? (23595)
- Have you got pie today? (16677)
- Are the 8 GB cards worth it? (177)
- pc randomly blackscreening (0)
- What are you playing? (23462)
- I dont understand the phone OS world..... (49)
- New OLED monitor makes PC unresponsive sometimes (28)
- RTX 5070ti - Which MSRP model has the better/quieter cooler design, ASUS Prime, Gigabyte Windforce or PNY? (7)
- I tried to use AMD Auto Overclock, and now my PC has been freezing up sometimes. Afterwards, the screen goes black or displays artifacts. (29)
Popular Reviews
- NVIDIA GeForce RTX 5060 Ti 8 GB Review - So Many Compromises
- Crucial CUDIMM DDR5-6400 128 GB CL52 Review
- Colorful iGame B860M Ultra V20 Review
- ASUS GeForce RTX 5060 Ti TUF OC 16 GB Review
- Upcoming Hardware Launches 2025 (Updated Apr 2025)
- Sapphire Radeon RX 9070 XT Pulse Review
- Sapphire Radeon RX 9070 XT Nitro+ Review - Beating NVIDIA
- ASRock X870E Taichi Lite Review
- AMD Ryzen 7 9800X3D Review - The Best Gaming Processor
- ASUS GeForce RTX 5080 TUF OC Review
Controversial News Posts
- NVIDIA GeForce RTX 5060 Ti 16 GB SKU Likely Launching at $499, According to Supply Chain Leak (182)
- NVIDIA Sends MSRP Numbers to Partners: GeForce RTX 5060 Ti 8 GB at $379, RTX 5060 Ti 16 GB at $429 (127)
- NVIDIA Launches GeForce RTX 5060 Series, Beginning with RTX 5060 Ti This Week (115)
- Nintendo Confirms That Switch 2 Joy-Cons Will Not Utilize Hall Effect Stick Technology (105)
- Nintendo Switch 2 Launches June 5 at $449.99 with New Hardware and Games (99)
- Sony Increases the PS5 Pricing in EMEA and ANZ by Around 25 Percent (84)
- NVIDIA PhysX and Flow Made Fully Open-Source (77)
- Windows Notepad Gets Microsoft Copilot Integration (75)