 18
Razer Viper V4 Pro Review
Testing 8000 Hz Wired & Wireless »Sensor and Performance
The Razer Viper V4 Pro is equipped with the Focus Pro 50K Optical Sensor Gen-3. According to specifications, the Focus Pro 50K Gen-3 is capable of up to 50,000 CPI, as well as a maximum tracking speed of 930 IPS, which equals 23.62 m/s. Out of the box, five pre-defined CPI steps are available: 400, 800, 1600, 3200, and 6400.All testing was done on the latest firmware (1.04.01). As such, results obtained on earlier firmware versions may differ from those presented hereafter.
CPI Accuracy
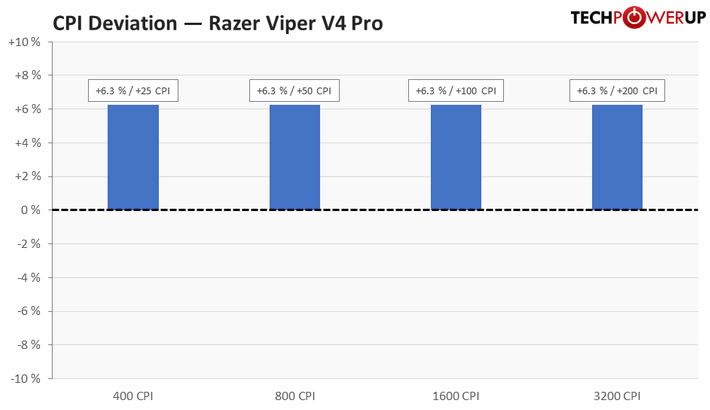
I've restricted my testing to the four most common CPI steps, which are 400, 800, 1600, and 3200. As you can see, deviation is consistently positive and high, which is a subpar result overall. In order to account for the measured deviation, adjusted steps of 375, 750, 1500, and 3000 CPI have been used for testing.
Motion Delay
Wired testing
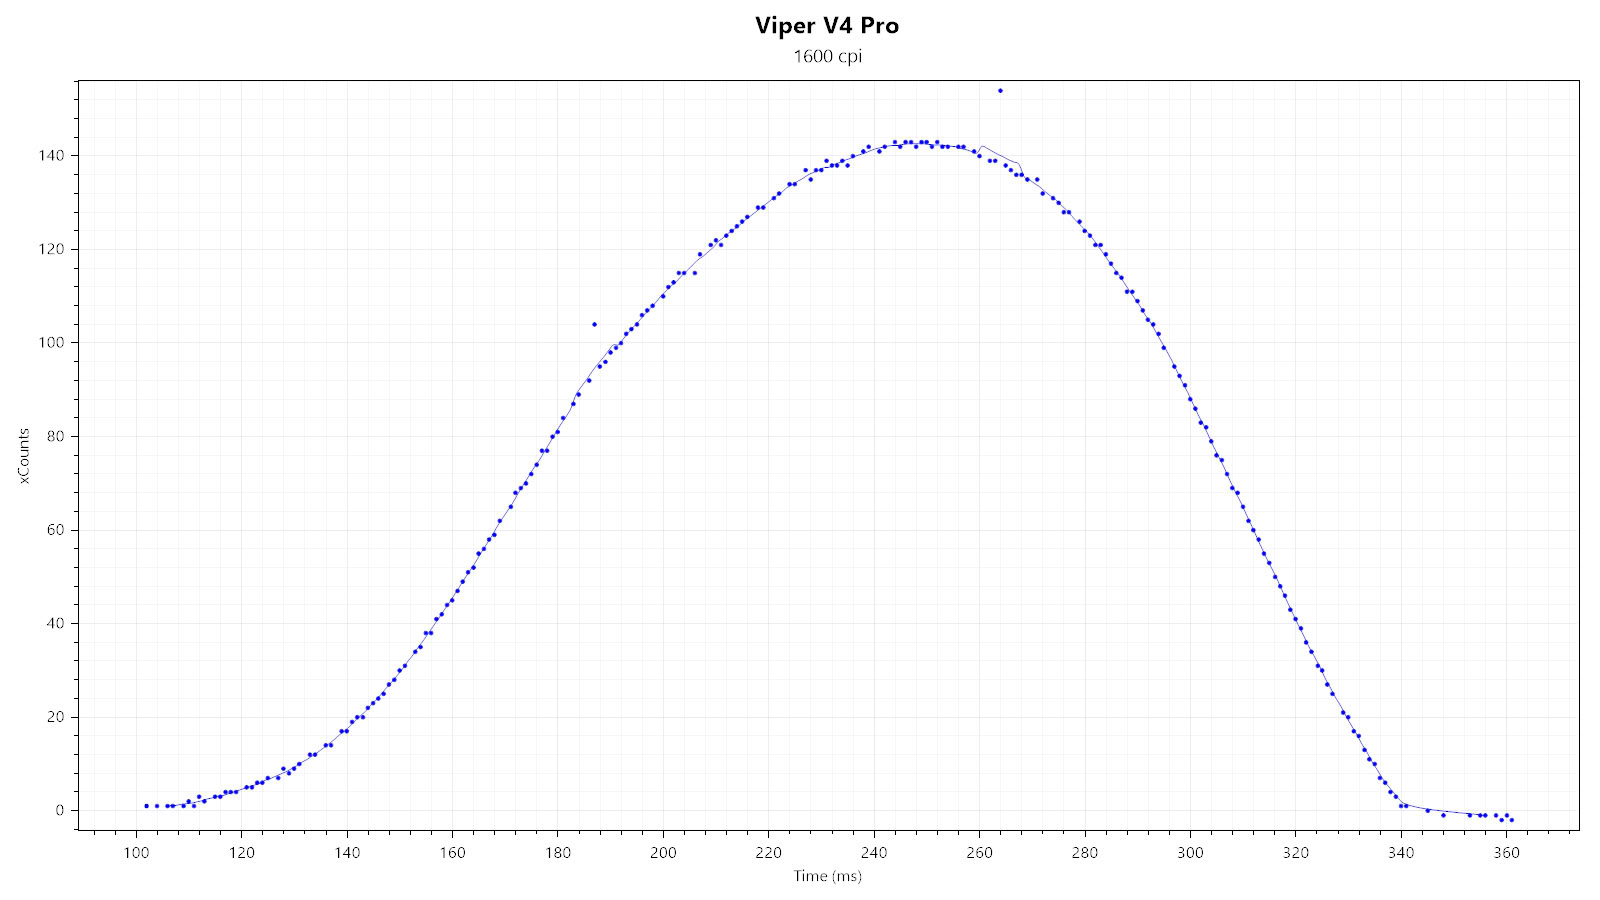
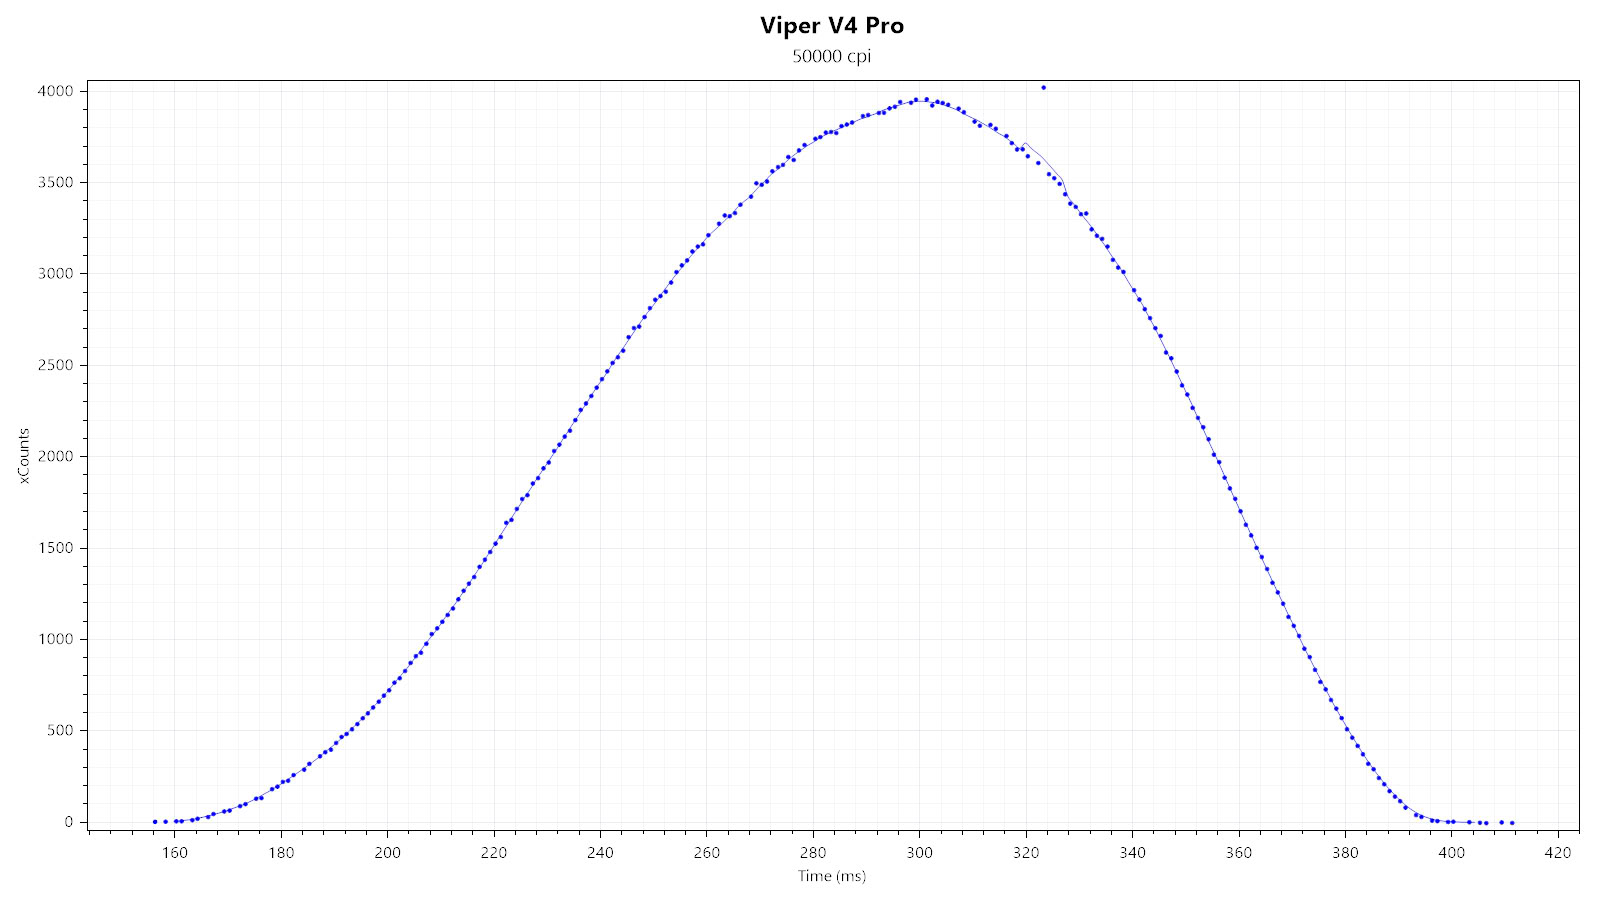
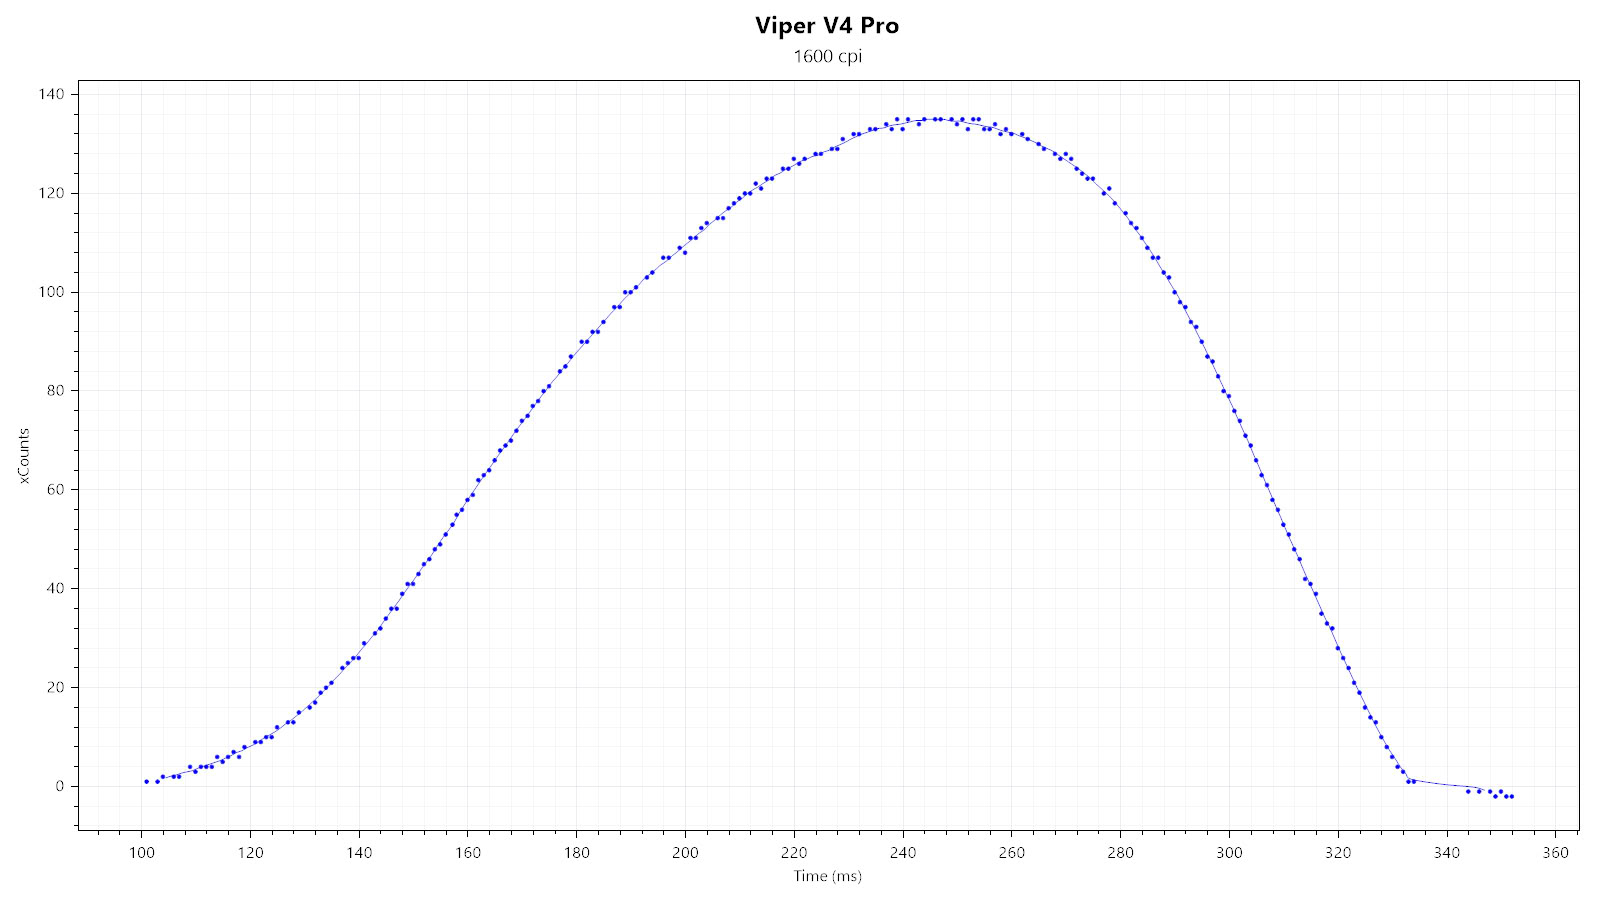
First, I'm looking at two xCounts plots—generated at 1600 and 50,000 CPI—to quickly gauge whether there is any smoothing, which would be indicated by any visible "kinks." Neither plot shows any kinks, although outliers are visible, strongly suggesting there not being smoothing across the entire CPI range.
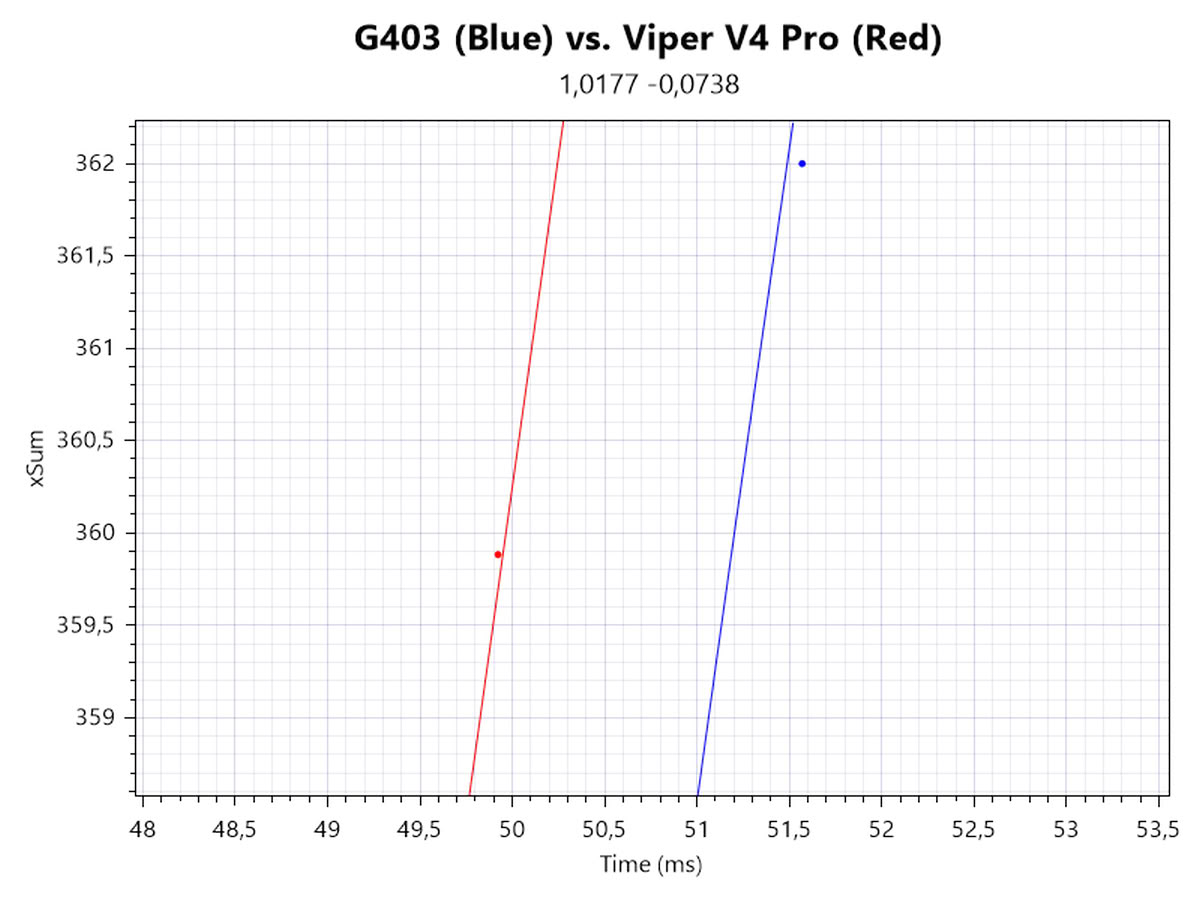
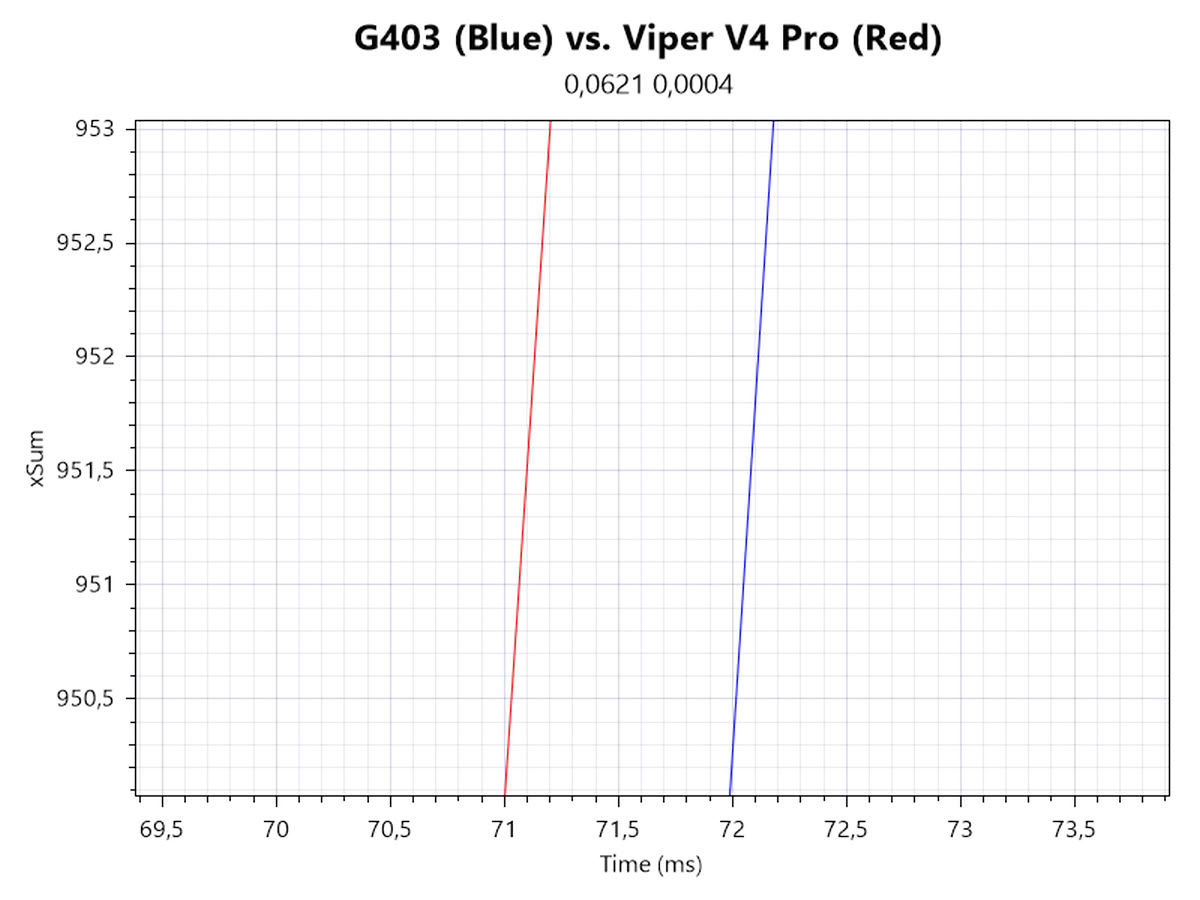
In order to determine motion delay, I'm looking at xSum plots generated at 1600 and 50,000 CPI. The line further to the left denotes the sensor with less motion delay. At 1600 CPI, the Viper V4 Pro is ahead by 1.2 ms, whereas at 50,000 CPI, it is ahead by 1.0 ms.
Wireless testing
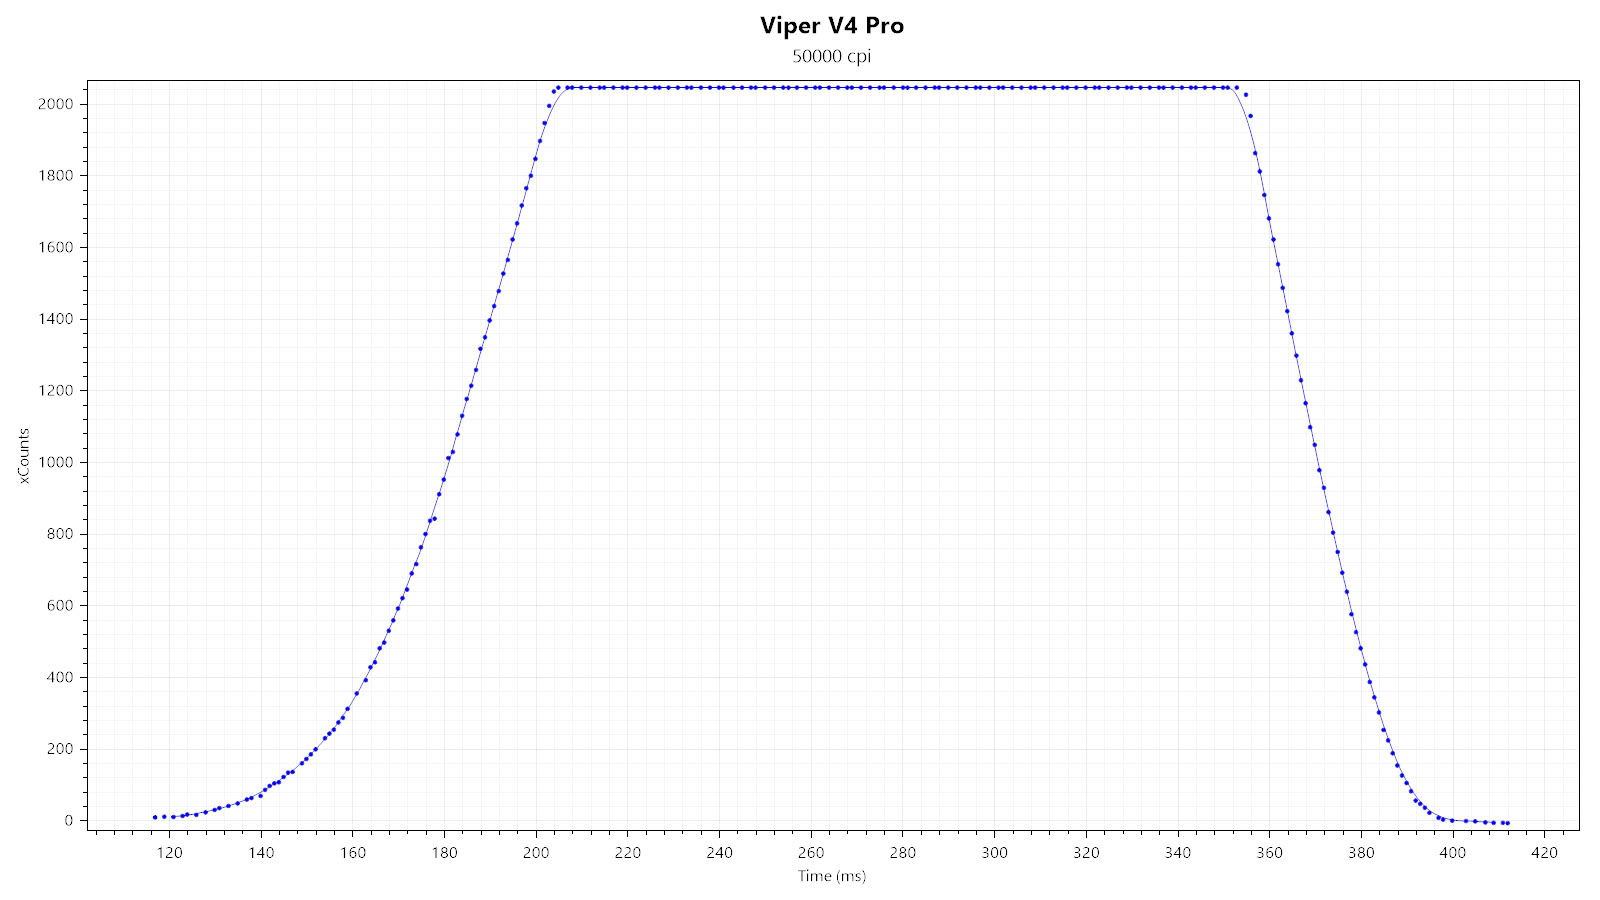
Unlike in wired operation, counts are constrained to 12-bit in wireless operation, which is why a report may not contain more than ±2047 counts. Accordingly, any motion exceeding this limit will be clipped to this value.
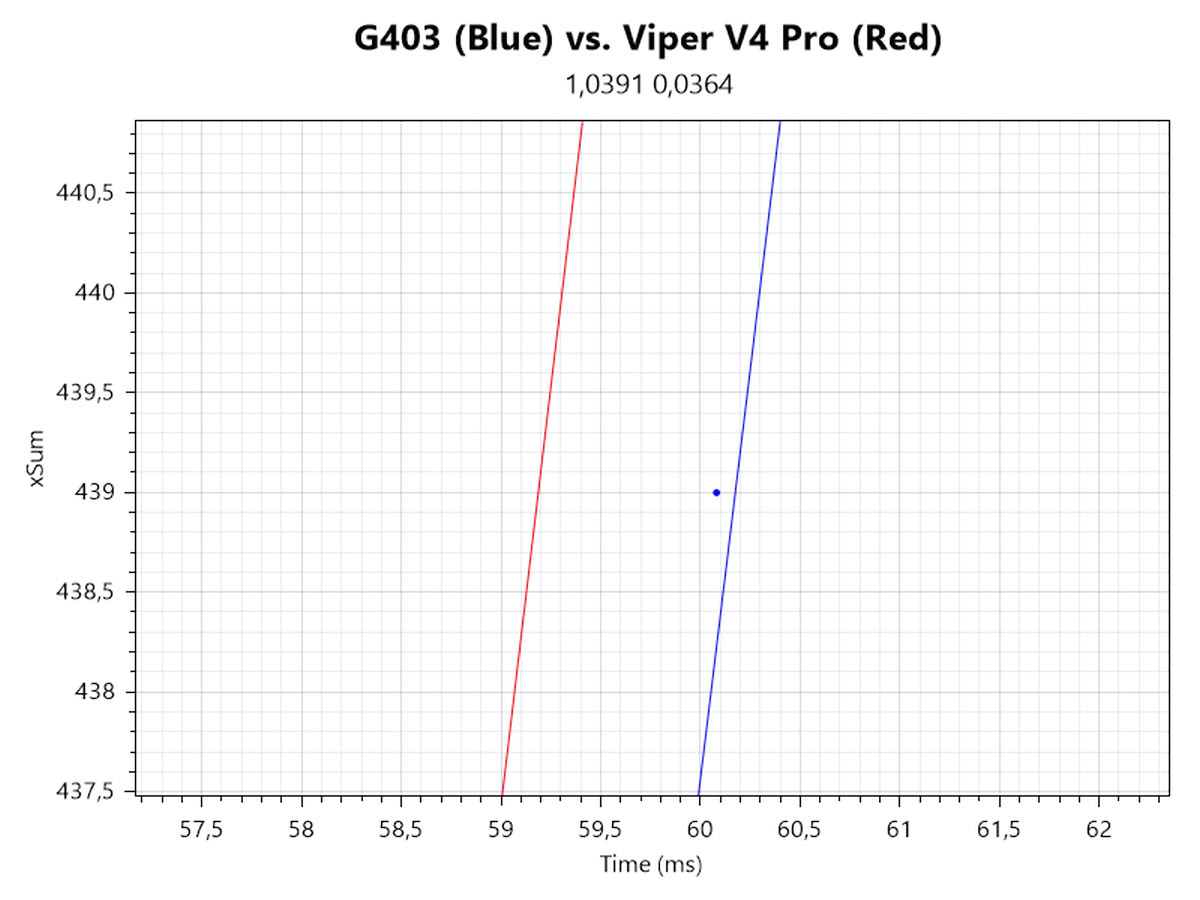
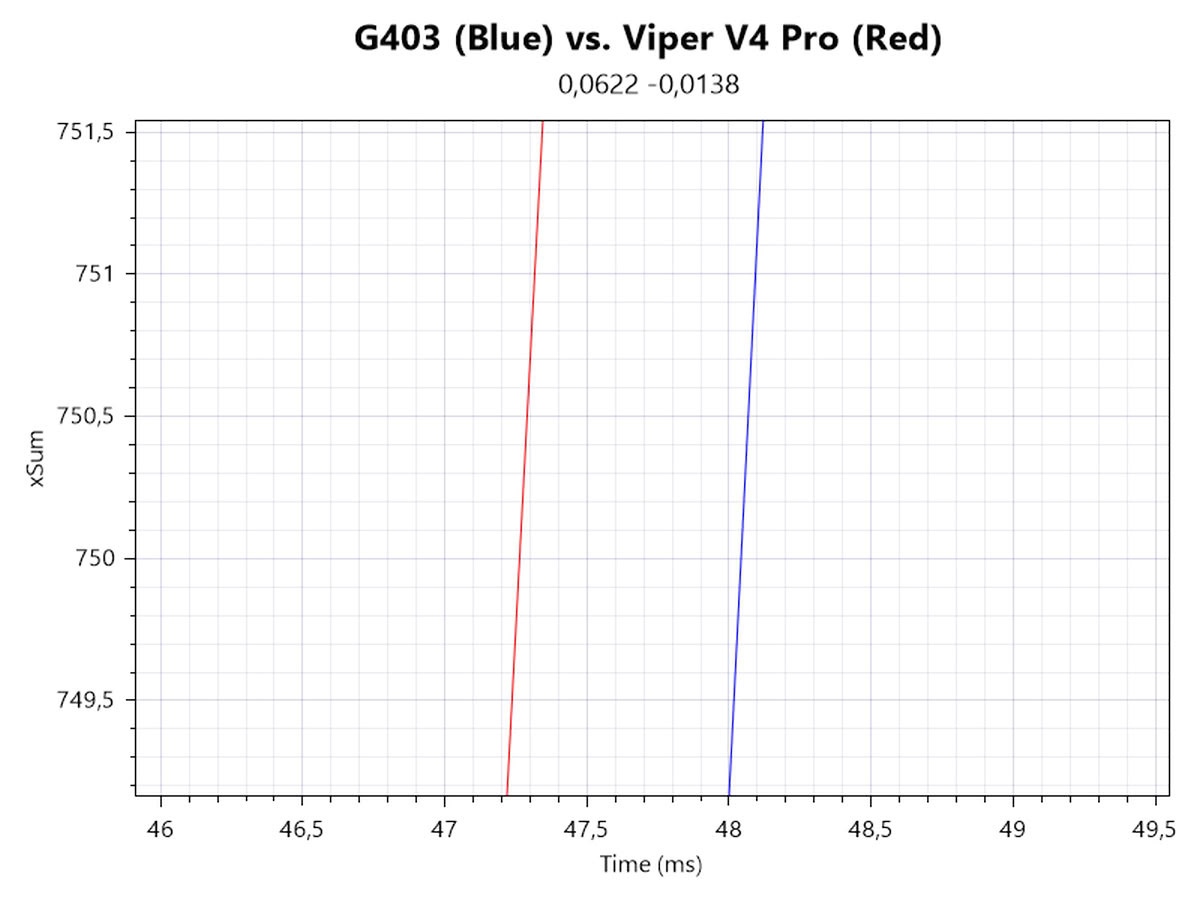
Once again, 1600 and 50,000 CPI are tested. At 1600 CPI, the Viper V4 Pro is ahead by 1.0 ms, whereas at 50,000 CPI, it is ahead by 0.8 ms.
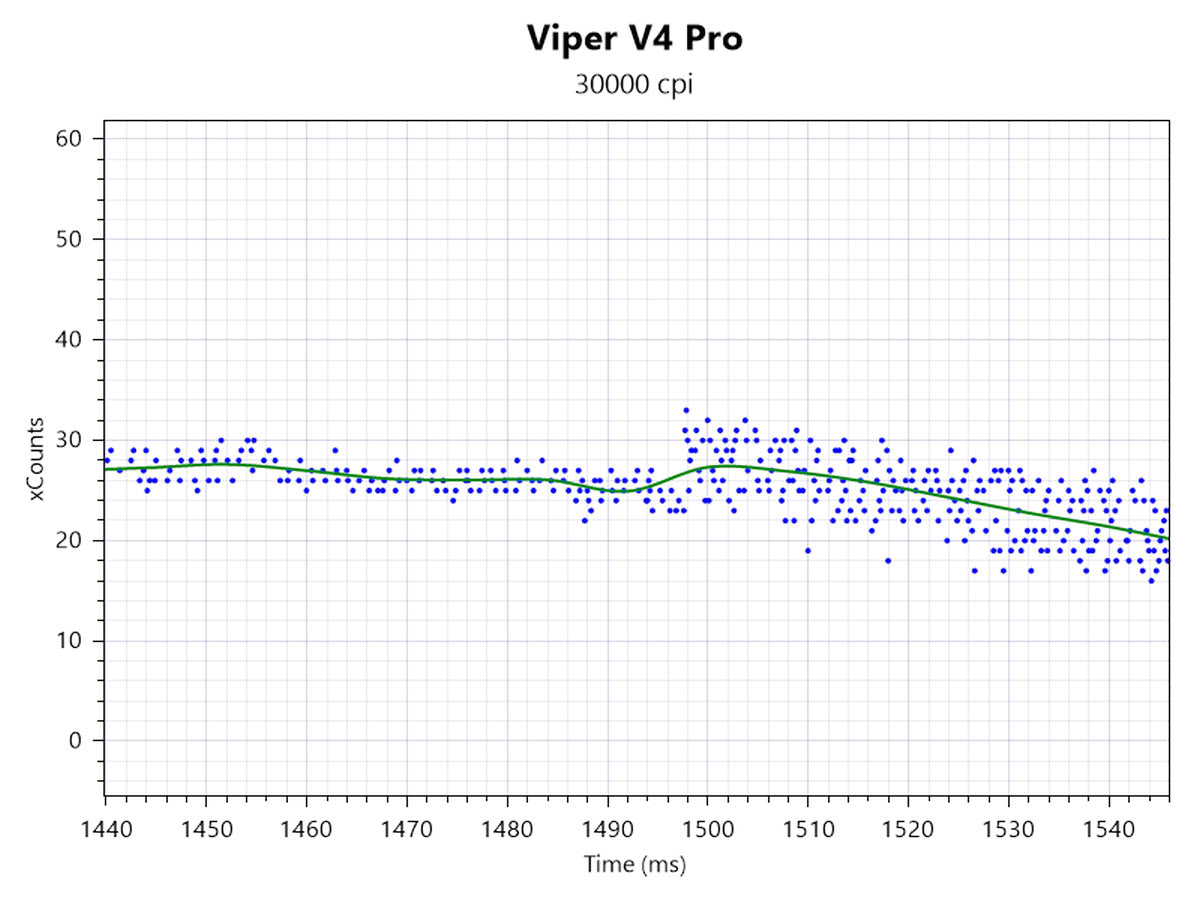
Please note that any assertions regarding smoothing and motion delay only apply if the mouse is already in motion, as when set down after lift-off, the Viper V4 Pro applies a minimum of 2 (conceivably 16) frames of smoothing for the first 1.5 seconds of motion.
Speed-related Accuracy Variance (SRAV)
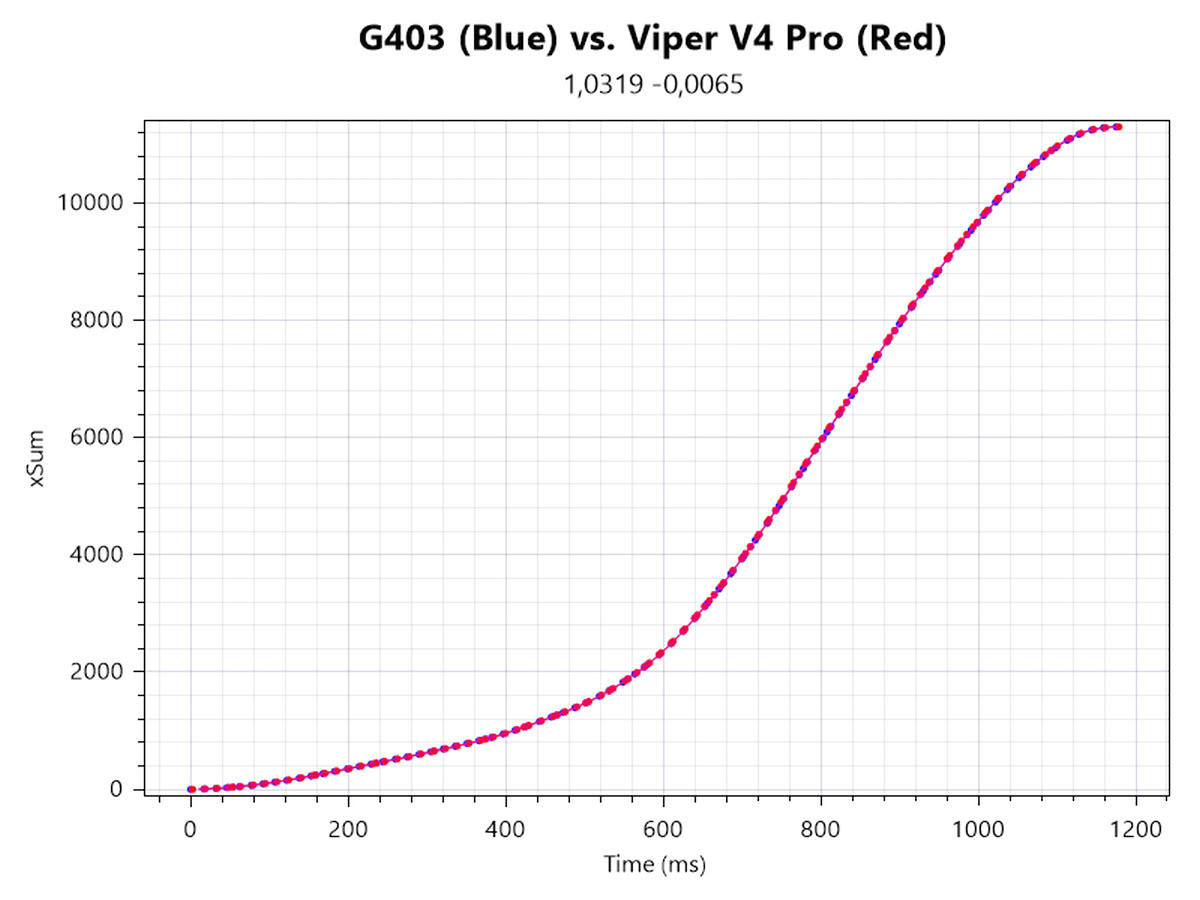
As you can see from the plot, no displacement between the two cursor paths can be observed, which confirms that SRAV is very low.
Perfect Control Speed
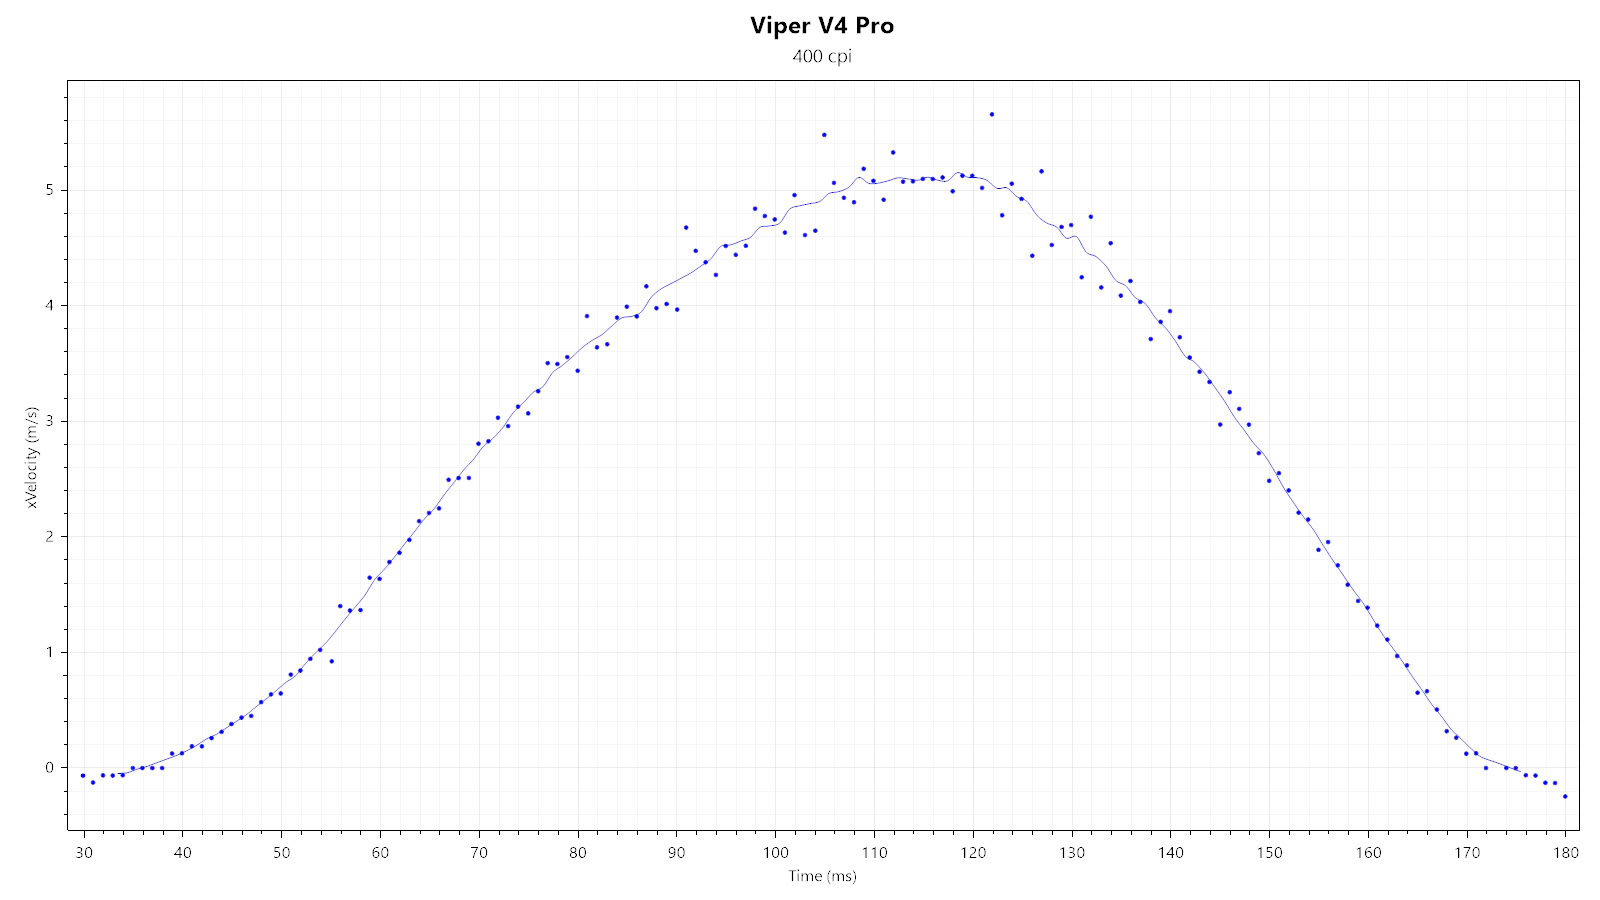
I've only managed to hit a measly 5 m/s, which is within the proclaimed PCS range and causes no observable sensor malfunction.
Polling Rate Stability
Wired testing
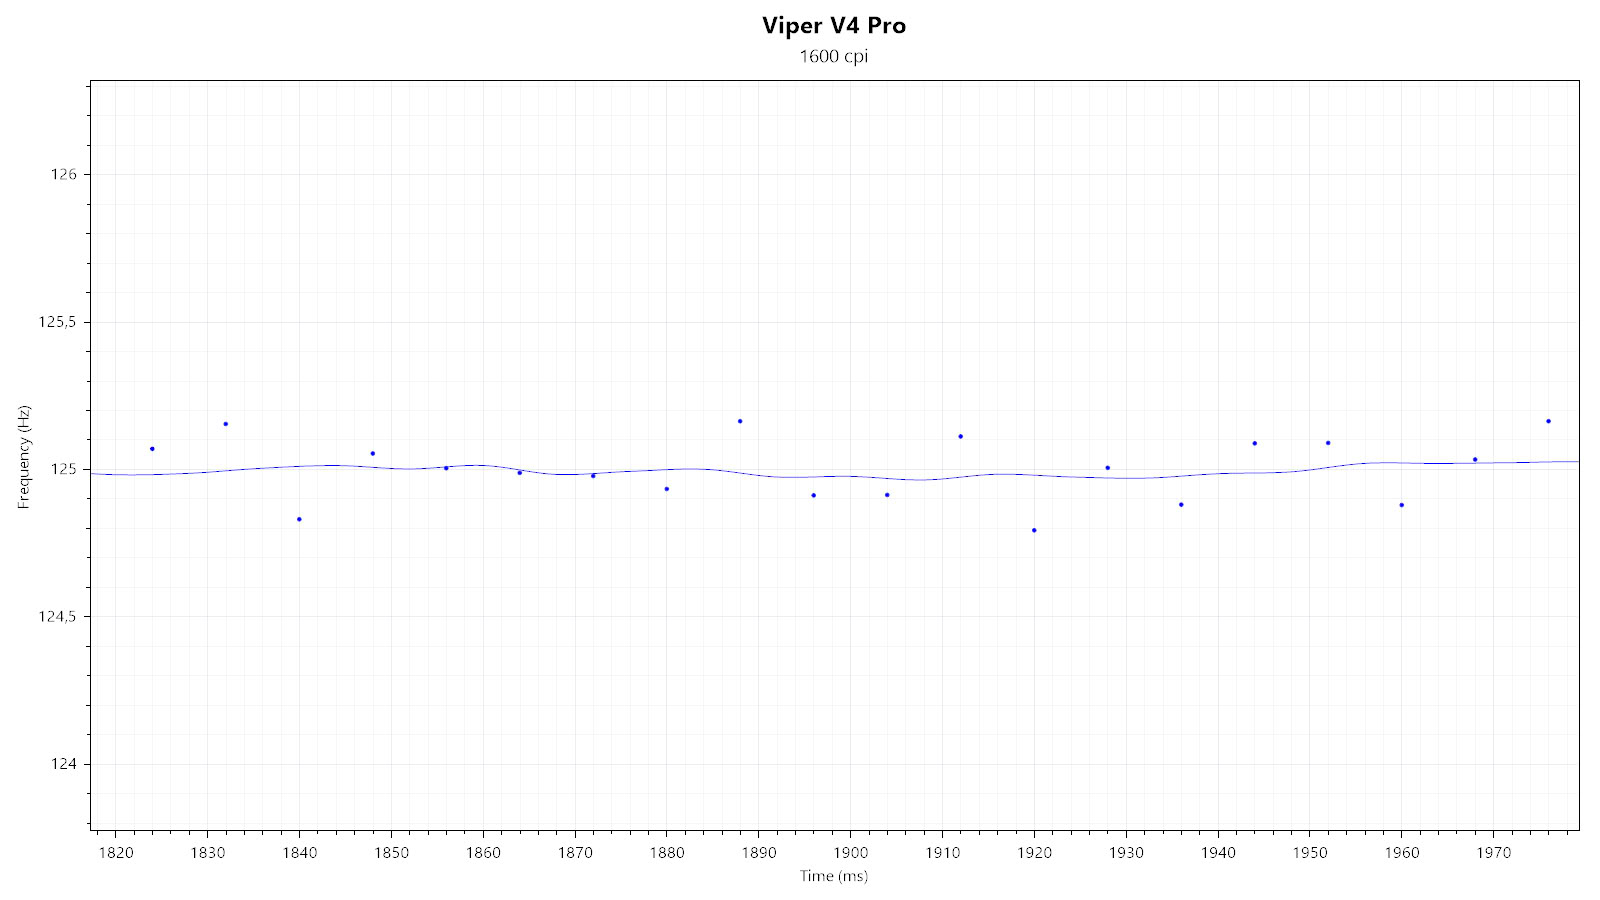
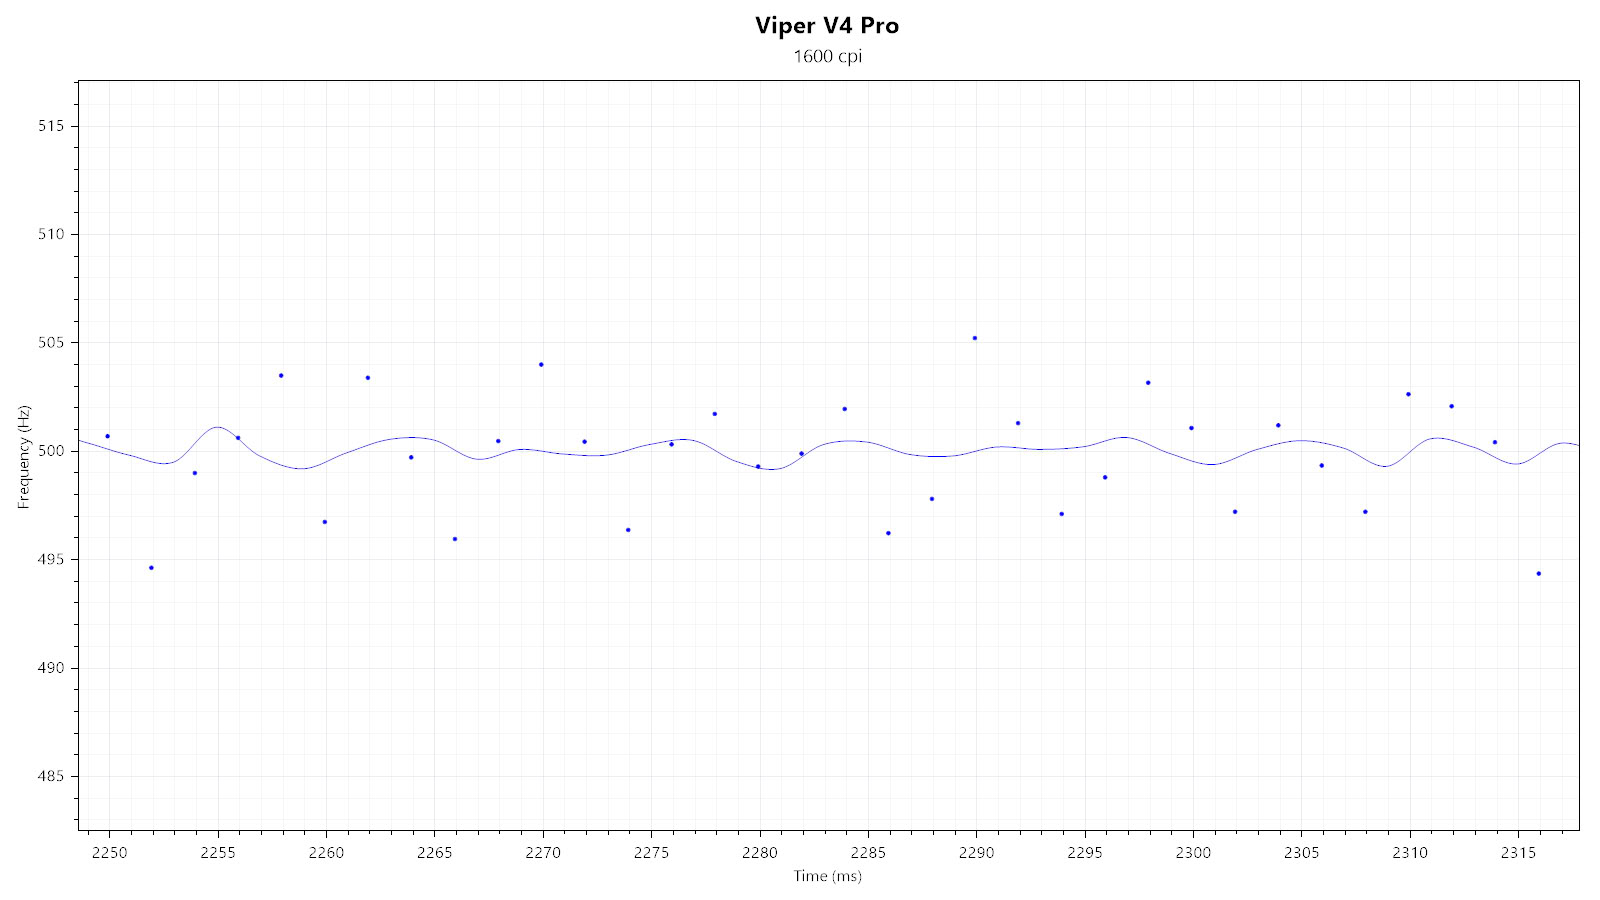
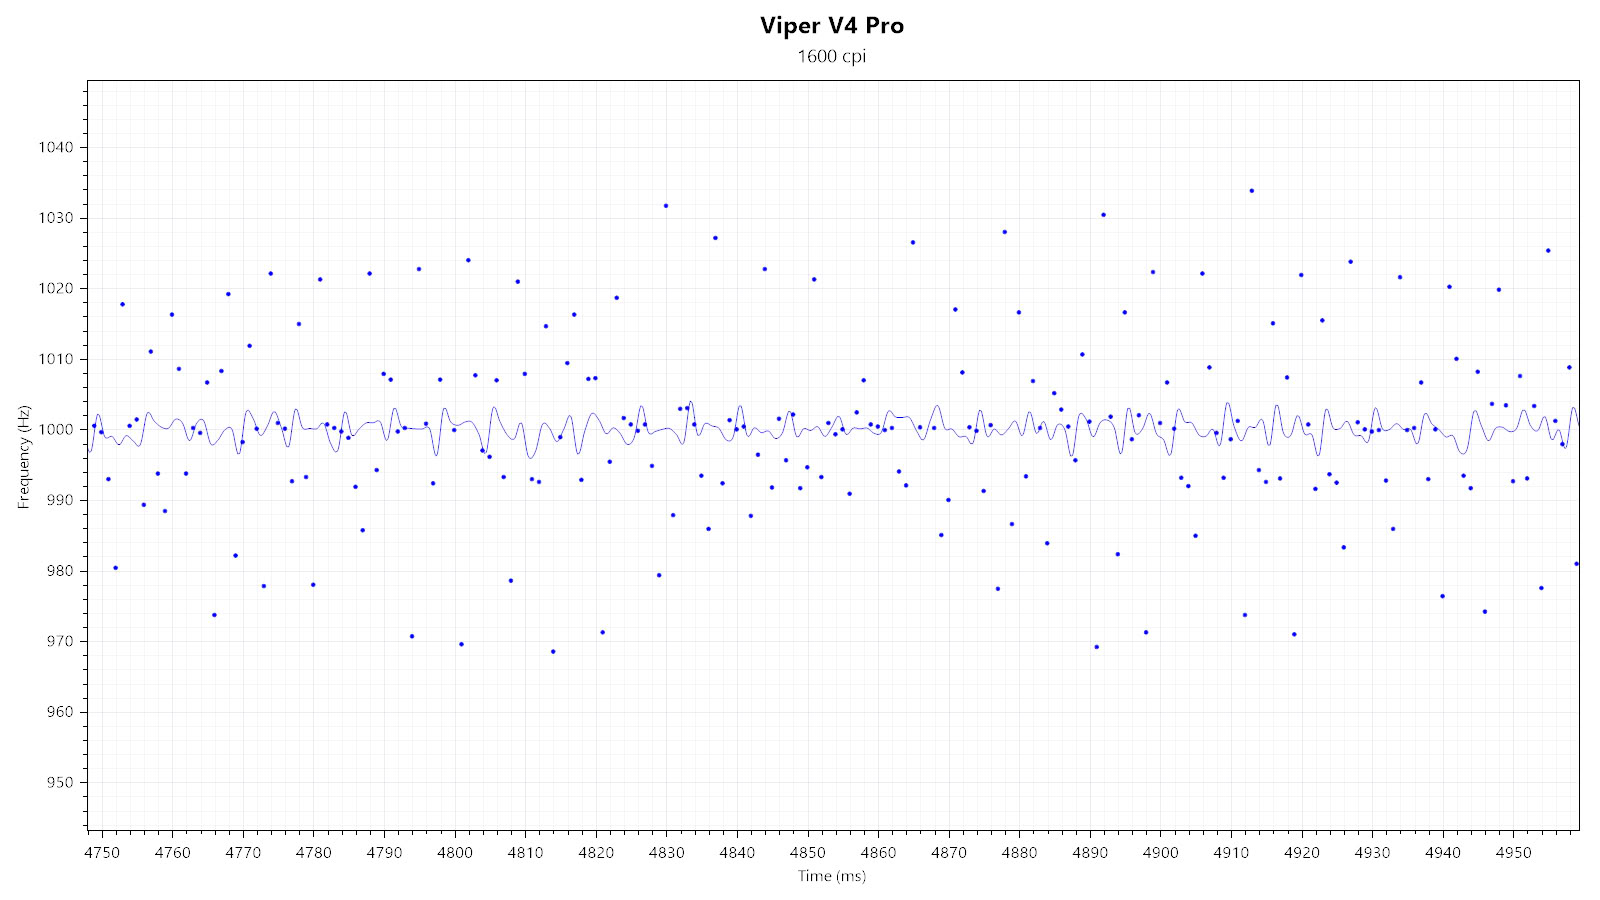
All the available polling rates (125, 500, or 1000 Hz) are stable.
Wireless testing
For wired mice, polling rate stability merely concerns the wired connection between the mouse (SPI communication) and USB. For wireless mice, another device that needs to be kept in sync between the first two is added to the mix: the wireless dongle/wireless receiver. I'm unable to measure all stages of the entire end-to-end signal chain individually, so testing polling-rate stability at the endpoint (the USB) has to suffice here.
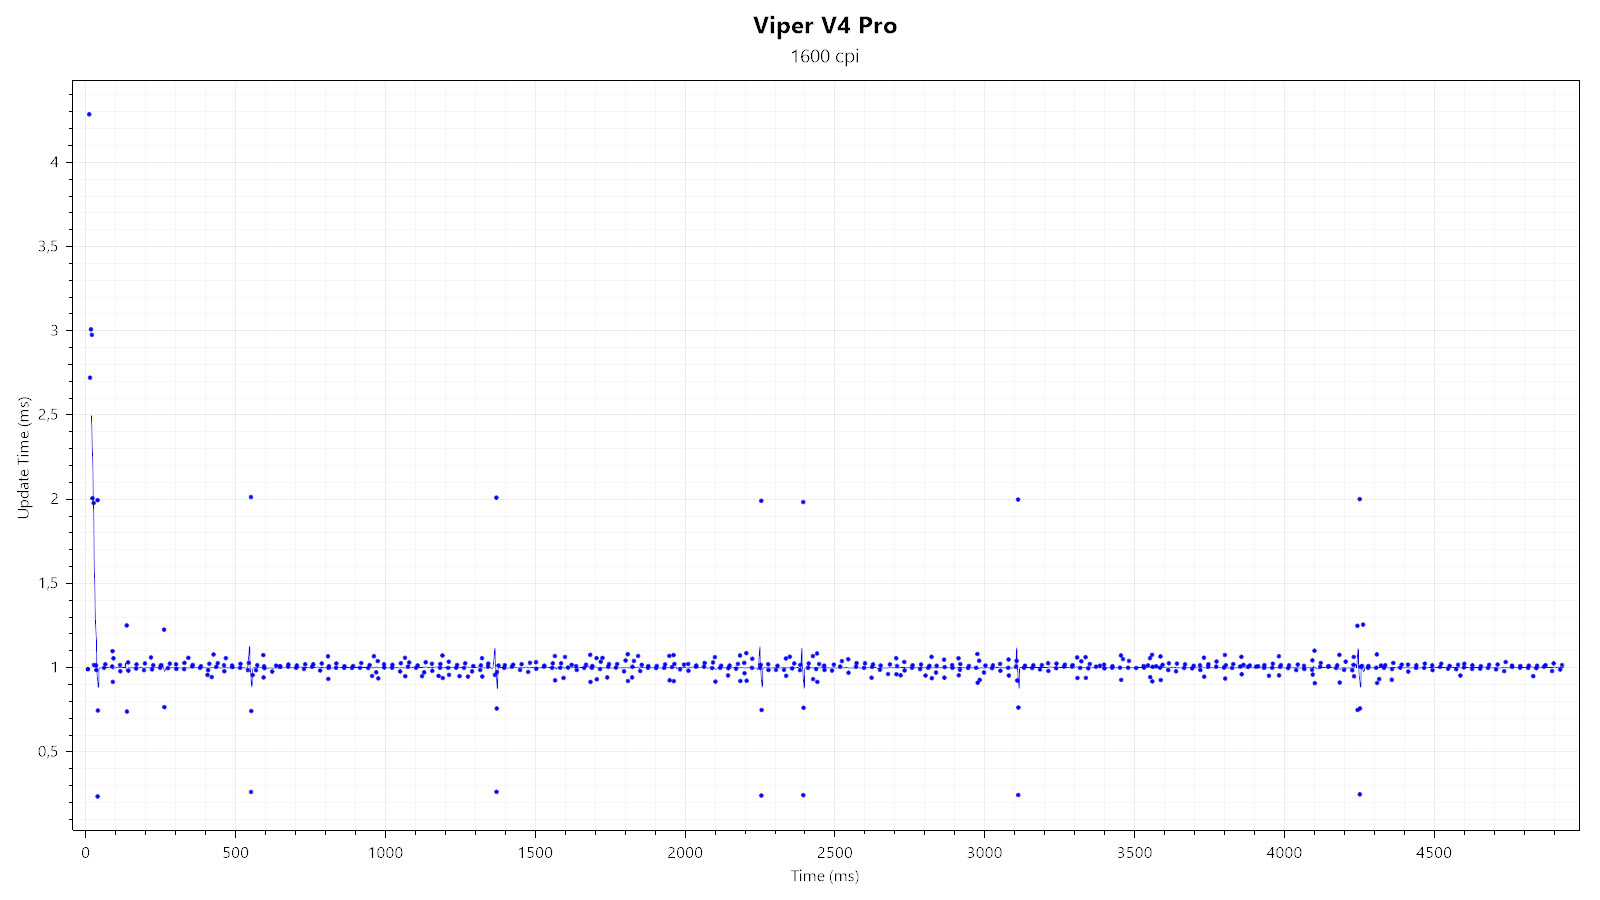
First, I'm testing whether SPI, wireless, and USB communication are synchronized. Any of these being out of sync would be indicated by at least one 2 ms report, which would be the result of any desynchronization drift accumulated over time. I'm unable to detect any periodic off-period polls that would be indicative of a desynchronization drift, though non-periodic ones are common.
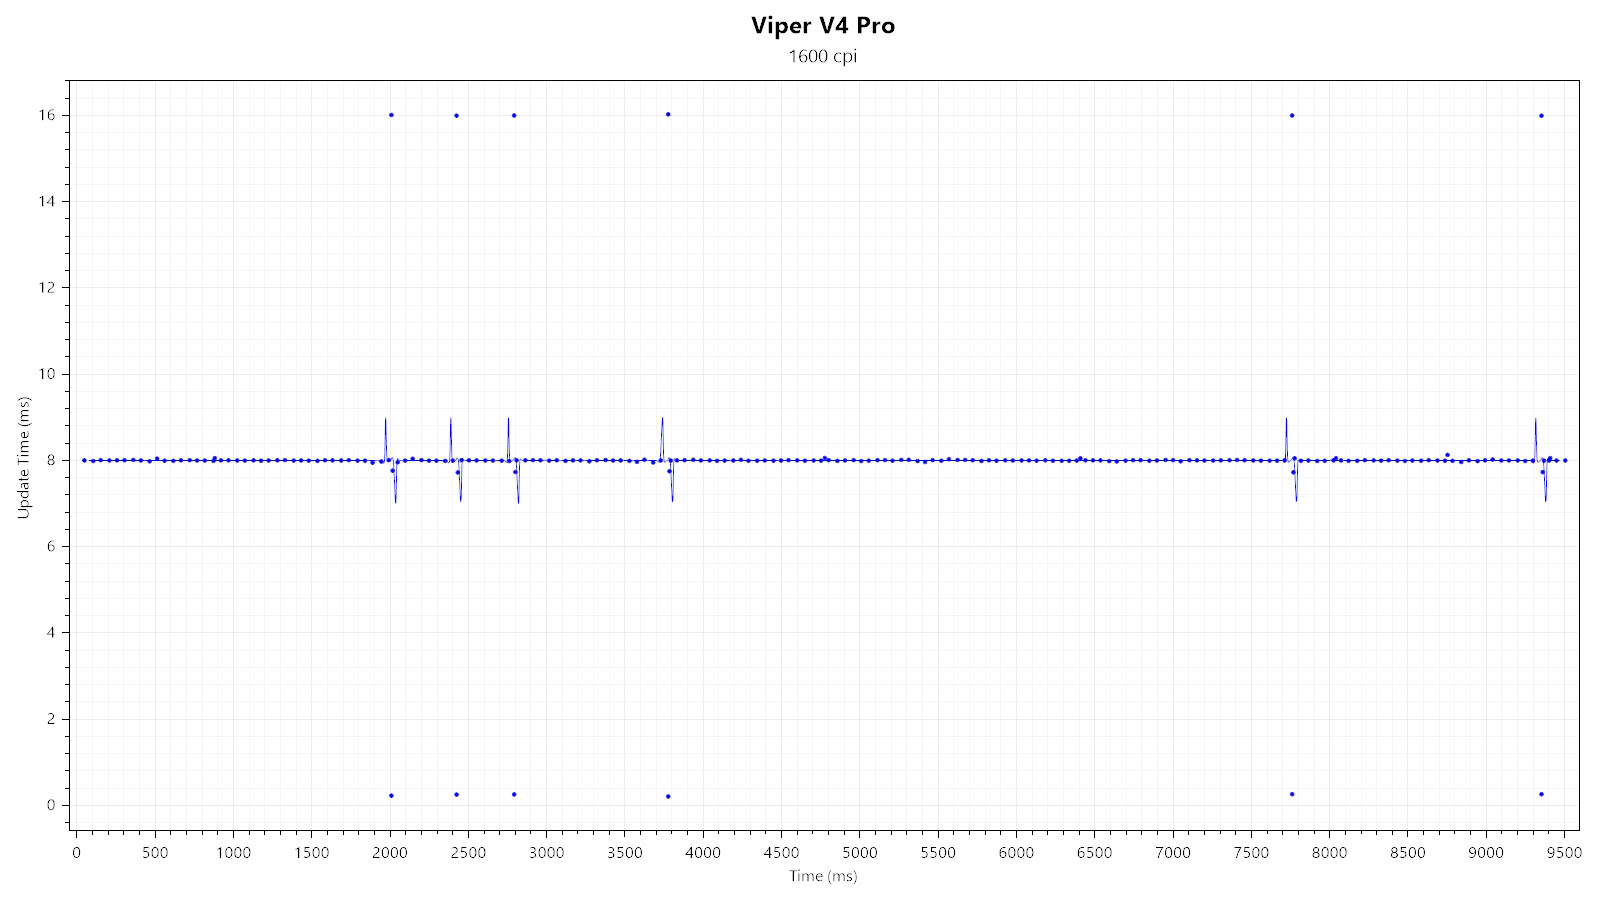
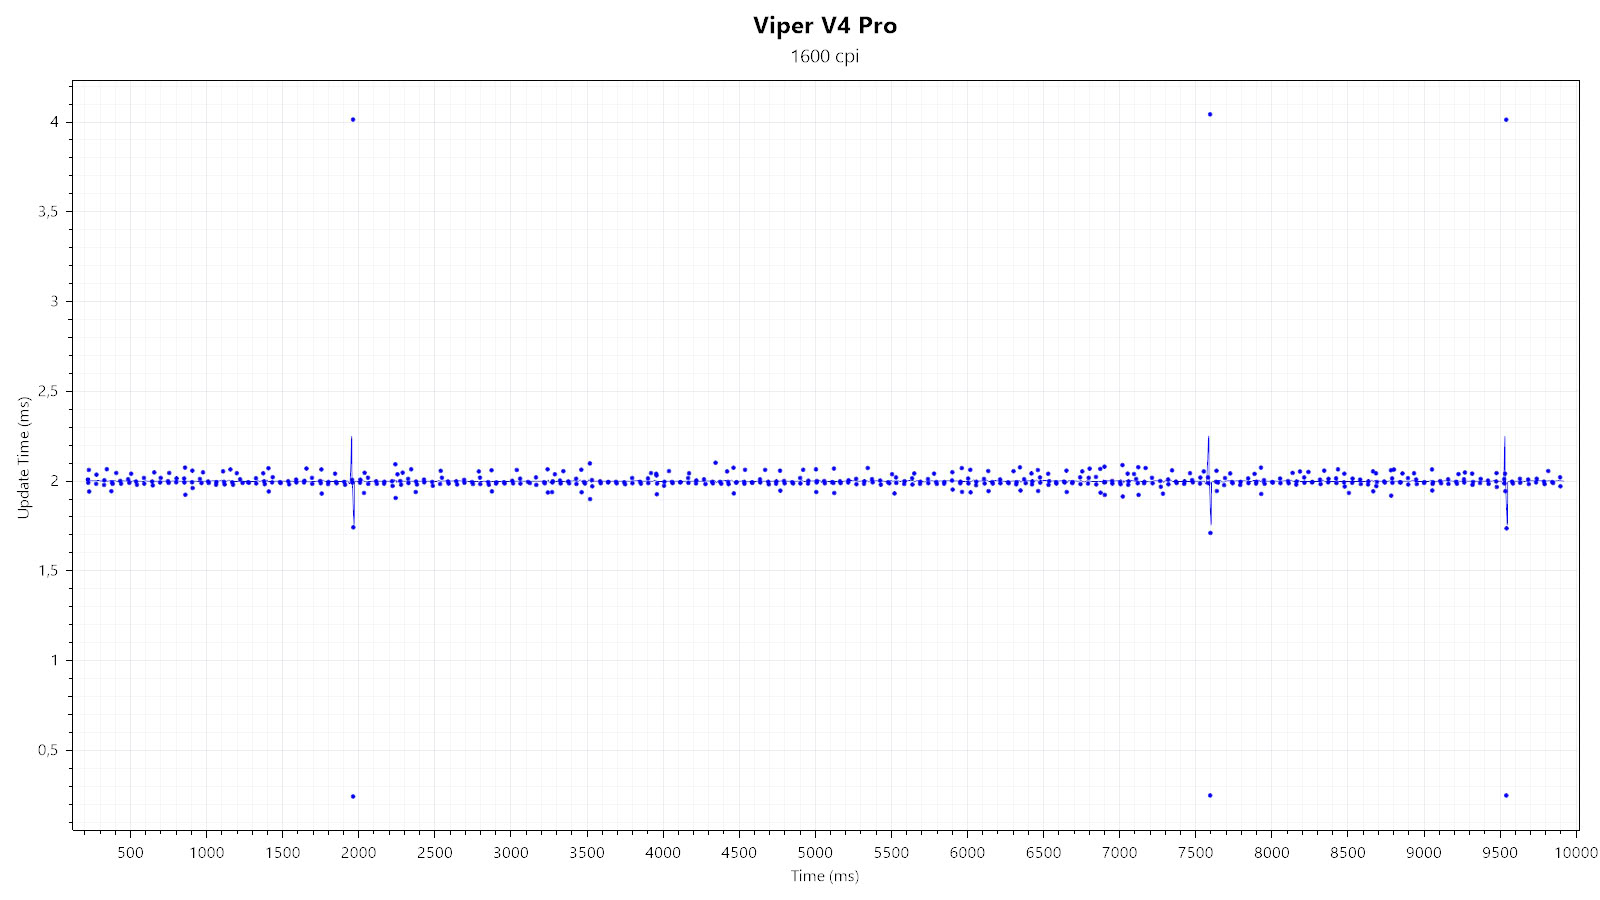
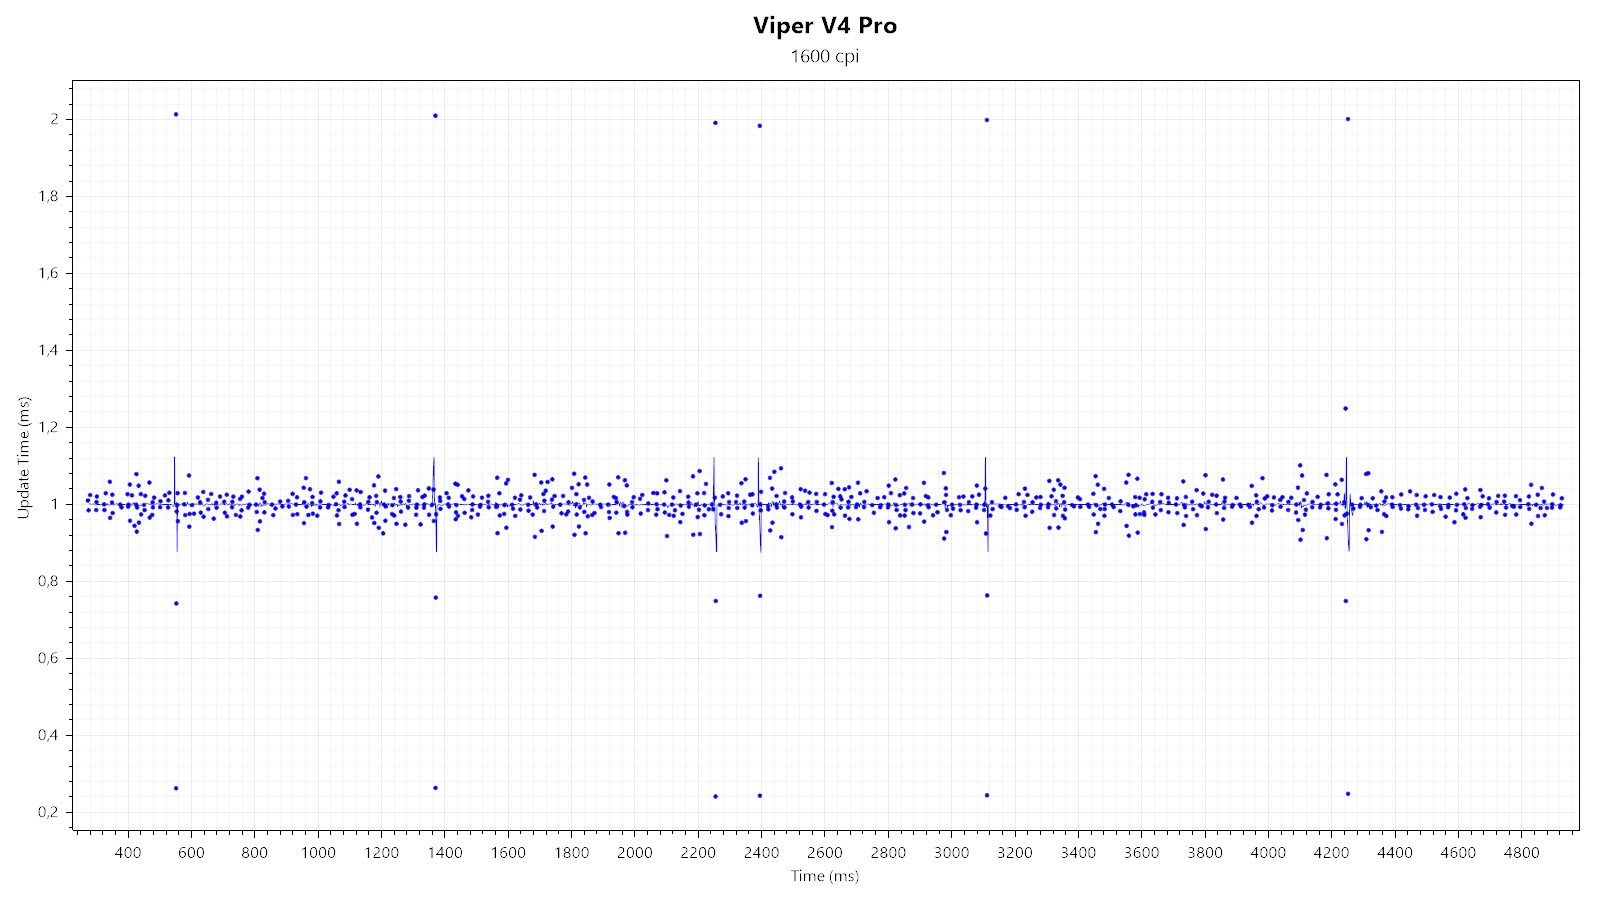
Second, I'm testing the general polling-rate stability of the individual polling rates in wireless mode. Running the Viper V4 Pro at a lower polling rate can have the benefit of extending battery life. All polling rates show non-periodic off-period polls.
Paint Test
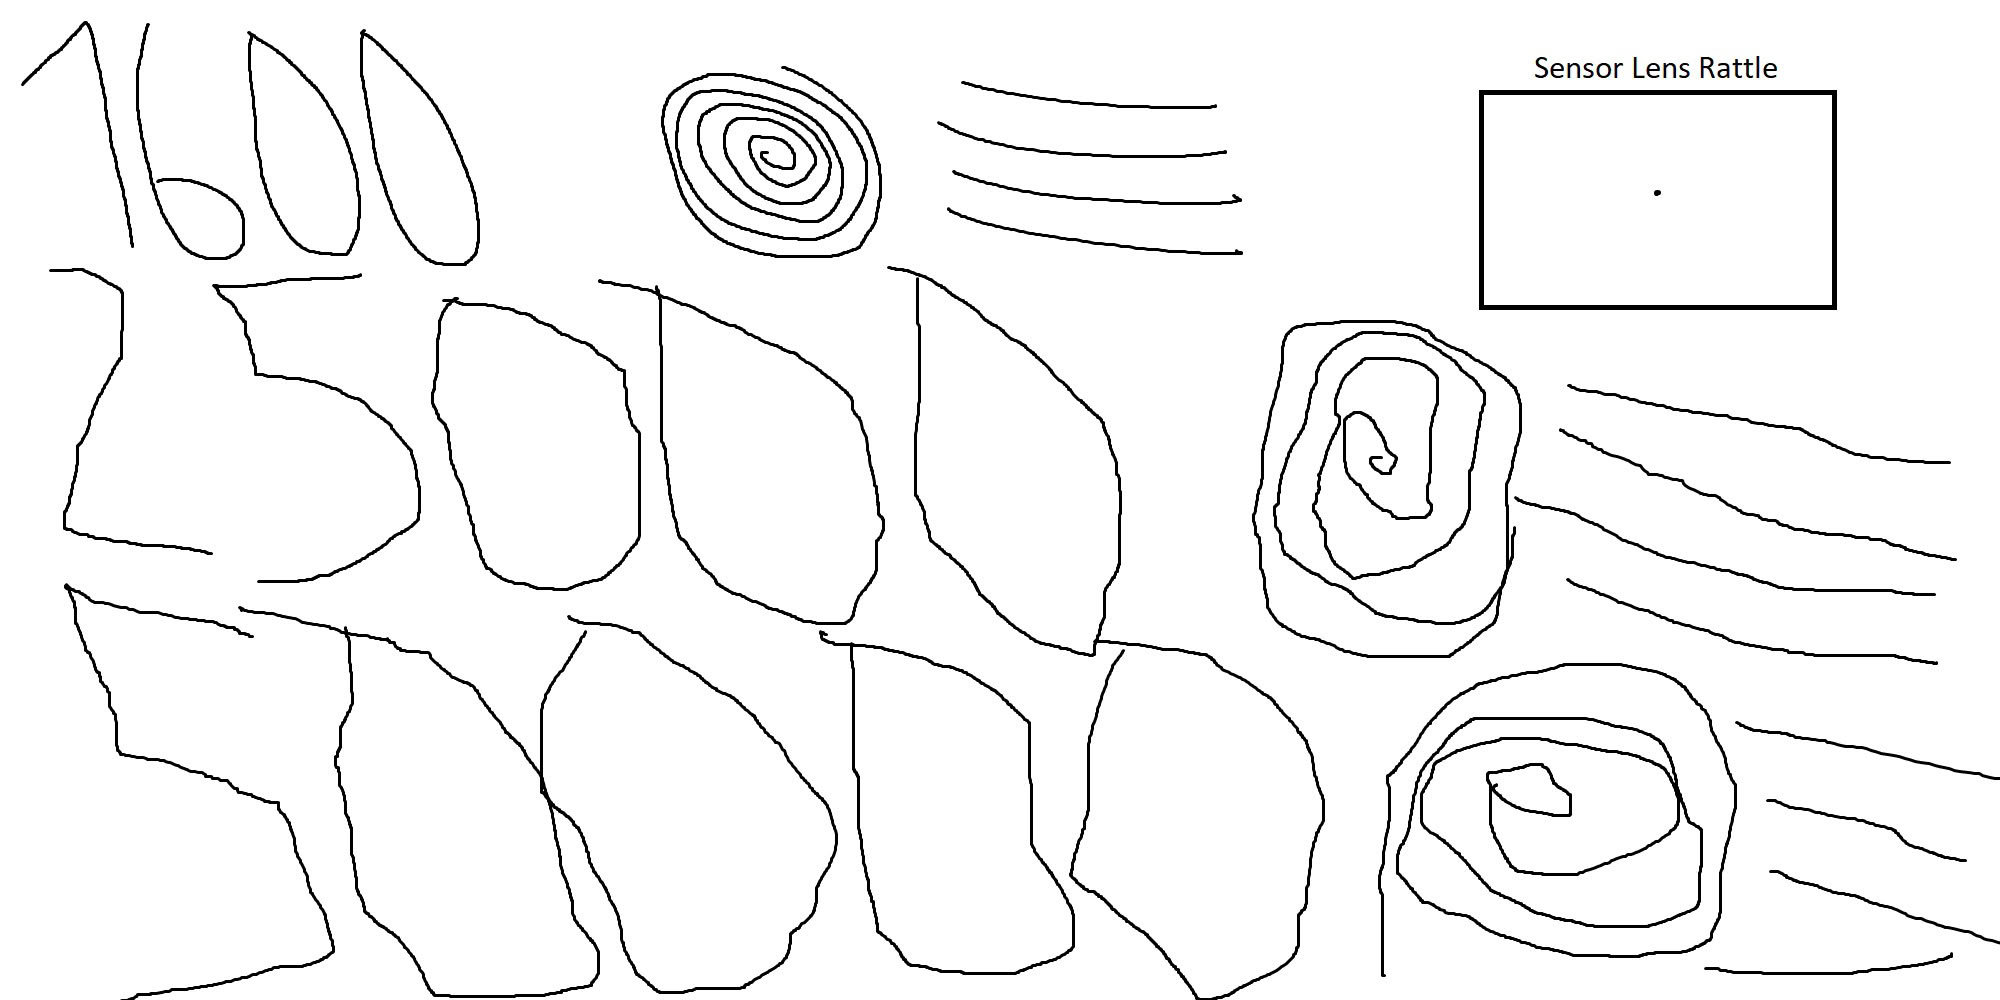
As you can see, no issues with angle snapping can be observed. There is no jitter visible at 1600 CPI. 25,000 CPI shows minor to moderate jitter, which is increased to moderate levels at 50,000 CPI. Lastly, there is no lens movement.
Lift-off Distance
The Viper V4 Pro offers three pre-defined LOD levels. On the "Low" and "Middle" settings, the sensor does not track at a height of one DVD. Using the "High" setting, the sensor does track at a height of one DVD, but not at a height of two DVDs (1.2<x<2.4 mm; x=LOD height). I've been able to confirm through other means that the Low and Middle settings do provide different LOD. Keep in mind that LOD may vary slightly depending on the mousing surface (pad) it is being used on.
Click Latency
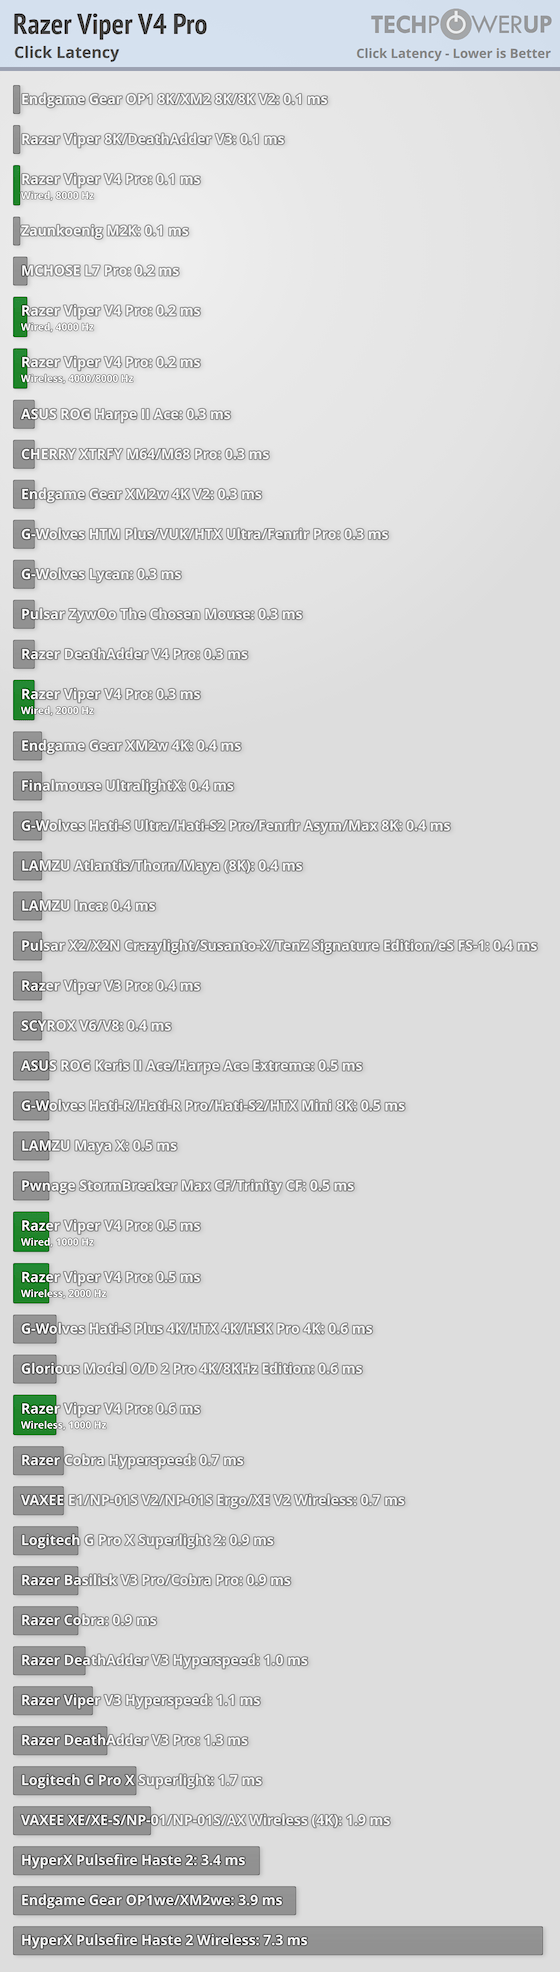
In wired mode and at 1000 Hz, click latency has been measured to be 0.5 (0.46) ms, with standard deviation being 0.17 ms. In wired mode and at 2000 Hz, click latency has been measured to be 0.3 (0.37) ms, with standard deviation being 0.13 ms. In wired mode and at 4000 Hz, click latency has been measured to be 0.2 (0.16) ms, with standard deviation being 0.06 ms. In wired mode and at 8000 Hz, click latency has been measured to be 0.1 (0.08) ms, with standard deviation being 0.02 ms.
In wireless mode and at 1000 Hz, click latency has been measured to be 0.6 (0.57) ms, with standard deviation being 0.25 ms. In wireless mode and at 2000 Hz, click latency has been measured to be 0.5 (0.45) ms, with standard deviation being 0.12 ms. In wireless mode and at 4000 Hz, click latency has been measured to be 0.2 (0.23) ms, with standard deviation being 0.06 ms. In wireless mode and at 8000 Hz, click latency has been measured to be 0.2 (0.20) ms, with standard deviation being 0.02 ms.
Appendix: Sensor Framerate
| Connectivity | Mode | Period (us) | Frequency (Hz) |
|---|---|---|---|
| Wired | Default | 125 | 8000 |
| Wireless | Default (<1K/2K) | 500 | 2000 |
| Default (4K) | 250 | 4000 | |
| Default (8K) | 125 | 8000 |
Nov 14th, 2026 21:03 CST
change timezone
Latest GPU Drivers
New Forum Posts
- Planning for Prolonged High Prices and Maintaining What You Already Have (69)
- Recommendations Wanted - Affordable Enterprise SSD for Boot (2)
- WarpCoreBench scores! (37)
- What can the FX 8320 do today? Here is the answer. (44)
- [INTEL]-How To Update Your Microcode for Intel HX 13/14th Gen. CPUs Laptops/Mobile Easily. (260)
- [Intel AX1xx/AX2xx/AX4xx/AX16xx/BE2xx/BE17xx] Intel Modded Wi-Fi Driver with Intel® Killer™ Features (632)
- Optical Disc Drive owners club (208)
- Game Soundtracks You Love (1287)
- Tell me about your favourite graphics card (80)
- 9070 GRE 3.9ghz validation reached. (11)
Popular Reviews
- AMD Zen 6 Technical Deep Dive
- ASUS ROG Strix B850-I Gaming Wi-Fi7 W Review
- Corsair HX1000i Shift Crystal Review
- Upcoming Hardware Launches 2027 (Updated Nov 2026)
- Montech King 95 3D PRO Review
- NZXT C1200 Platinum Review
- NZXT H7 RGB+ Review
- NZXT H5 Review
- Phantom Blade Zero Performance Benchmark Review - 35 GPUs Tested
- AMD Ryzen 7 9800X3D Review - The Best Gaming Processor
TPU on YouTube
Controversial News Posts
- NVIDIA Co-Founder and CEO Jensen Huang Officially Resigns (407)
- OpenAI CEO Argues Home PCs Waste the World's Limited DRAM Supply (152)
- NVIDIA Launches Investigation Into Jensen Huang's Relationship With Suspected Chinese Spy (136)
- Intel "Raptor Lake Next" 16-Core and 20-Core CPUs Surface (130)
- Legendary Game Studio BioWare Shuts Down Following EA Layoffs (104)
- Dell CEO Says the Memory Shortage Will Get Worse in 2027 (95)
- NVIDIA GeForce RTX 50-Series Scheduled for up to $500 Price Hike This Week (89)
- Modder Fits RTX 5090 With Four 8-Pin Connectors, Halving Current per Wire (80)