 29
29
Corsair RMi Series 1000 W Review
Efficiency, Temperatures & Noise »Test Setup

All measurements were performed using two Chroma 6314A mainframes equipped with the following electronic loads: six 63123A [350 W each], one 63102A [100 W x2], and one 63101A [200 W]. The aforementioned equipment is able to deliver 2500 W of load, and all loads are controlled by a custom-made software. The AC source is a Chroma 6530 capable of delivering up to 3 kW of power. We also used a Rigol DS2072A oscilloscope kindly sponsored by Batronix, a Picoscope 3424 oscilloscope, a Picotech TC-08 thermocouple data logger, two Fluke multimeters (models 289 and 175), a Keithley 2015 THD 6.5 digit bench DMM, and a Yokogawa WT210 power meter. We also included a wooden box, which, along with some heating elements, was used as a hot box and had at our disposal three more oscilloscopes (Rigol VS5042, Stingray DS1M12, and a second Picoscope 3424) and a Class 1 Bruel & Kjaer 2250-L G4 Sound Analyzer we equipped with a type 4189 microphone that features a 16.6-140 dBA-weighted dynamic range. You will find more details about our equipment and the review methodology we follow in this article. We also conduct all of our tests at 40°C-45°C ambient to simulate the environment seen inside a typical system more accurately, with 40°C-45°C being derived from a standard ambient assumption of 23°C and 17°C-22°C being added for the typical temperature rise within a system.
To control the Chroma 6530 source, we use a GPIB-USB controller, which avoids its extra picky Serial port. This controller was kindly provided by Prologix.
Rigol DS2072A kindly provided by: |
 |
Primary Rails Load Regulation
The following charts show the main rails' voltage values, recorded over a range from 60 W to the maximum specified load, and the deviation (in percent) for the same load range.


5VSB Regulation
The following chart shows how the 5VSB rail deals with the load we throw at it.

Hold-up Time
Hold-up time is a very important PSU characteristic and represents the amount of time, usually measured in milliseconds, a PSU can maintain output regulations as defined by the ATX spec without input power. In other words, it is the amount of time the system can continue to run without shutting down or rebooting during a power interruption. The ATX specification sets the minimum hold-up time to 16 ms with the maximum continuous output load. In the following screenshot, the blue line is the mains signal and the yellow line is the "Power Good" signal. The latter is de-asserted to a low state when any of the +12V, 5V, or 3.3V output voltages fall below the undervoltage threshold, or after the mains power has been removed for a sufficiently long time to guarantee that the PSU cannot operate anymore.

The RM1000i registered the highest hold-up time of all competiting1 kW units, which shows that Corsair takes hold-up-time performance seriously.
Inrush Current
Inrush current or switch-on surge refers to the maximum, instantaneous input-current drawn by an electrical device when it is first turned on. Because of the charging current of the APFC capacitor(s), PSUs produce large inrush-current right as they are turned on. Large inrush current can cause the tripping of circuit breakers and fuses and may also damage switches, relays, and bridge rectifiers; as a result, the lower a PSU's inrush current right as it is turned on, the better.
Easily surpassing the 16 ms hold-up-time threshold, inrush current was close to what we expected from a 1 kW unit.
Load Regulation and Efficiency Measurements
The first set of tests revealed the stability of the voltage rails and the RM1000i's efficiency. The applied load was equal to (approximately) 10%-110% of the maximum load the PSU can handle, in 10% steps.We conducted two additional tests. In the first test, we stressed the two minor rails (5V and 3.3V) with a high load while the load at +12V was only 0.10 A. This test reveals whether the PSU is Haswell ready or not. In the second test, we dialed the maximum load the +12V rail can handle, all while the load on the minor rails was minimal.
| Load Regulation & Efficiency Testing Data - Corsair RM1000i | ||||||||||
|---|---|---|---|---|---|---|---|---|---|---|
| Test | 12 V | 5 V | 3.3 V | 5VSB | Power (DC/AC) | Efficiency | Fan Speed | Fan Noise | Temp (In/Out) | PF/AC Volts |
| 10% Load | 6.484A | 1.983A | 1.985A | 0.991A | 99.77W | 88.95% | 0 RPM | 0 dBA | 47.12°C | 0.865 |
| 12.059V | 5.043V | 3.323V | 5.026V | 112.17W | 42.69°C | 229.8V | ||||
| 20% Load | 14.012A | 2.968A | 2.978A | 1.192A | 199.65W | 92.32% | 0 RPM | 0 dBA | 47.52°C | 0.955 |
| 12.047V | 5.042V | 3.322V | 5.023V | 216.26W | 42.53°C | 230.1V | ||||
| 30% Load | 21.921A | 3.475A | 3.491A | 1.393A | 299.89W | 93.17% | 0 RPM | 0 dBA | 48.29°C | 0.977 |
| 12.034V | 5.039V | 3.320V | 5.018V | 321.89W | 43.04°C | 230.0V | ||||
| 40% Load | 29.823A | 3.967A | 3.974A | 1.594A | 399.64W | 93.35% | 0 RPM | 0 dBA | 49.53°C | 0.984 |
| 12.020V | 5.038V | 3.319V | 5.014V | 428.12W | 43.99°C | 230.0V | ||||
| 50% Load | 37.412A | 4.967A | 4.972A | 1.794A | 499.71W | 93.18% | 0 RPM | 0 dBA | 52.01°C | 0.988 |
| 12.007V | 5.037V | 3.318V | 5.012V | 536.28W | 44.91°C | 230.0V | ||||
| 60% Load | 45.012A | 5.957A | 5.972A | 1.995A | 599.60W | 92.85% | 564 RPM | 23.5 dBA | 40.93°C | 0.992 |
| 11.993V | 5.034V | 3.315V | 5.006V | 645.75W | 46.17°C | 230.0V | ||||
| 70% Load | 52.639A | 6.961A | 6.975A | 2.200A | 699.61W | 92.36% | 784 RPM | 30.3 dBA | 41.97°C | 0.994 |
| 11.978V | 5.028V | 3.312V | 4.999V | 757.45W | 47.44°C | 230.0V | ||||
| 80% Load | 60.264A | 7.957A | 7.978A | 2.401A | 799.44W | 91.87% | 896 RPM | 33.3 dBA | 43.32°C | 0.995 |
| 11.965V | 5.025V | 3.310V | 4.994V | 870.15W | 49.25°C | 230.0V | ||||
| 90% Load | 68.357A | 8.464A | 8.496A | 2.400A | 899.54W | 91.40% | 1184 RPM | 41.4 dBA | 45.47°C | 0.996 |
| 11.951V | 5.023V | 3.308V | 4.994V | 984.20W | 51.77°C | 230.0V | ||||
| 100% Load | 76.200A | 8.963A | 8.984A | 3.008A | 999.29W | 90.73% | 1448 RPM | 45.1 dBA | 48.04°C | 0.996 |
| 11.937V | 5.021V | 3.306V | 4.982V | 1101.45W | 54.74°C | 230.0V | ||||
| 110% Load | 84.668A | 8.965A | 8.986A | 3.010A | 1099.19W | 90.01% | 1552 RPM | 46.0 dBA | 48.25°C | 0.996 |
| 11.923V | 5.020V | 3.305V | 4.981V | 1221.15W | 55.29°C | 230.0V | ||||
| Crossload 1 | 0.101A | 18.022A | 18.003A | 0.004A | 151.53W | 84.25% | 864 RPM | 32.8 dBA | 44.63°C | 0.938 |
| 12.046V | 5.031V | 3.312V | 5.075V | 179.86W | 49.61°C | 230.1V | ||||
| Crossload 2 | 83.259A | 1.002A | 1.003A | 1.002A | 1007.42W | 91.06% | 1395 RPM | 44.8 dBA | 45.76°C | 0.996 |
| 11.939V | 5.031V | 3.316V | 5.016V | 1106.30W | 52.14°C | 230.0V | ||||
Corsair Link Screenshots
Several screenshots of the Corsair Link software, which we took during our test sessions, follow. The order of these screenshots is the same as the order of the tests in the table above (10% load to Cross-load 2 test).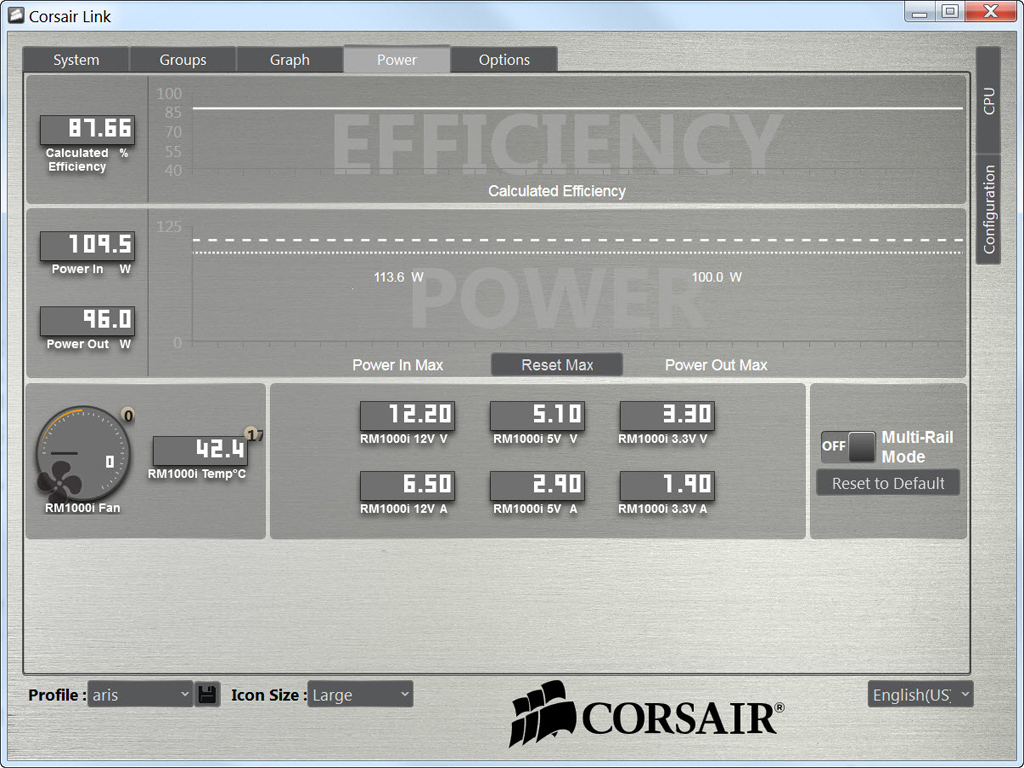


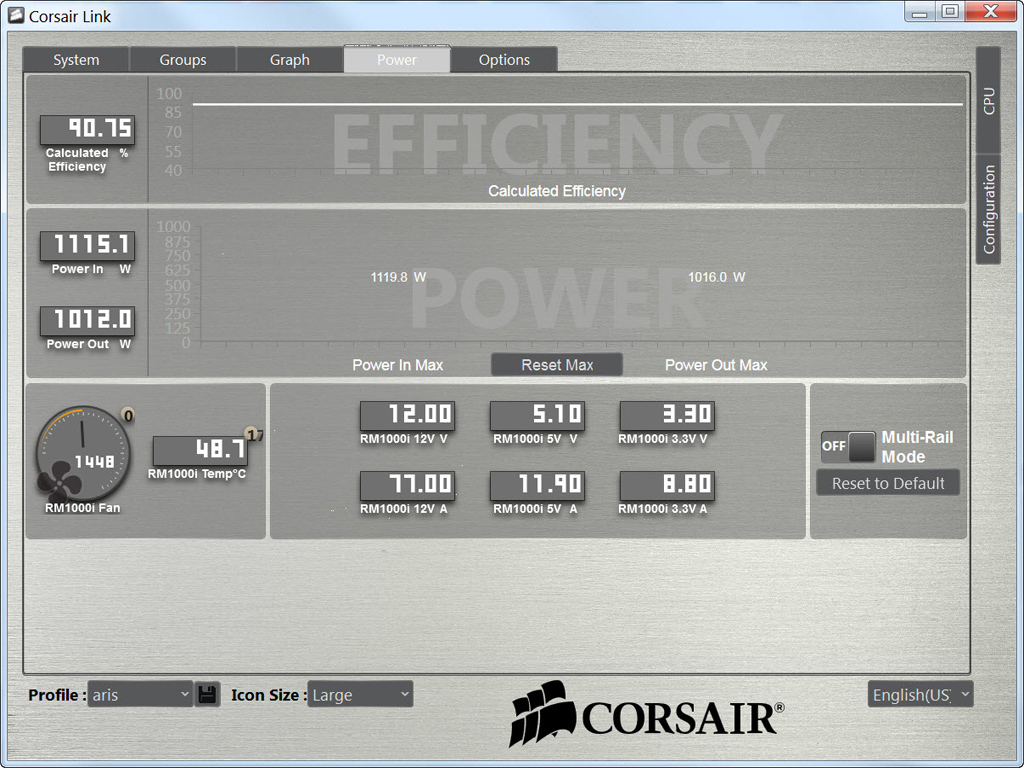


Efficiency readings in all but the CL1 test were close to those we measured with our lab-grade power analyzer. That said, voltage readings at especially +12V weren't too accurate.
Jul 29th, 2025 23:02 CDT
change timezone
Latest GPU Drivers
New Forum Posts
- RX6800XT Gigabyte Gaming OC not giving image while being on "OC" switch and even sometimes while being on "silent" switch. (7)
- I stop using Windows as my main OS for like 4+ years (3)
- 3DMARK "LEGENDARY" (344)
- What's your latest tech purchase? (24396)
- LCD IPS display (10)
- Windows 10 Vs 11, Which one to choose? (262)
- Post your JetStream 2 speeds! (167)
- Post your 7-Zip v22.01 scores (436)
- Browser Bechmark scores (115)
- SunSpider 1.0 JavaScript benchmark results (34)
Popular Reviews
- Herman Miller Logitech G Embody Review - No Pain, No Gain
- Lenovo Legion 5i (15IRX10) Review - Feature-Rich and Wallet Friendly
- MSI Claw 8 AI+ A2VM Review
- Lian Li O11 Dynamic Mini V2 Review
- Upcoming Hardware Launches 2025 (Updated May 2025)
- Noctua NF-A12x25 G2 PWM Fan Review
- Sapphire Radeon RX 9060 XT Pulse OC 16 GB Review - An Excellent Choice
- AMD Ryzen 7 9800X3D Review - The Best Gaming Processor
- AQIRYS Sirius Pro Review
- NVIDIA GeForce RTX 5050 8 GB Review
TPU on YouTube
Controversial News Posts
- AMD's Upcoming UDNA / RDNA 5 GPU Could Feature 96 CUs and 384-bit Memory Bus (134)
- AMD Radeon RX 9070 XT Gains 9% Performance at 1440p with Latest Driver, Beats RTX 5070 Ti (131)
- NVIDIA GeForce RTX 5080 SUPER Could Feature 24 GB Memory, Increased Power Limits (115)
- Intel "Nova Lake-S" Core Ultra 3, Ultra 5, Ultra 7, and Ultra 9 Core Configurations Surface (110)
- DDR6 Memory Arrives in 2027 with 8,800-17,600 MT/s Speeds (101)
- AMD Sampling Next-Gen Ryzen Desktop "Medusa Ridge," Sees Incremental IPC Upgrade, New cIOD (97)
- Intel CEO Confirms SMT To Return to Future CPUs (95)
- NVIDIA Becomes First Company Ever to Hit $4 Trillion Market-Cap (94)