Wednesday, December 26th 2018

Version 4.6.0 Beta 10 of MSI Afterburner Introduces OC Scanner for Pascal
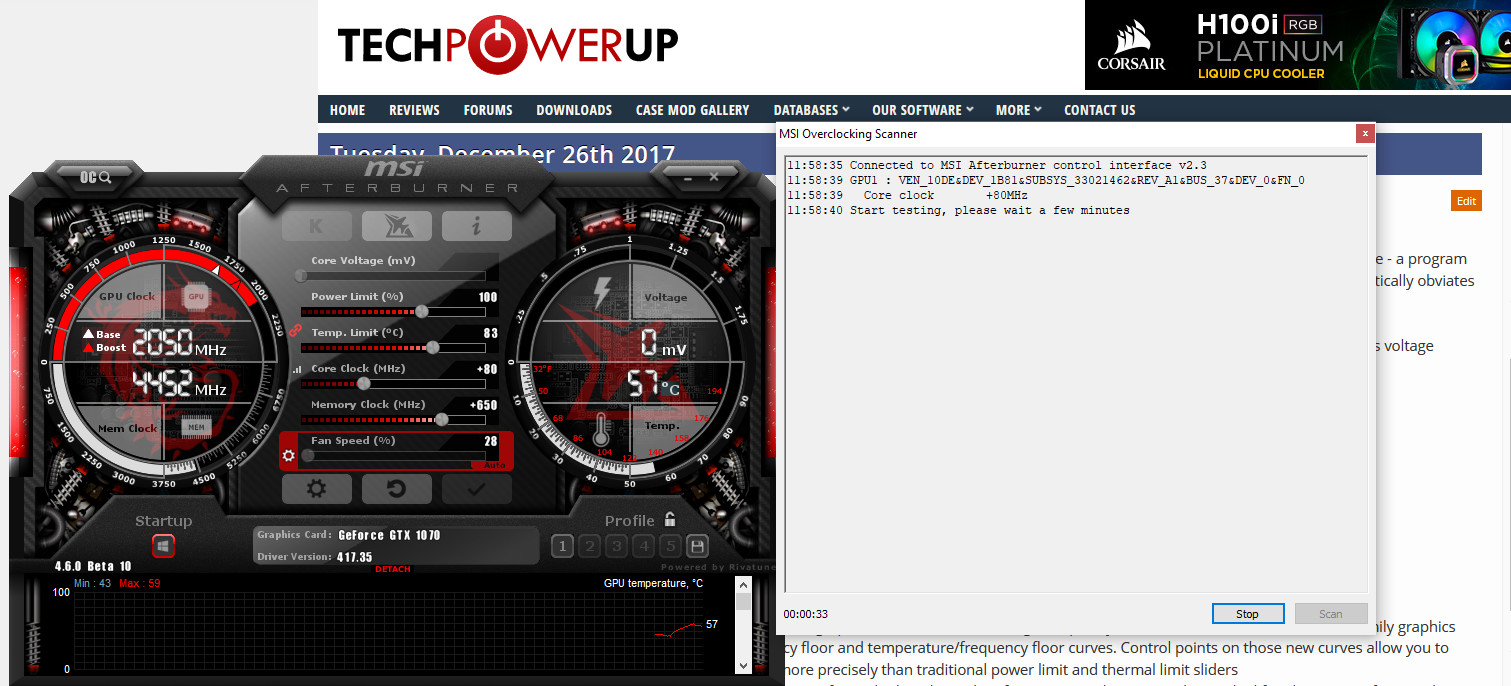
One of the runaway features for NVIDIA's latest RTX-20 series of graphics cards was the introduction of support for the OC Scanner feature - a program that automagically tests a range of frequencies on your NVIDIA graphics card and overclocks it to a deemed "stable" sweet-spot. This practically obviates the need for manual fine-tuning, though of course, the best results should always be found down that road - provided there's enough tinkering.
The latest version of MSI's Afterburner (v4.6.0 beta 10, available in the source link) now brings this functionality to Pascal-based graphics cards (besides some other features, such as voltage control, for Turing; check the entire release notes after the break). Have fun.


 MSI AB v4.6.0 beta 10
Sources:
WCCFTech, Afterburner 4.6.0 beta 10 Download
The latest version of MSI's Afterburner (v4.6.0 beta 10, available in the source link) now brings this functionality to Pascal-based graphics cards (besides some other features, such as voltage control, for Turing; check the entire release notes after the break). Have fun.


- Added NVIDIA Turing GPU architecture support:
- Added voltage control for reference design NVIDIA GeForce RTX 20×0 series graphics cards
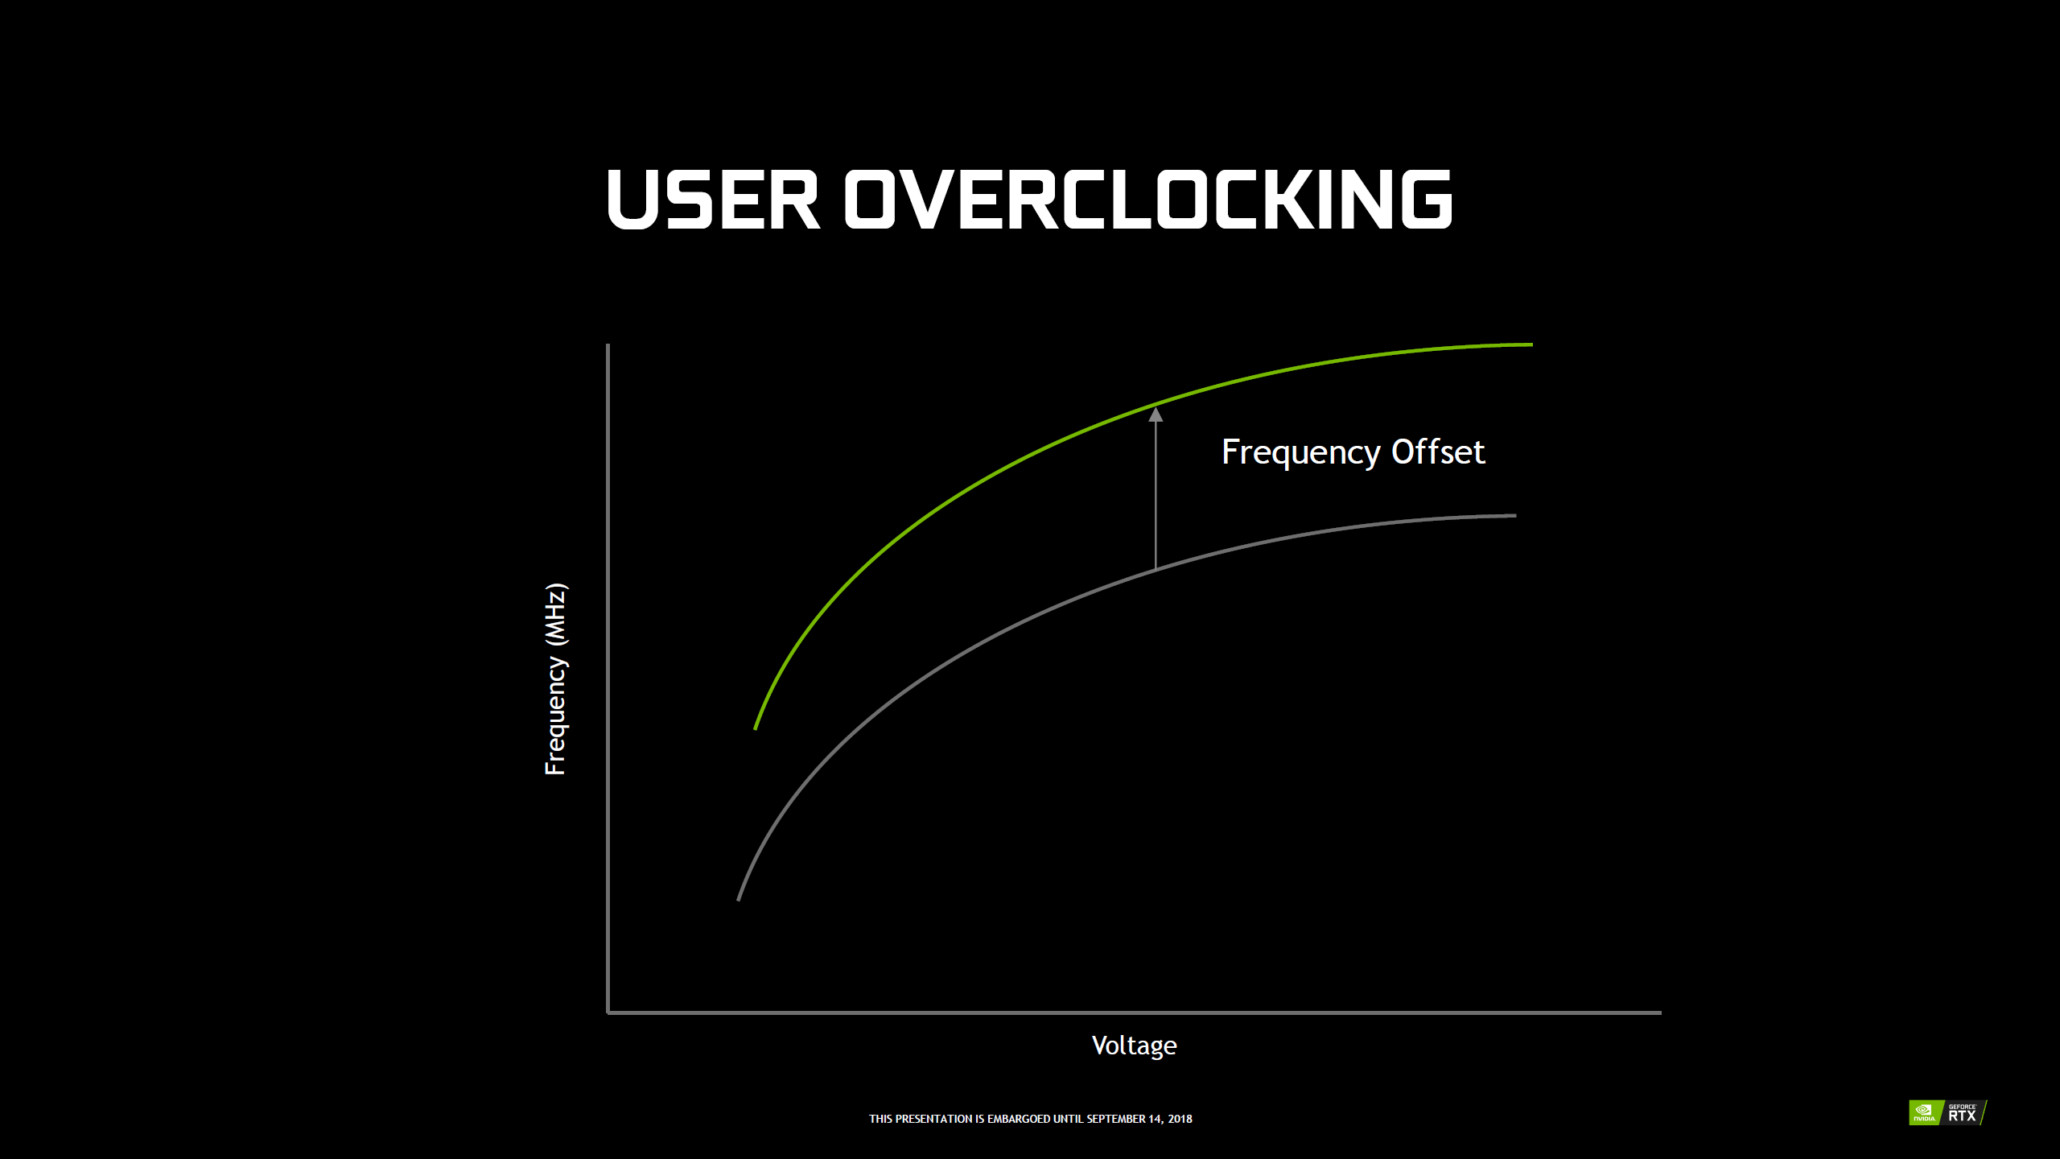
- Advanced GPU Boost control for NVIDIA GeForce RTX 20×0 series graphics cards. Extended voltage/frequency curve editor on GeForce RTX 20×0 family graphics cards allows you to tune additional piecewise power/frequency floor and temperature/frequency floor curves. Control points on those new curves allow you to control GPU Boost power and thermal throttling algorithms more precisely than traditional power limit and thermal limit sliders
- Hardware abstraction layer has been revamped to provide support for multiple independent fans per GPU due to introducing dual fan design on reference design NVIDIA GeForce RTX 20×0 series graphics cards and due to introducing native dual fan control in NVAPI. Both fans of NVIDIA GeForce RTX 20×0 can be monitored independently in hardware monitoring module now and can be controlled synchronically in manual mode
- Added NVIDIA Scanner technology support
- Added Monolithic Power Systems MP2884A and MP2888A voltage controllers support
- Added core, memory, auxiliary PEXVDD and auxiliary 1V8 voltage control for custom design MSI RTX 2080Ti Lightning series graphics cards with MP2888A + MP2888A +uP1816 voltage regulators
- Added VRM and VRM2 temperature monitoring for custom design MSI RTX 2080Ti Lightning series graphics cards
- Improved hardware monitoring module:
- Added thermal offset for CPU temperature monitoring on AMD Ryzen 7 2700X processors
- Similar CPU temperatures are now cloned for all cores on AMD CPUs to provide more convenient and unified On-Screen Display layout between Intel and AMD CPUs
- "Pagefile usage" graph in hardware monitoring module has been renamed to "Commit charge"
- Added group operation notifier to the caption of active hardware monitoring graphs list in "Monitoring" tab in the application properties. The notifier is informing you that you can apply a setting to all or to multiple selected hardware monitoring graphs when you hold group operation key (i.e. crap or Ctrl) and hover mouse cursor over the setting that can be applied to multiple hardware monitoring graphs at once (e.g. "Show in On-Screen Display")
- Added "Select by group" and "Select by type" commands to context menu of active hardware monitoring graphs list in "Monitoring" tab in the application properties. New commands allow selecting the graphs of exactly the same type (e.g. CPU1-CPU8 usage graphs on eight core CPU) or the graphs with the same OSD/LCD group name (for example, GPU clock, GPU power, GPU usage and the rest graphs with "GPU" group name). Such commands allow you to show similar items (e.g. all CPU usages) in On-Screen Display with a single click or rename a group for all child graphs in the single pass
- Multi-group edit mode is automatically selected now for group name edit field when you enable "Override group name" option while holding Ctrl key. You may still manually toggle this mode with Ctrl+M hotkey anytime when editing the group name
- On-Screen Display item type (i.e. text, graph or combination of both) is now displayed in "Properties" column of active hardware monitoring graphs list in "Monitoring" tab in the application properties
- Added programmable hotkey for clearing monitoring history
- Added "Apply" button to application properties window. Now you may iteratively customize monitoring module without closing the properties to see the result on each step. Please take a note that some properties (e.g. application language) cannot be applied until you completely close properties window by design of application
- Improved On-Screen Display layout editor:
- System reserved variable slots 250-255 are now displayed as system variables in the layout editor
- Added embedded graphs support. Embedded graphs can be displayed directly in the text in a separate column, it can be convenient for displaying per-core CPU usages
- Added embedded graph width adjustment variable to the "Graph" property node
- Added new "Graph placement" property node. You can use it to place each graph on top of text, on bottom or make it embedded in in text column
- Added new variables to "Separators" property node. Now you may define independent separators for the graphs located on top of text part, for the text part and for the graphs located on bottom of text part.
- Slightly altered interpretation of prolog and epilog separators. Please take a note that prolog separator is no longer automatically appended with new line symbol, so you must specify it manually when necessary and epilog separator is now displayed below the bottom group of graphs
- The list of hardware monitoring items in "Add item(s)" dialog window is alphabetically sorted now
- Added macroses for embedding any data from monitoring module into OSD text (e.g. prolog). You may use macroses to display anything available in the monitoring module, e.g. %CPU temperature%
- Improved On-Screen Display hypertext formatting performance due to more optimal macro replace strategy
- Revamped "modern web" layout. New layout is demonstrating new text formatting features including big custom framerate counter, custom embedded background and On-Screed Display header, custom benchmark and system time indicators and embedded CPU and GPU usage graphs
- On-Screen Display layouts are saved in monitoring profiles now
- Improved HwInfo plugin:
- Added UPS load, power, input voltage and charge level data sources to default plugin configuration
- ·mproved voltage/frequency editor:
- Voltage/frequency editor window is now available on AMD GPUs. On AMD platform it allows you to edit core frequencies and voltages independently per each P-State:
- Similar to NVIDIA GPUs, you may either adjust each point frequency or voltage independently with both mouse and keyboard or hold Shift and drag single point to apply similar frequency or voltage offset to all P-states
- Read only P-States are currently not tracked, which means that you can try to adjust the frequency and voltage for it but it will be ignored when applying the curve
- P-States locking functionality is not implemented yet
- Slightly increased default voltage range for voltage/frequency curve. Now you may lock voltage to lower values if you're using voltage/frequency editor to downvolt and reduce power consumption on your NVIDIA GPU. Power users may customize the range further, the voltage and frequency limits are fully adjustable via the configuration file
- Now you may press F5 key in the editor window to reread the curve from hardware. This feature can be useful when adjusting the curve in changing thermal environment
- Voltage and frequency axes are dynamically scales now, so the captions do not overlap when window is too small
- Improved hardware control shared memory interface. During the past years, external applications like MSI Remote Server were using this interface for tuning GPU hardware settings remotely from external applications. The improvements are intended to allow connecting external stress testing and automatic overclocking related applications to MSI Afterburner via this interface:
- Now voltage/frequency curve on NVIDIA Pascal and newer NVIDIA GPU architectures is accessible via hardware control shared memory interface
- New hardware control shared memory interface command allows MSI Afterburner to load hardware settings from external application without immediately applying new settings to GPU
- Added notification message, allowing external applications to notify MSI Afterburner about new command written to hardware control shared memory. Without the notification, MSI Afterburner is executing external commands on each hardware polling iteration like before. Please refer to SDK and MACMSharedMemorySample source code to see notification message usage example
- Added hardware identification info to GPU entries in hardware control shared memory. Hardware identification info allows external applications to reconcile own enumerated devices with logical GPUs enumerated by MSI Afterburner
- Now hardware control shared memory is refreshed on delayed fan speed readback events
- New bundled MSI Overclocking Scanner application in now included in MSI Afterburner distributive:
- MSI Overclocking Scanner is currently supported on NVIDIA GTX 10×0 and NVIDIA RTX 20×0 series graphics cards under 64-bit operating systems only. On such systems you may activate the scanner with dedicated button from the main application window or directly from voltage/frequency curve editor window
- MSI Overclocking Scanner is powered by NVIDIA Scanner technology, which is using proprietary algorithms to quickly and reliably test manually overclocked GPU stability or find the maximum stable GPU overclocking in automatic mode with a single click. The scanner is using embedded NVIDIA test load to stress GPU. The scanner provides you two functional modes:
- In test mode MSI Overclocking Scanner is stress-testing your manual GPU overclocking settings during approximately 5 minutes. The result is returned as GPU stability confidence level (0% - unstable, 100% - stable)
- In scan mode MSI Overclocking Scanner is stress-testing and slowly increasing clocks on voltage/frequency curve points and this way automatically detecting the maximum stable GPU overclocking. The result is returned as modified voltage/frequency curve and average GPU overclocking in MHz
- Added framerate limiter compatibility settings group to "On-Screen Display" tab to the application properties. The settings include programmable hotkeys for globally disabling, enabling or toggling framerate limiting techniques of RivaTuner Statistics Server. The settings are intended to provide a way to dynamically enable or disable scanline sync technology based framerate limiting without altering application profiles, however you may use it to toggle traditional framerate limiter as well
- Fixed kernel mode hardware access interface fix for AMD Vega GPUs. HBM temperature, GPU power and GPU voltage are no longer returning bogus values when kernel mode hardware access interface is enabled on AMD Vega series graphics cards
- Hardcoded voltage/frequency curve clock multiplier implementation has been replaced with heuristic multiplier detection in order to provide unified voltage/frequency curve control implementation for NVIDIA Pascal and newer NVIDIA GPU architectures
- Improved real-time voltage/frequency curve editor GUI scaling. Now GUI is scaled property when adjusting skin scaling with open voltage/frequency curve editor window
- Improved report window, fan curve editor window, monitoring window and voltage/frequency curve editor scaling for scaling ratios greater than 100%
- Multilanguage user interface library is DPI aware now. Main window skinned interface is no longer being scaled by OS and no longer looks blurred by default when greater than 100% DPI is selected. Now main skinned window interface can be manually zoomed with skin scaling slider in "User interface" tab, and the properties are automatically scaled by OS according to selected DPI
- Added new skin scaling mode for power users. New mode provides better scaling performance at the expense of some scaling image quality loss
- Skin scaling implementation is now asynchronous, so increasing skin scaling ratio doesn't increase GUI update time and doesn't decrease GUI response time
- Skin scaling slider range has been extended from 75%-150% to 75%-200%
- RivaTuner Statistics Server has been upgraded to v7.2.1
57 Comments on Version 4.6.0 Beta 10 of MSI Afterburner Introduces OC Scanner for Pascal
Just follow the directions in the video with a minor difference:
After scanning IMMEDIATELY apply your curve and save it to a profile. Or your curve will be lost and you have to start all over again.
Also do not slide the power and temp limiter before scanning. That will create instability issues. Leave them as default and do the scanning.
As for fan curves you can do 100% fan speed before scanning, but then that means the stability is only good if you blast it at 100% fan all the time.
For me I just used a custom fan curve and start scanning afterwards.
Has anyone found how to save complete OC profiles + OSD settings? Where are the config files? There is no import or export function.
Wonder if @AlexUnwinder can confirm this? I didnt experience any issues doing so.
...what does scanning have to do with saving profiles? I dont use the OSD...but wondering how scanning helps save profiles.
You need to save the results to a new profile after doing the scan, then set it as the active profile so it uses it when your card clocks up.
Noticed same thing as you, this OC scanner is quite conservative, and it resulted in different attempts between +60 and +80 Mhz, putting the card at the same level as it starts from bios, and the curve barely touching 2000 Mhz.
However, doing manual overclock (120% TDP, linked) I can push it to around +125 without voltage tweaks, and +150 by adding a bit to max voltage (+10%), occasionally seeing 2100Mhz, with measurably higher scores in benchmarks.
I probably have a pretty good chip, if I would convert this card into water cooled via custom loop block to keep the temps under 60 degrees I could probably even reach 2150 Mhz without crashing. (Tried it on air and it wasn't stable, reaching 90+ degrees even with the fan at 100% and crashing after 20-40 seconds)
I think this scanner API was designed for "reference" cards which do not come already overclocked. For factory overclocked models it does ... well, nothing.
You leave the power limit at 100%, run scanner, apply settings, turn up power limits.
No more thinking to OC a GFX for me... it's just clicky clicky now...
Mine keeps disappearing and if I reboot my Windows 10 it works again.
(I don't understand why you have to change to a shitty MSI AB skin to get access to the feature, but oh well.)Nope, I have one of these www.techpowerup.com/gpu-specs/msi-gtx-1070-armor-oc.b3654 and default boost is 1746, OC Scanner pushed it all the way to 1961.5 (with +100 vCore/126% power).
I've been following this forum from time to time, and only joined today for my first post. Although technically minded I have limited overclocking experience, please bear with me, thanks.
Two Gigabyte RTX 2080 cards were tested to check and compare their health and performance:
VCard 1=Windforce 8Gb OC (Bios F4Beta) and VCard 2= Gaming 8Gb OC (Bios F8), with max Power of 120 and 122 %TDP after Bios upgrade.
There was no problem running AB OC scanner its included Test with the first card. On the other hand, for the second one (Gaming) the monitor screen went black for several seconds (1s to 10s), and usually, this happened just at the change over from Point 1 to 2, and 3 to 4 and the end of the scan. The Power Limit (and Temperature Limit) slider was tested between default and max out and also the voltage control and monitor locks were toggled and not to avail. I let the room temperature drop for the tests between 13.6-15.7C, GPU max temp =56-72C (+42 to 52 relative to RT), Gaming has a little better cooler than Windforce. The Fan was tested with Auto and custom curve and also with a set value of 80-100%.
For stress tests, I have also used 3DMark , FurMark, Heaven, ... None of these runs exposed instability for either of these cards though. The best average OC from MSI AB OC Scan tool were: Windforce = 73MHz (max GPU Temp = 68C, RT=13.6) and Gaming = 61MHz (Max GPU temp =62C, RT=15.6), repeats for gaming had more variability 53-61MHz, averaging in the 50s.
Is the screen going black a typical "instability" as quoted below?
Can these be a sign that the "Gaming" card having some underlying issues not present in the "Windforce" card? Is it power limited? (Did forget that the CPU had been set on Boost 4200 -> 4800 MHz when Benchmark a couple of days ago. Platinum 550W PSU, M.2 SSD, 3 120 PWM case fan, low profile Noctua CPU fan. Silverstone confirmed the PSU should be fine.)
Interestingly the hickups of the Gaming card never prevented it from failing the OC scan, and often the scan at point 4 was taking longer with no black screen until the end of run scan flicker.
Another note, I noticed that with constant fan setting, say 100%, for Point 4, the fan control seemed to have switched to Auto/Custom and then reverted back to 100% once the scan had ended. Anyone else noticed this?
The goal here is not to overclock my GPU but to test the health and performance of these cards. One was a new card but looked like an opened box (Windforce), the other was a like-new item (Gaming), which didn't come in the original box. This made me concerned and suspicious (especially for the Gaming OC card - hence these quick series of benchmarking- and stress-tests. I will keep one in the end and these quick tests were carried out to help decide.
Any thoughts and recommendations for testing these two cards?
Thank you for your inputs, it'll be greatly appreciated.
D
The Gigabyte RTX 2080 Gaming OC was further tested to look into possible insufficient PSU power. The very first change was to go in my MSI Z270 Carbon Pro Motherboard Bios to switch off the I7-7700K CPU Boost option from 4800MHz back to 4200MHz. The control fo the case fans were modified in stages as follow:
1) First, the three 120 PWN arctic case fans were set to manual values, and so was the trio fans on the GPU in an effort to minimize fluctuation in load and noise
2) Once the case ran sufficiently cool, on a second pass both an HDD and an Optical DD were removed.
3) Fan control was changed back Custom profile in the end, with at RT=17C, Idle GPU Temp=28C.
The trends looked less noisy but overall the average OC frequencies achieved were between 53 to 56MHz.
For the last OC scan, at the end of the pass for Point 4 (i.e just before results), GPU Temp max=54C (Custom profile GPU Fan=54%), GPU core clock 2040MHz. Voltage locks were back ON and Limit Power=100, Limite Temp=83C. Scan succeeded, average overclock is 53MHz, and a message about Dominant limiters: Voltage, No load.
The goal was leaner power usage on my HTPC/VR system, and it seems that it helped but the instabilities still occur. It is not clear cut my Silverston Strider Platinum 80 Plus 550W PSU is really insufficient.www.amazon.com/gp/product/B017WL5UIG/ref=oh_aui_search_asin_title?ie=UTF8&th=1
The few PSU calculators I tried indicated that even with peak load for all components, the requirement was expected to be between 480-510W - and that was before removing the two drives and there one PCI-e x1 TV tuner I can remove too.
Can this black screen instabilities a cause for concern (i.e. GPU health/performance)? Are they really indicative of PSU issue?
Was this GPU abused already (before I got) or is it just a case of the "Silicon lottery" that it performs poorly on these quick scans and stress tests in comparison with the other Graphic card, the RTX 2080 Windofrce 8Gb OC?
On a side note, when the GPU Trio Fans were set to a fixed value, the value did vary for point 3 and point. Usually, for point 3, it dropped below and it ramped back up and overshot for point 4 tests. ANyone else noticed, and is it expected?
I am learning a lot in the process and there are quite a few variables. Thank you for reading my posts today. Looking forward to some pointers and clarifications about Afterburner's OC Scan tool.
Thank you.
D
Good to hear, it makes sense intuitively. It was surprising that these two similar Gigabyte card designs behave so differently.
www.gigabyte.com/Comparison/Result/3?pids=6705,6706
So the display signal loss (screen going black) for 1 to 10s is nothing to worry about during the scan?
It isn't unusual that it picks up 2 to 4 times per scan OC values (freq./Voltage pairs) that would be out of spec and throw the fit off then?
A card that would have been driven hard would not behave like this, would it?
Also, I found the performance of the Gaming model underwhelming in comparison with the Windforce, which was unexpected (and seemed suspicious). The main draw towards the Gaming OC model is a slightly better cooling unit and slightly larger trio fans, which lend to lower temp and in theory, improved boost mode OC (about 30MHz from the factory according to specs in the link above). My HTPC/VR case is compact and the little more efficient air cooling for about the same price would help towards quieter and lower temp operations.
As I mentioned in my emails, it was cheaper because it was a like new-used item, and considering the economics, and that it is covered with warranties (from Amazon and Gigabyte), I made the plunge. The irony is it seemed it'd be a clear cut decision to return the Windforce model. Of course, with such big sticker price, I have been second guessing myself since the bargain is not all that much less than prices new with a promotion this past week - and it does not include the two NVidia Bundle games (more curious than hardcore games). A reason to decide which to return is easier if there is a suspected hardware issue.
Stress benchmarking testing and OC Scanning seemed like a reasonable approach. Buying used new computer part is tricky.
Thank you for your input,
D