Monday, July 13th 2026

MSI Afterburner to Include Hit Map for GPU Voltage/Frequency Curve Visualization
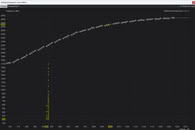
MSI Afterburner has been experimenting with a voltage/frequency curve editor that includes a heat map. This feature helps users understand the exact frequency their GPU achieves when given a certain voltage level. According to MSI Afterburner developer "Unwinder," the next beta release of this popular utility will allow users to record and visualize the V/F heat map by pressing "M" on their keyboard while in the editor. Once recorded, users can observe the NVIDIA GeForce RTX GPU Boost algorithm in action and see how the GPU switches to different voltage points based on frequency scaling. This process follows the pre-defined V/F curve set for GPU frequency scaling and boosting when needed.
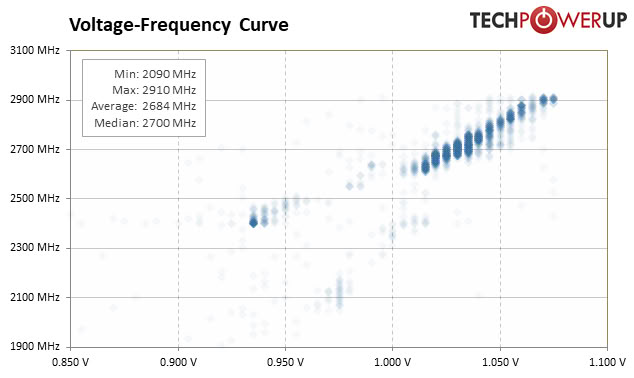
The developer also noted that starting with the "Blackwell" architecture, NVIDIA improved its dynamic voltage frequency scaling (DVFS) within the GPU Boost algorithm. In older architectures, GPU Boost would jump between target V/F points without intermediate values. However, starting with "Blackwell," the curve is much more gradual, and the V/F targets switch up to 1,000 times faster than before, thanks to the DVFS improvements. In the MSI Afterburner beta, this can be seen with a heat map that uses gradients of yellow to indicate the most frequently hit GPU V/F curve points. Below is the GeForce RTX 5090 boosting pattern recorded by the MSI Afterburner beta.
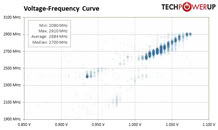
 Additionally, the software records the GeForce RTX 4090 boosting profile, highlighting the differences between the "Ada Lovelace" and the latest "Blackwell" GPU generations in terms of V/F scaling and DVFS operation. Interestingly, TechPowerUp reviews use our own custom software for visualization, which is highlighted in the second image.
Sources:
Unwinder, via VideoCardz
The developer also noted that starting with the "Blackwell" architecture, NVIDIA improved its dynamic voltage frequency scaling (DVFS) within the GPU Boost algorithm. In older architectures, GPU Boost would jump between target V/F points without intermediate values. However, starting with "Blackwell," the curve is much more gradual, and the V/F targets switch up to 1,000 times faster than before, thanks to the DVFS improvements. In the MSI Afterburner beta, this can be seen with a heat map that uses gradients of yellow to indicate the most frequently hit GPU V/F curve points. Below is the GeForce RTX 5090 boosting pattern recorded by the MSI Afterburner beta.


7 Comments on MSI Afterburner to Include Hit Map for GPU Voltage/Frequency Curve Visualization
i am never using windows again
Besides familiarity and overall game support, one of the final things tying me to Windows is the lack of solid OC tools and tests on Linux (or, at least my lack of knowledge of easily accessible Linux alternatives).
If Afterburner where to become easily accessible in Linux, I would seriously consider switching to SteamOS... at least once nVidia drivers are fully sorted.
I would have no issues running Windows for a few weeks on a new platform to get the RAM and CPU tuned in, but not being able to tune the GPU in Linux sucks :(
The problem is with more obscure smaller utilities that haven't been updated in years - even on Windows, and completely lack Linux alternatives.
Or very new utilities that naturally start with Windows builds.