Friday, October 30th 2026

Intel Nova Lake-S Promises Up To 17% Single-Thread and 20% Gaming Performance Improvements

A lot of information relating to Intel Nova Lake-S has emerged leading up to the official launch in early 2027, including official information from Intel detailing the Nova Lake architecture and a recent benchmark leak that promised significant single-thread performance improvements on a 28-core Nova Lake-S part. However, a recent leak out of @Haze2K1 on X, shared by VideoCardz, purports that the real-world performance improvements for Intel's Nova Lake desktop CPUs are in the double digit range.

While the leaker has been around for a while, there is no guarantee that this information is accurate, since the only cited source is "circulating chatter," however, the claim is that Intel's Nova Lake will outperform comparable last-generation Arrow Lake CPUs by 8-17% in raw single-thread performance, 15% in general-purpose workloads, and up to 20% in gaming. There is some nuance to these claims, with the 17% improvement figure exclusive to the higher-end CPUs that feature bLLC, while the 17% boost allegedly comes from the implementation of Intel's new Advanced Performance Extensions.
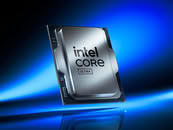
Some of that performance improvement will also come from memory controller improvements, since Nova Lake is meant to use DDR5-8000 memory out of the box, where Arrow Lake was relegated to 6400 MT/s. How this all shakes out, however, remains to be seen, since Intel has only promised more information at CES in January 2027.
Sources: VideoCardz, Haze on X
Add your own comment

54 Comments on Intel Nova Lake-S Promises Up To 17% Single-Thread and 20% Gaming Performance Improvements

#51
Geddagod
randomdude9182Well, I mean look at this video:
And your comparing a flagship to a budget chip. And a refresh flagship with 10% higher performance. I used the hx370 scores beacuse comparing a refresh to the original release isnt a fair comparison.
I said 33% beacuse I was comparing market-segment at RELEASE without TUNING THE CLOCKS WITH HIGHER BINS. (Im using the 370 here for that exact reason).
I dont use notebookcheck. Geekbench 6 lists them as 2700 ish
The problem with using Geekbench's official scores is that a ton of their results are from runs that are in eco mode, or on battery, or are thermal throttling, etc etc.
You can use the HX 370 to, the single core score of that chip is still ~2900 points. Meaning the gap is still only ~15% in ST, not 24% or 33%.
randomdude9182the 2900 points was probably beacuse they are at 85W if you see the chart. This zen6 chip is pulling 12W, at the balanced profile with unoptimized clocks at 5.4ghz, which is about the same boost for the HX 470.
You don't gain that much ST perf from 85 watts vs the default of what, 45 watts for an H series chip?
I'm curious though where do you see that the zen 6 chip is running at 12 watts?
randomdude9182Zen6 just recently had a huge press, its claimed IPC uplift is anywhere from 20-30% (proably about 24% on DT. got this directly from powerup's new article).
That's what was claimed, but Chips and Cheese's testing has revealed the IPC uplift in spec2026 to be ~10-15% IIRC.
randomdude9182Server chips are running close to 5.9ghz across all cores.
Their Zen 6 HF chips Fmax is 5.3GHz, and their dense cores is IIRC 4.1GHz
Their server chips are not running even close to 5.9GHz on one core much less all cores
randomdude9182This source says 28% (unfinalized, likley closer to 33% with finalized tuning and performance profile).
This source also makes the same mistake you made, which is using GB's average scores instead of the scores of the chips actually tested in reasonable testing conditions.
Posted on Reply
#52
RinSenpai
randomdude9182Zen6 just recently had a huge press, its claimed IPC uplift is anywhere from 20-30% (proably about 24% on DT. got this directly from powerup's new article).
AMD also had a huge press release which claimed the Ryzen 9 5900XT was 2-5% faster than the 13700K/13900K on DDR5 with just a footnote mentionning the use of a RX 6600. That's why I won't believe such statements until independent reviewers get their hands on it. That's why nobody believed in the 4090 being 70% faster than the 3090 at literally everything at first, until independent benchmarks proved this to be real.
Posted on Reply
#53
randomdude9182
RinSenpaiAMD also had a huge press release which claimed the Ryzen 9 5900XT was 2-5% faster than the 13700K/13900K on DDR5 with just a footnote mentionning the use of a RX 6600. That's why I won't believe such statements until independent reviewers get their hands on it. That's why nobody believed in the 4090 being 70% faster than the 3090 at literally everything at first, until independent benchmarks proved this to be real.
And? That dosnet disprove my claim. The benchmarks already disprove it.
GeddagodThe problem with using Geekbench's official scores is that a ton of their results are from runs that are in eco mode, or on battery, or are thermal throttling, etc etc.
You can use the HX 370 to, the single core score of that chip is still ~2900 points. Meaning the gap is still only ~15% in ST, not 24% or 33%.


You don't gain that much ST perf from 85 watts vs the default of what, 45 watts for an H series chip?
I'm curious though where do you see that the zen 6 chip is running at 12 watts?

That's what was claimed, but Chips and Cheese's testing has revealed the IPC uplift in spec2026 to be ~10-15% IIRC.

Their Zen 6 HF chips Fmax is 5.3GHz, and their dense cores is IIRC 4.1GHz
Their server chips are not running even close to 5.9GHz on one core much less all cores

This source also makes the same mistake you made, which is using GB's average scores instead of the scores of the chips actually tested in reasonable testing conditions.
issue is, we also dont know if the zen6 chip is thermal throttling. The profile listed under geekbench was balanced. This point does not make sense. Average scores are going to be the MOST accurate beacuse it balances out extreme results or desktop style embeded motherboards or high power laptops with much more agressive performance tuning than the run of the mill chips. Your graph literally says 85W, letting the freqency STAY at 5.4ghz instead of boosting for a few seconds is this behavior. Geekbench said the power draw was 12W. Common man. Dont use two different benchmarking results, use the scores directly from ES to ES, not retail parts with higher perf and tested completley differently to try and disprove me when your methodology is basically comparing a non-final, lower performance balanced windows profile chip with the BEST, not average, BEST extremes on the graph. Zen5 mobile ES scores even lower than my figures.
GeddagodThe problem with using Geekbench's official scores is that a ton of their results are from runs that are in eco mode, or on battery, or are thermal throttling, etc etc.
You can use the HX 370 to, the single core score of that chip is still ~2900 points. Meaning the gap is still only ~15% in ST, not 24% or 33%.


You don't gain that much ST perf from 85 watts vs the default of what, 45 watts for an H series chip?
I'm curious though where do you see that the zen 6 chip is running at 12 watts?

That's what was claimed, but Chips and Cheese's testing has revealed the IPC uplift in spec2026 to be ~10-15% IIRC.

Their Zen 6 HF chips Fmax is 5.3GHz, and their dense cores is IIRC 4.1GHz
Their server chips are not running even close to 5.9GHz on one core much less all cores

This source also makes the same mistake you made, which is using GB's average scores instead of the scores of the chips actually tested in reasonable testing conditions.
Its in the video...
Posted on Reply
#54
Geddagod
randomdude9182And? That dosnet disprove my claim. The benchmarks already disprove it.


issue is, we also dont know if the zen6 chip is thermal throttling. The profile listed under geekbench was balanced. This point does not make sense. Average scores are going to be the MOST accurate beacuse it balances out extreme results or desktop style embeded motherboards or high power laptops with much more agressive performance tuning than the run of the mill chips. Your graph literally says 85W, letting the freqency STAY at 5.4ghz instead of boosting for a few seconds is this behavior. Geekbench said the power draw was 12W. Common man. Dont use two different benchmarking results, use the scores directly from ES to ES, not retail parts with higher perf and tested completley differently to try and disprove me when your methodology is basically comparing a non-final, lower performance balanced windows profile chip with the BEST, not average, BEST extremes on the graph. Zen5 mobile ES scores even lower than my figures.


Its in the video...
If you want to complain that the GB 6 scores are incomparable because the zen 6 ES chip being tested under unknown conditions, don't bother comparing it to Zen 5 at all then. Even for ES chips, you can have different stages of ES or ES chips that are in different chassis or power limits, so at that point just wait for reviews before making any claims about zen 6.

But comparing zen 6 ES samples to the average GB website scores instead of the scores of zen 5 tested in actual laptops in reviews under reasonable testing conditions just to make the gap larger than what it should be, is just unreasonable.
Videocardz and other websites using those scores to make better sounding headlines is, in their eyes, "justifiable" for clickbait. What's your excuse?

I'm not even using the best scores, the average is ~2900 points. Not just the best results.
This is for the HX 370:

Also where in GB did it say the power draw was 12 watts? GB doesn't measure power draw...
But also as I mentioned in my comment above, single core performance doesn't scale with power to 85 watts like how you are implying it does. Take a look at this chart:
randomdude9182Its in the video...
Idk what video you are referring to, and what point that video is even supposed to show?
You just quoted my entire reply.
Posted on Reply
Add your own comment
Nov 12th, 2026 06:33 PST change timezone

New Forum Posts

Popular Reviews

TPU on YouTube

Controversial News Posts