Friday, October 23rd 2020

AMD Ryzen 5 5600X Takes the Crown of the Fastest CPU in Passmark Single-Thread Results

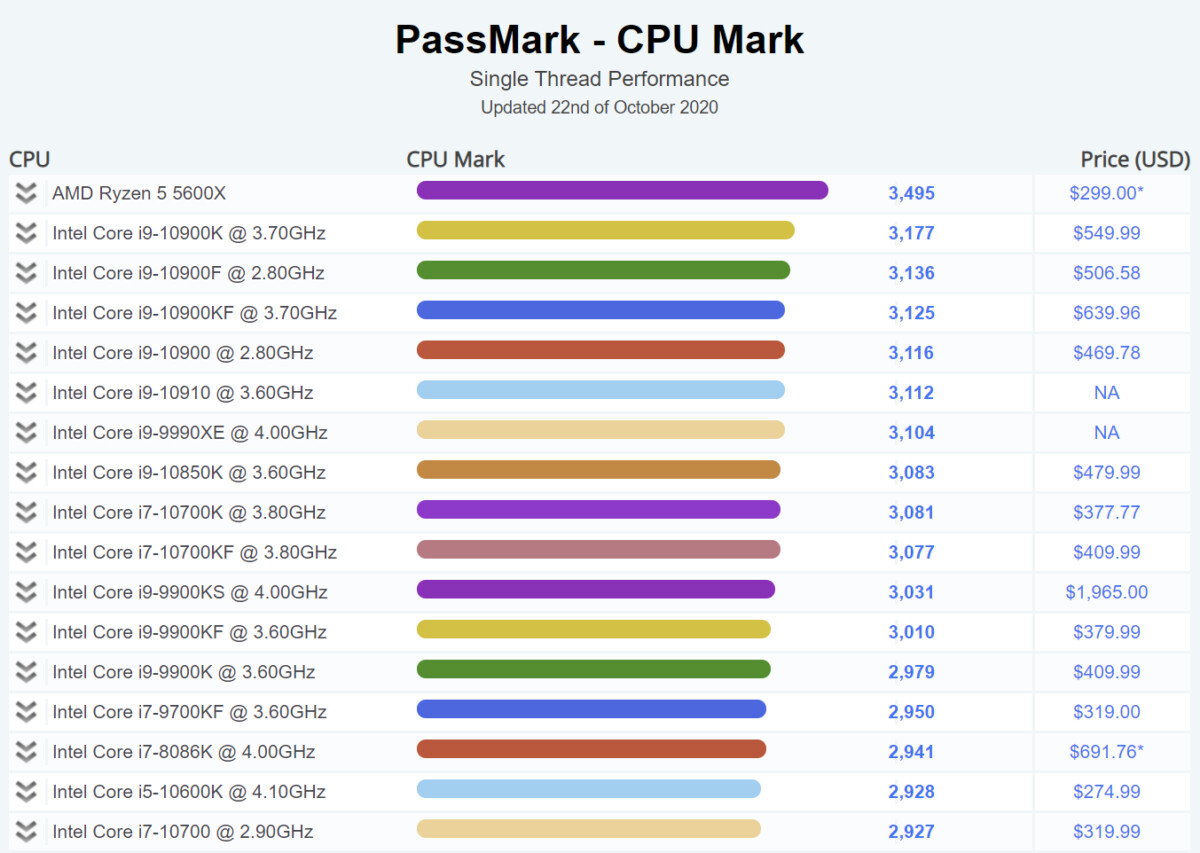
AMD has been improving its Zen core design, and with the latest Zen 3 IP found in Ryzen 5000 series CPUs, it seems like the company struck gold. Thanks to the reporting of VideoCardz, we come to know that AMD's upcoming Ryzen 5 5600X CPU has been benchmarked and compared to other competing offerings. In the CPU benchmark called PassMark, which rates all of the CPUs by multi-threaded and single-threaded performance, AMD's Ryzen 5 5600X CPU has taken the crown of the fastest CPU in the single-threaded results chart. Scoring an amazing 3495 points, it is now the fastest CPU for 1T workloads. That puts the CPU above Intel's current best—Core i9-10900K—which scores 3177 points. This puts the Zen 3 core about 10% ahead of the competition.

As a reminder, the AMD Ryzen 5 5600X CPU is a six-core, twelve threaded design that has a base clock of 3.7 GHz and boosts the frequency of the cores to 4.6 GHz, all within the TDP of 65 Watts. The CPU has 32 MB of level-3 (L3) cache and 3 MB of L2 cache.
Source: VideoCardz
Add your own comment

141 Comments on AMD Ryzen 5 5600X Takes the Crown of the Fastest CPU in Passmark Single-Thread Results

#126
RandallFlagg
Zach_01I never said anything about OC, you keep bringing it up.
Here we are talking about the 5000 series CPUs and you have gone back 2 gens for both Intel and AMD talking about OC... to proof what exactly? How superior Intel Is?

Well have it...
www.techpowerup.com/forums/threads/raja-koduri-to-present-at-samsung-foundry-forum-amid-intels-outsourcing-efforts.273802/
If you go back and read what I was responding to - nevermind, i'll do that for you too.

It was a rebuttal to the veracity of AMDs performance claims. In relation to Zen 3, that chart I posted about Zen 2 vs Gen 9, is pretty close to their current claims. I seriously doubt you are going to see a 5600X unseat say a 10600K in gaming in the real world. Match it - maybe. Beat it in any significant way, not likely.
Posted on Reply
#127
Unregistered
Funny how only intel users are fanboys to amd users.

Sick of all this crap on TPU.

If this 5600x is as good as it seems, then i will probably switch to it. I have no care for either Intel/Amd or Nvidia/Radeon. I just buy what is best for what i can afford.
Posted on Edit | Reply
#128
thesmokingman
dir_dHow can you talk about the performance of a 3600 then turn around and give power numbers for a 2700x, come on man...
You have to ignore the resident shill.
Posted on Reply
#129
Makaveli
tiggerFunny how only intel users are fanboys to amd users.

Sick of all this crap on TPU.
Nothing funny about it. There are fan boys on both sides and its also not a TPU only issue.

this crap goes on all over the internet.

At the end of the day your allegiance should be to your wallet alone and buy what you like.
Posted on Reply
#130
Zach_01
RandallFlaggIf you go back and read what I was responding to - nevermind, i'll do that for you too.

It was a rebuttal to the veracity of AMDs performance claims. In relation to Zen 3, that chart I posted about Zen 2 vs Gen 9, is pretty close to their current claims. I seriously doubt you are going to see a 5600X unseat say a 10600K in gaming in the real world. Match it - maybe. Beat it in any significant way, not likely.
This is a different matter than OC capabilities. I understand, you have no faith to AMDs claims. Its your right. But bringing a slide that claims parity in 8 games and then a TPU chart that proof this wrong by 2.7% in 15 games is not actually a discovery nor that disproofs AMD's integrity. If we start this about marketing claims and perspectives that corporations try to present we will end by 2022. Intel has worst claims in the recent years. AMD seems to getting better their sh1ts together the last couple of years if not more. And in last ZEN3 anouncment they seemed more professional. They even showed games that traditionally lose.

I know and many know that synthetics do not tell the truth about actual real life performance. But tell me (or show) this... How much faster is the 10600k in gaming (1080p) than a 3600X?
Posted on Reply
#131
RandallFlagg
Zach_01...

I know and many know that synthetics do not tell the truth about actual real life performance. But tell me (or show) this... How much faster is the 10600k in gaming (1080p) than a 3600X?
It's in the chart I posted, 7.6% on average FPS at stock speed.

To note, these differences become even more pronounced with new faster GPUs. The 9900K had a 4.8% advantage over the 3900XT in TPUs comparison using the 2080 Ti.

When TPU did the 3900XT vs 9900K vs 10900K comparison with a 3080, that difference went to a full 10%.

It's clear Zen 2 was already limiting gaming performance, but Skylake+++ had more breathing room. It will be interesting to see what happens when they put a Zen 3 up against Gen10 with one of these new GPUs.
Posted on Reply
#132
Zach_01
RandallFlaggIt's in the chart I posted, 7.6% on average FPS at stock speed.

To note, these differences become even more pronounced with new faster GPUs. The 9900K had a 4.8% advantage over the 3900XT in TPUs comparison using the 2080 Ti.

When TPU did the 3900XT vs 9900K vs 10900K comparison with a 3080, that difference went to a full 10%.

It's clear Zen 2 was already limiting gaming performance, but Skylake+++ had more breathing room. It will be interesting to see what happens when they put a Zen 3 up against Gen10 with one of these new GPUs.
+7.6% difference for the 10600k. And if we apply the same 3080 rule (3900XT vs 10900k) that difference will go were? to 15%? maybe 16%?
And the 5600X with +20% IPC and and another 4.5% speed uplift on top of that wont make it past that 16%?
I know its not 1:1 for IPC+MHz against gaming % perf but still, will see.
And dont we start about the multi threaded perf... or the power draw... let it go.
Posted on Reply
#133
RandallFlagg
Zach_01+7.6% difference for the 10600k. And if we apply the same 3080 rule (3900XT vs 10900k) that difference will go were? to 15%? maybe 16%?
And the 5600X with +20% IPC and and another 4.5% speed uplift on top of that wont make it past that 16%?
I know its not 1:1 for IPC+MHz against gaming % perf but still, will see.
And dont we start about the multi threaded perf... or the power draw... let it go.
IPC is really almost meaningless, I've not seen any site effectively measure it as it is very use case specific. For example, you choose to use Cinebench to measure IPC. And what if I choose to user SuperPi, where a 4.3Ghz 10400 whacks a 4.5Ghz 3600XT to the tune of 8% better performance with 4% lower clocks? That would mean the 10400 has 10-12% better IPC, now wouldn't it?

Basically in the end, it all comes down to the benchmarks in the things you use. Every time someone starts talking nm / IPC / Ghz - that's just meaningless drivel in the end.
Posted on Reply
#134
Valantar
RandallFlaggIt's 179W on torture test. Note that is (far) less than a 2700X stock on the same test:

Again, you are very much misrepresenting the truth here. Are you even reading the graphs you are posting? 179W is a lot more than the 125W of a stock 2700X in the same test. It is less than the 223W of an overclocked 2700X in the same test, and the stock 9600K at 119W is slightly lower than the 2700X at stock.
RandallFlaggIf you go back and read what I was responding to - nevermind, i'll do that for you too.

It was a rebuttal to the veracity of AMDs performance claims. In relation to Zen 3, that chart I posted about Zen 2 vs Gen 9, is pretty close to their current claims. I seriously doubt you are going to see a 5600X unseat say a 10600K in gaming in the real world. Match it - maybe. Beat it in any significant way, not likely.
A) AMD's performance claims this go around are not only about a general IPC uplift, but also specific improvements in latency-sensitive applications like games. With the 3600X they made no such claims, only an overall IPC improvement. In other words, Ryzen 5000 is specifically made to improve on this one point where Intel was still beating them, and it has a major architectural change (the unified L3 cache) as well as several smaller ones done with the express intent of achieving this.
B) With Zen 2 vs. Gen 9, AMD was going from a ~8% IPC deficit to a ~7% IPC advantage. This time they're going from a ~7% IPC advantage to a ((107*1.19)-100=) 27.33% IPC advantage. That is certainly a much bigger change than last time around in relation to Intel's current desktop chips. (Ice Lake and Tiger lake have ~18% higher IPC than Skylake, but are only available for mobile.)
Posted on Reply
#135
Zach_01
RandallFlaggAnd what if I choose to user SuperPi, where a 4.3Ghz 10400 whacks a 4.5Ghz 3600XT to the tune of 8% better performance with 4% lower clocks?
Does it? I really dont know... Im asking.

And indeed how a SuperPi can determine CPU gaming performance... but nor a Passmark can.

And I didnt choose CB test for IPC determination uplift. AMD claimed that for an avg result over many different workloads. Not just Cinebench... So...
Posted on Reply
#136
RandallFlagg
Zach_01Does it? I really dont know... Im asking.

And indeed how a SuperPi can determine CPU gaming performance... but nor a Passmark can.

And I didnt choose CB test for IPC determination uplift. AMD claimed that for an avg result over many different workloads. Not just Cinebench... So...
I'm pointing out that it is trivial for me to choose a workload that favors one cpu over the other, so how much more trivial is it for AMD to choose a workload - or mix of workloads as you say - that puts their product in the best light. SuperPi isn't the only one where Intel excels in such a way that it would refute IPC claims, it also excels in OCR applications and 2D -> 3D image conversion as well as AI benchmarks. What say I make my workload mix made of those benchmarks?

Remember, you're the one that brought up 20% increase in "IPC", I simply said that IPC is meaningless.

So I think the real difference here, with Zen 3, is going to look like the difference between the 4.0Ghz 3100 and the 3300X on the chart in the link below, plus a few % for the clock increases. You'll just get it across the board at all SKUs. That would come out to more like +6-7%. Which would bring them roughly to parity with Comet Lake.

www.techpowerup.com/review/amd-ryzen-3-3300x/16.html
Posted on Reply
#137
Zach_01
RandallFlaggI'm pointing out that it is trivial for me to choose a workload that favors one cpu over the other, so how much more trivial is it for AMD to choose a workload - or mix of workloads as you say - that puts their product in the best light. SuperPi isn't the only one where Intel excels in such a way that it would refute IPC claims, it also excels in OCR applications and 2D -> 3D image conversion as well as AI benchmarks. What say I make my workload mix made of those benchmarks?

Remember, you're the one that brought up 20% increase in "IPC", I simply said that IPC is meaningless.

So I think the real difference here, with Zen 3, is going to look like the difference between the 4.0Ghz 3100 and the 3300X on the chart in the link below, plus a few % for the clock increases. You'll just get it across the board at all SKUs. That would come out to more like +6-7%. Which would bring them roughly to parity with Comet Lake.

www.techpowerup.com/review/amd-ryzen-3-3300x/16.html
What exactly the statement of "+19% IPC uplift in geomean of 25 workloads" could mean?

By the way, the example of 3100 vs 3300X is irrelevant. The claimed +19 IPC uplift that AMD has stated is not only from the unified (and larger now) cache but from a lot more architectural improvements


I really dont think that AMD will risk to embarace its self with these kinds of slides and in the end will be on par with the competition while they increase prices. Even the rocks will laugh and they know it. This time I think its serious, and some are doing everything they can to minimize the gravity of it.


Those 2 CPUs have only 100MHz difference. Do they dare to show this and be on par with Intel? How much of a difference would that be between 3600X, 5600X and 10600k? I wonder.
Posted on Reply
#138
Valantar
RandallFlaggI'm pointing out that it is trivial for me to choose a workload that favors one cpu over the other, so how much more trivial is it for AMD to choose a workload - or mix of workloads as you say - that puts their product in the best light. SuperPi isn't the only one where Intel excels in such a way that it would refute IPC claims, it also excels in OCR applications and 2D -> 3D image conversion as well as AI benchmarks. What say I make my workload mix made of those benchmarks?

Remember, you're the one that brought up 20% increase in "IPC", I simply said that IPC is meaningless.

So I think the real difference here, with Zen 3, is going to look like the difference between the 4.0Ghz 3100 and the 3300X on the chart in the link below, plus a few % for the clock increases. You'll just get it across the board at all SKUs. That would come out to more like +6-7%. Which would bring them roughly to parity with Comet Lake.

www.techpowerup.com/review/amd-ryzen-3-3300x/16.html
IPC will always be a simplification, as you can never test all the workloads. But there are still industry standard benchmarks that are widely seen as reliable, such as SPECcpu. Anandtech uses that for their IPC testing, and found Zen 2 to both match AMD's claims (despite them not being based on testing with SPEC) and overall beat Skylake++++ by ~7%. This clearly doesn't cover gaming performance, but it doesn't cover SuperPi either, given that it's not actually a useful workload. There is as such little reason to expect AMD's numbers for Zen 3 to not be representative, though there will as alwyd be outlier tests.

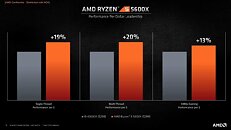
As for gaming performance, they are claiming much, much more than 19% performance improvement: their wording is that the 5900X when compared to the 3900X is "from 5% to 50% improved" with the overall improvements in their testing at 26%. You're presenting it as if they were saying "IPC is better, so games are better", but that is very explicitly not what they are saying; the claims about gaming performance are separate from the IPC claims, and are about specific SKUs compared (in other words including clock speed increases). Again, there will obviously be examples where Intel still wins. But there's little reason to not expect AMD to be on the money when they claim to beat the 10900k overall in gaming.
Posted on Reply
#139
RandallFlagg
Here are the full results from that Passmark, comparison to 5950X and 10900 (nonK).

Some of these scores don't quite add up to the hype. Keep in mind the i9-10900 here is limited on the graphics tests due to the 2070 Super VS 3080s in the two Ryzen boxes.

If these scores are real the performance on the 5600X is somewhat of a mixed bag.

What's funny here is, the one everyone posted is CPU Single Threaded MOps/Sec, ignoring everything else.


CPUAMD Ryzen 5 5600XAMD Ryzen 9 5950XIntel Core i9 10900
GPURTX 3080RTX 3080RTX 2070 Super
MemoryCMW16GX4M2C3200C16F4-3600C16-8GTRGF4-3466C16-8GTZR
DriveCT500P1SSD8T-Force TM8FP500Samsung 970 EVO Plus 1TB
Integer Math (MOps./Sec.)7793620208984927
Floating Point Math (MOps./Sec.)4036810608753041
Prime Numbers (Million Primes/Sec.)13622682
Extended Instructions (SSE) (Mill. Matrices/Sec.)173623814725627
Compression (KBytes/Sec.)266462616165376500
Encryption (MBytes/Sec.)16740403169003
Physics (Frames/Sec.)118813661302
Sorting (Thousand Strings/Sec.)278516787147355
CPU Single Threaded (MOps./Sec.)349536933336
Cross-platform Mark (Composite average)4408910276045984
Simple Vectors (Thousand Vectors/Sec.)171517
Fonts and Text (Ops./Sec.)281290328
Windows Interface (Ops./Sec.)586884
Image Filters (Filters/Sec)294626532673
Image Rendering (Thousand Images/Sec)375318401
Direct 2D (Frames/Sec.)757956
PDF Rendering (Ops./Sec.)578770
Direct 2D - SVG (Frames/Sec.)10010675
DirectX 9 (Frames/Sec.)275143264
DirectX 10 (Frames/Sec.)37360293
DirectX 11 (Frames/Sec.)537141435
DirectX 12 (Frames/Sec.)719061
GPU Compute (Ops./Sec.)16466156969106
Database Operations (KOps./Sec.)454581998444
Memory Read Cached (MBytes/Sec.)350223738436442
Memory Read Uncached (MBytes/Sec.)207912543120105
Memory Write (MBytes/Sec.)120671798118359
Available RAM (Megabytes)138691031727029
Memory Latency (ns (lower is better))564124
Memory Threaded (MBytes/Sec.)303795394543982
Disk Sequential Read (MBytes/Sec.)18174342890
Disk Sequential Write (MBytes/Sec.)9094002676
IOPS 32KQD20 (MBytes/Sec.)3702991393
IOPS 4KQD1 (MBytes/Sec.)853476
CPU Mark (Composite average)228244556424682
2D Graphics Mark (Composite average)112311821141
Memory Mark (Composite average)269234384271
Disk Mark (Composite average)11305414724995
3D Graphics Mark (Composite average)252581085020444
PassMark Rating (Composite average)745474839018
Posted on Reply
#140
Makaveli
RandallFlaggHere are the full results from that Passmark, comparison to 5950X and 10900 (nonK).

Some of these scores don't quite add up to the hype. Keep in mind the i9-10900 here is limited on the graphics tests due to the 2070 Super VS 3080s in the two Ryzen boxes.

If these scores are real the performance on the 5600X is somewhat of a mixed bag.

What's funn here is, the one everyone posted is CPU Single Threaded MOps/Sec. According to this, the 5950X is faster at single thread than the 5600X.......


CPUAMD Ryzen 5 5600XAMD Ryzen 9 5950XIntel Core i9 10900
GPURTX 3080RTX 3080RTX 2070 Super
MemoryCMW16GX4M2C3200C16F4-3600C16-8GTRGF4-3466C16-8GTZR
DriveCT500P1SSD8T-Force TM8FP500Samsung 970 EVO Plus 1TB
Integer Math (MOps./Sec.)7793620208984927
Floating Point Math (MOps./Sec.)4036810608753041
Prime Numbers (Million Primes/Sec.)13622682
Extended Instructions (SSE) (Mill. Matrices/Sec.)173623814725627
Compression (KBytes/Sec.)266462616165376500
Encryption (MBytes/Sec.)16740403169003
Physics (Frames/Sec.)118813661302
Sorting (Thousand Strings/Sec.)278516787147355
CPU Single Threaded (MOps./Sec.)349536933336
Cross-platform Mark (Composite average)4408910276045984
Simple Vectors (Thousand Vectors/Sec.)171517
Fonts and Text (Ops./Sec.)281290328
Windows Interface (Ops./Sec.)586884
Image Filters (Filters/Sec)294626532673
Image Rendering (Thousand Images/Sec)375318401
Direct 2D (Frames/Sec.)757956
PDF Rendering (Ops./Sec.)578770
Direct 2D - SVG (Frames/Sec.)10010675
DirectX 9 (Frames/Sec.)275143264
DirectX 10 (Frames/Sec.)37360293
DirectX 11 (Frames/Sec.)537141435
DirectX 12 (Frames/Sec.)719061
GPU Compute (Ops./Sec.)16466156969106
Database Operations (KOps./Sec.)454581998444
Memory Read Cached (MBytes/Sec.)350223738436442
Memory Read Uncached (MBytes/Sec.)207912543120105
Memory Write (MBytes/Sec.)120671798118359
Available RAM (Megabytes)138691031727029
Memory Latency (ns (lower is better))564124
Memory Threaded (MBytes/Sec.)303795394543982
Disk Sequential Read (MBytes/Sec.)18174342890
Disk Sequential Write (MBytes/Sec.)9094002676
IOPS 32KQD20 (MBytes/Sec.)3702991393
IOPS 4KQD1 (MBytes/Sec.)853476
CPU Mark (Composite average)228244556424682
2D Graphics Mark (Composite average)112311821141
Memory Mark (Composite average)269234384271
Disk Mark (Composite average)11305414724995
3D Graphics Mark (Composite average)252581085020444
PassMark Rating (Composite average)745474839018
You still going on with the hard reaching? You are not going to stop anyone from going Zen 3 with these post nor are you some kinda guru of hidden truth. Give it up!

The 5950X is suppose to be faster then 5600X in single thread because of clock speed.

The later has a 4.9Ghz Turbo and the other is 4.6Ghz.
Posted on Reply
#141
Valantar
MakaveliYou still going on with the hard reaching? You are not going to stop anyone from going Zen 3 with these post nor are you some kinda guru of hidden truth. Give it up!

The 5950X is suppose to be faster then 5600X in single thread because of clock speed.

The later has a 4.9Ghz Turbo and the other is 4.6Ghz.
Not to mention that in a lot of those tests a $300 6-core AMD CPU is beating a $500 10-core Intel CPU ... There are obviously use cases where the 10900K is faster still, but the more time passes, the fewer there seem to be.
Posted on Reply
Add your own comment
Apr 19th, 2024 15:06 EDT change timezone

New Forum Posts

Popular Reviews

Controversial News Posts